How a Food Manufacturer Cut Downtime
by 25% with KPI Dashboards?
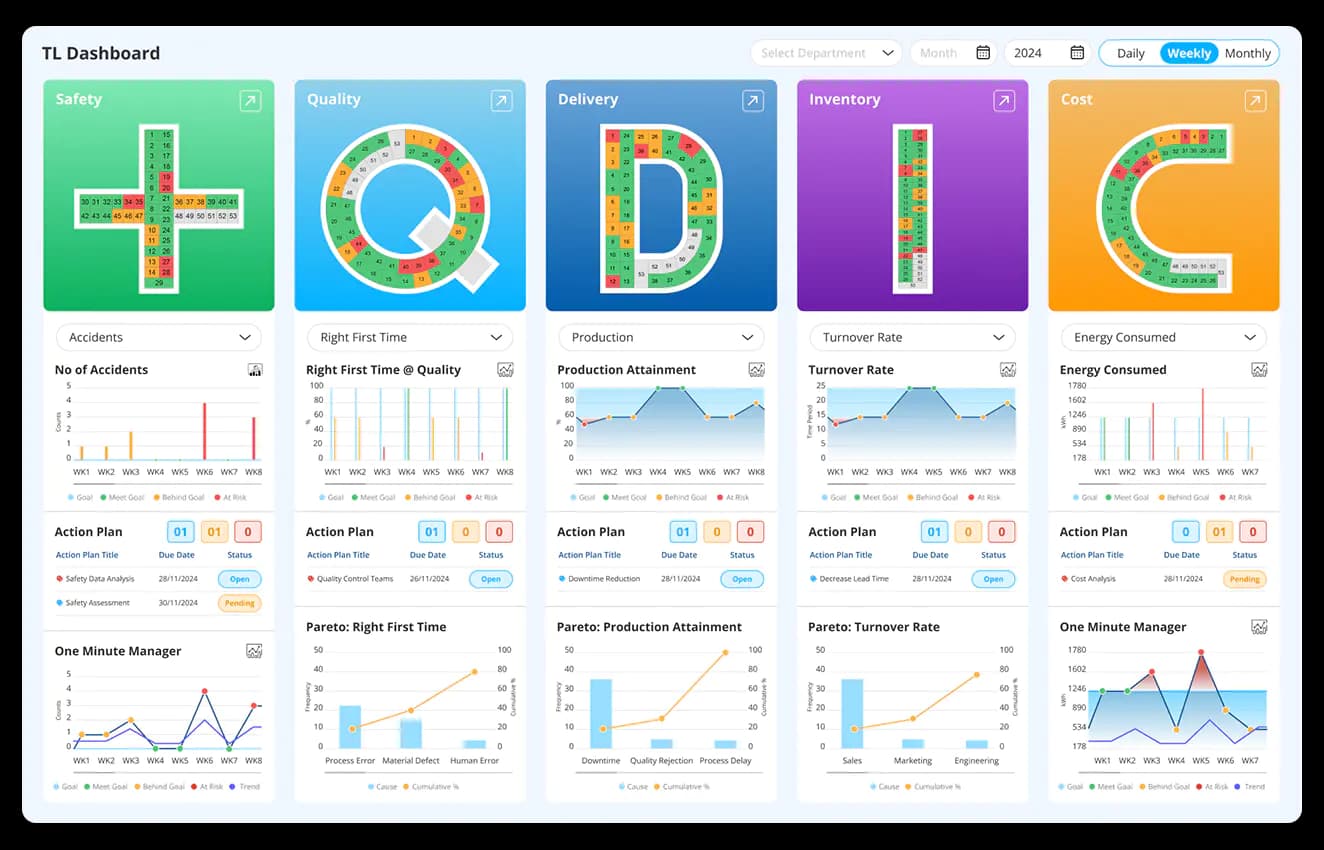
With Data Point’s Real-time performance tracking system, a food manufacturer turned scattered production data into actionable insights.

Customer Overview
- Industry: Food and Beverage Manufacturing
- Location: United States
- Specialisation: Supplying high-quality food products and beverages nationwide.
A mid-sized US-based food and beverage manufacturer with a strong presence across the country is committed to delivering consistent quality and maintaining timely production schedules. Known for its focus on efficiency and customer satisfaction, the company continuously invests in process improvements and advanced technologies to minimise downtime and meet growing market demand.
Executive summary
Downtime is a critical challenge for manufacturers in the food and beverage industry, often leading to lowered operational efficiency, production delays and increased costs.
In this case, let’s discuss how the mid-sized food and beverage manufacturing company uses Data Point’s KPI dashboards to address downtime efficiently. The company partnered with LTS to improve the efficiency of machine production and to reduce downtime. The advanced KPI dashboards of Data Point Balanced Scorecard helped the company to tackle the challenges effectively through real-time monitoring, root cause analysis techniques, and optimal interventions. Within six months, the company achieved a 25% reduction in downtime and gained the ability to meet customer expectations.
Challenges faced
Before implementing Data Point, the company relied on manual tracking systems, spreadsheets, and siloed data sources, which led to several operational inefficiencies. Manually tracking Key Performance Indicators (KPIs) was very tedious and tended to involve a lot of errors, leading to the company not being able to make proper fast decisions on the basis of data collected. Therefore, the level of unplanned downtime began rising, and production schedules and maintenance teams had difficulty prioritising activities.
The production team struggled with:
- Frequent equipment failures
Old equipment kept on developing breakdowns, hence disrupting the production line.
- Manual monitoring systems
Made it difficult to measure organisational performance effectively.
- Inefficient communication
It was difficult as teams did not have a common platform to share real-time updates, hence downtime took longer periods to be solved.
Objectives
The company’s primary objectives for the implementation of Data Point were to:
- Streamline KPI management
Move from manual tracking to an automated, centralised system with advanced KPI dashboards. - Reduce equipment downtime
Proactively identify and address potential issues before they lead to unplanned downtime. - Optimise maintenance strategies
Shift from reactive to preventive maintenance strategies.
After integrating Data Point, the company immediately leveraged Data Point’s advanced analytics to dig deeper into production data to reveal root causes. These root cause analysis techniques of Data Point include:
- Fishbone diagrams
Mapping probable delay sources in terms of equipment, processes or people. - Pareto analysis
Determining the specific reasons for frequent outages, including operator errors and worn-out parts. - 5 Why's methodology
Going deeper into routine problems to identify originating factors, like poor maintenance schedules or inadequate quality control.
Implementation details
As the root cause analysis feature of Data Point acted as the bedrock of the entire implementation, the Food and Beverage manufacturers began by diving deep into their operations. Let’s explore how the company addresses the issues it faces with Data Point’s advanced features.
- Initial assessment and goal setting
Clear goals are established to address downtime with a comprehensive assessment of existing systems. - Integration with existing systems
Integrated with existing MES, ERP and maintenance management software to ensure a unified view of all operational data. - Designing tailored KPI dashboards
Customised dashboards were designed to address the company’s unique challenges. - Empowering team through training
Provide training for teams to navigate dashboards, interpret KPIs, and act on insights.
How did Data Point transform downtime into uptime?
Yes, the company became a trailblazer with Data Point’s customisable, automatic and advanced KPI dashboards in Food and Beverage Industry. This food and beverage manufacturer’s transformation from battling persistent downtime and quality inconsistencies to becoming a model of operational excellence is remarkable. Let’s look at how.
- Real-time dashboards tracked equipment performance and triggered automatic alerts for anomalies, enabling immediate action.
- Customisable dashboards tracked and monitored critical KPIs such as OEE, throughput, pressure, temperature, and ingredient ratios, ensuring compliance with standards.
- Predictive analytics on dashboards identified wear patterns and scheduled maintenance during non-peak hours.
- Automated dashboards tracked compliance metrics, generated audit-ready reports, and ensured adherence to food safety standards.
- Centralised dashboards provide real-time-shared visibility into KPIs.
Results and achievements
Here’s where things get exciting. This food and beverage manufacturer was not only able to minimise downtime after adopting Data Point, but they also totally revolutionised their production game. Just picture this a little – transitioning from a situation where there are constant bottlenecks and delays to one where everything just flows smoothly and efficiently. That’s exactly what happened.
They saw:
 Reduced downtime
Thanks to predictive maintenance and real-time monitoring. The unplanned downtime was reduced to 35%. The team scheduled maintenance before problems snowballed.
-
 Faster production cycles
Increased throughput keeps shelves stocked and customers happy. Made adjustments exactly where needed with the advanced analytics and gained a competitive edge during peak seasons.
 Enhanced equipment performance
A well-oiled machine isn’t just a metaphor, it’s what the company achieved with Data Point. Reduced unexpected breakdowns with optimised machine usage and scheduled proactive maintenance.
-
 Enhanced decision-making
Minimised operational costs and increased profitability as the leaders had all the metrics they needed at their fingertips.
-
 Streamlined workflows
Got centralised performance insights and automated reports. Employees gained more time for innovation as they could spend less time troubleshooting.
Metrics for evaluating downtime
- Overall Equipment Effectiveness (OEE)
Enhanced from 65% to 80%. - Downtime hours
Reduced from an average of 50 hours per month to 37.5 hours. - Mean Time Between Failures (MTBF)
Improved by 40% - Production yield
Increased by 15%, reflecting better equipment reliability.
Lessons learned
This case study is a good example of how integrating real-time data and advanced KPI dashboard can help to overcome manufacturing issues. Through implementing the advanced KPI dashboards powered by Data Point Balanced Scorecard, the Food & Beverage Manufacturer company from Europe not only minimised the downtime but also created an environment for performance enhancement. Similarly, other manufacturers can achieve this by prioritising data-driven decision-making by investing in Data Point Balanced Scorecard to increase operational transparency.
Ready to eliminate downtime?
Don't let delays slow you down. Data Point is here to help. Whatever your industry, our customisable solutions are designed to optimise operations, improve product quality, and reduce downtime. Contact us now to see how Data Point can help you achieve operational excellence.