Track, Resolve, and Prevent Issues with Corrective and Preventive Action (CAPA) Software
Streamline lean corrective and preventive actions with seamless KPI integration for continuous performance improvement. Data Point helps identify and eliminate on-conformities (NC CAPA) and other operational inefficiencies within an organisation.
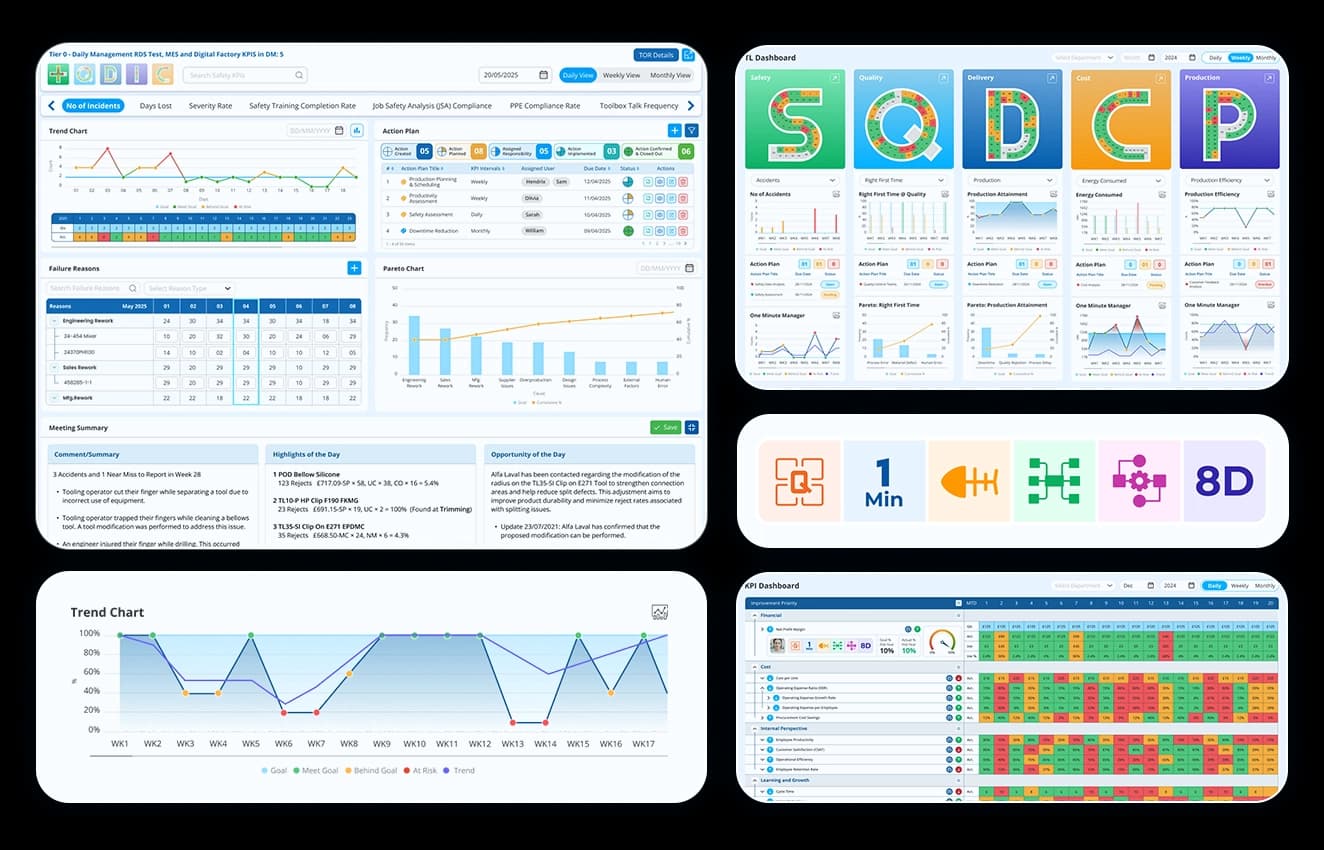
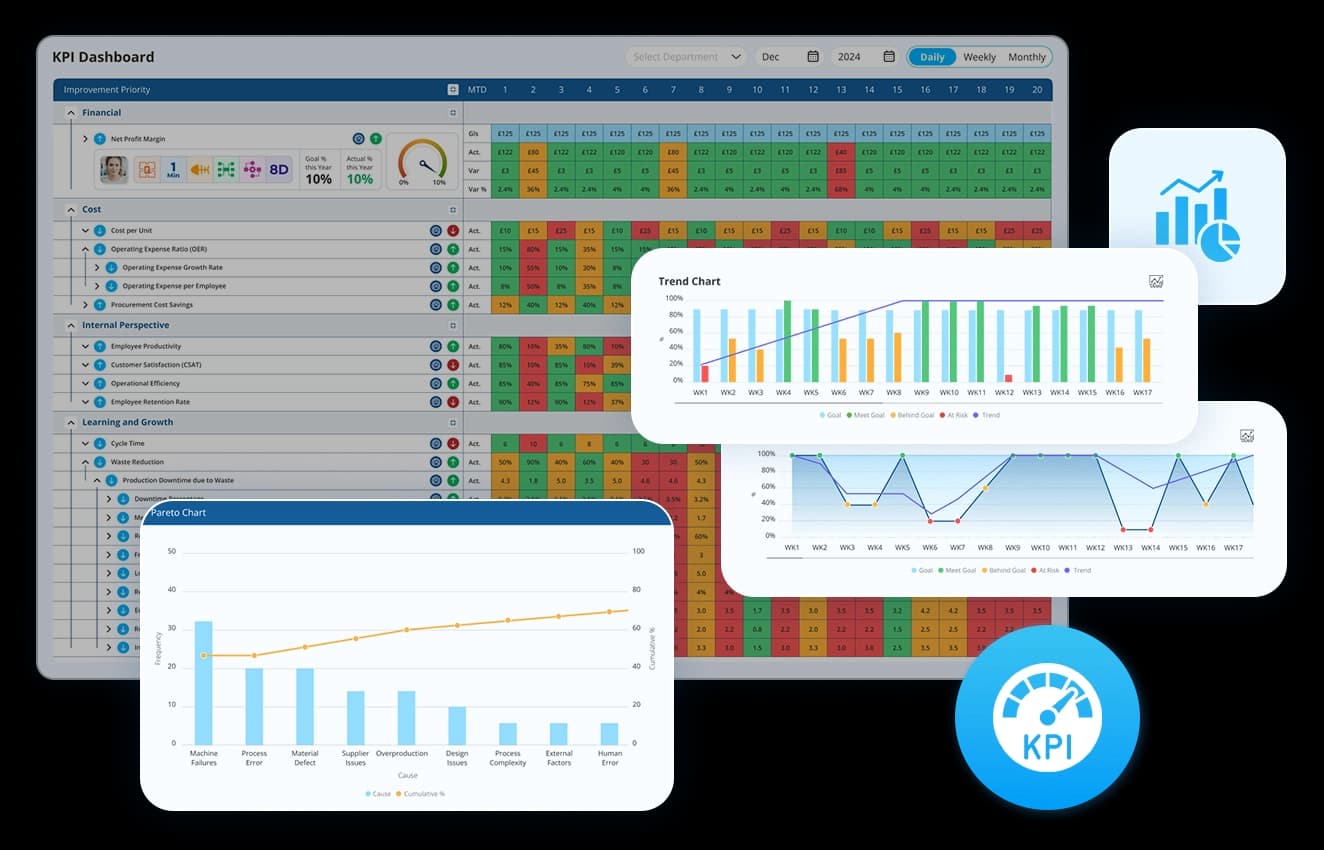
Proactive Problem-Solving with CAPA dashboard
Quickly spot performance gaps and non-conformities before they escalate.
- KPI trend graphs for real-time deviation tracking.
- Quad Charts for graphical and textual summaries.
- Actual vs target visualisations for quick comparisons.
- Colour-coded scorecards and huddle boards for instant problem identification.
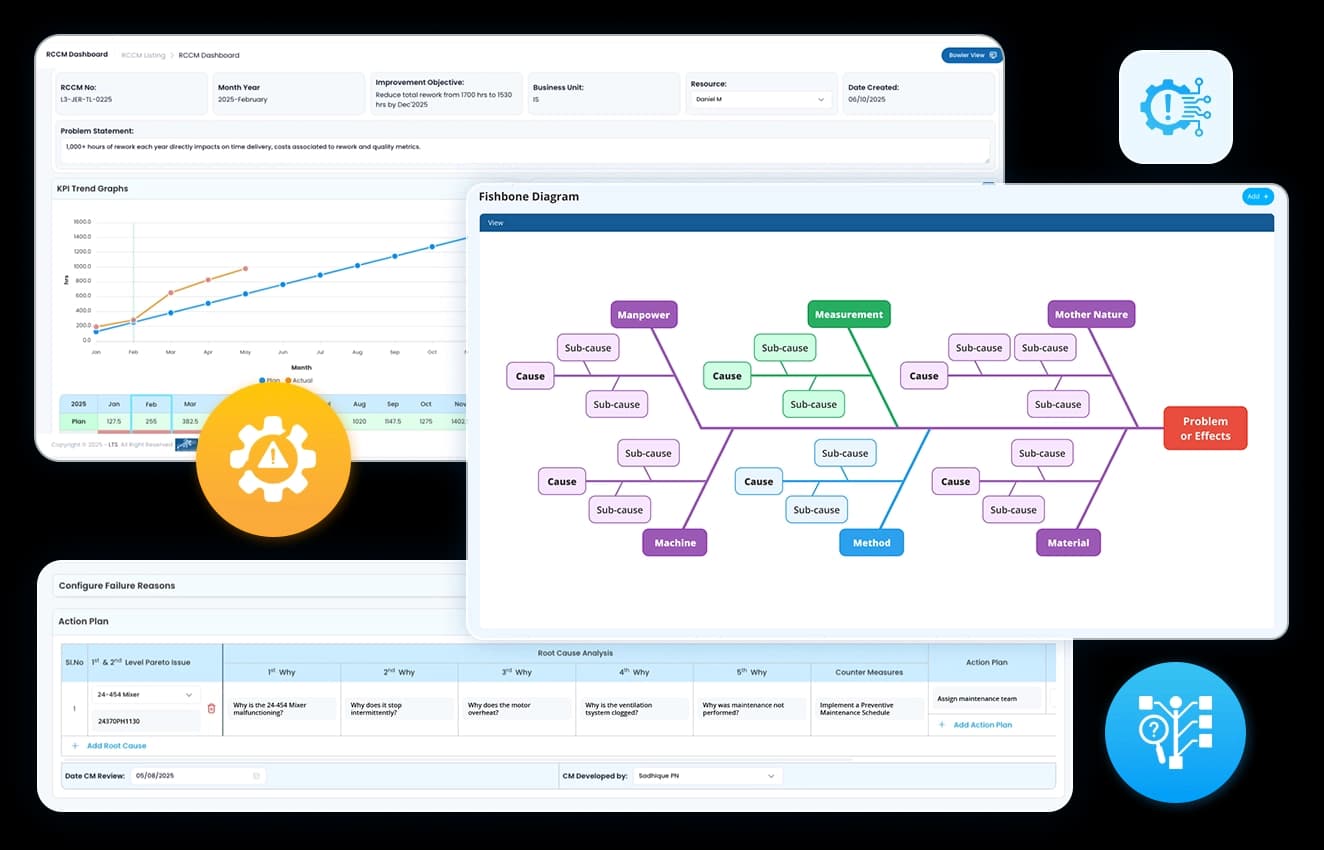
Dig deeper into the underlying cause of KPI failures to avoid repeated issues.
- Interactive Fishbone (Ishikawa) diagrams to map out possible root causes.
- Pareto analysis to highlight the most frequent failure reasons.
- One-click drill-down into failure trends for reference and trend analysis.
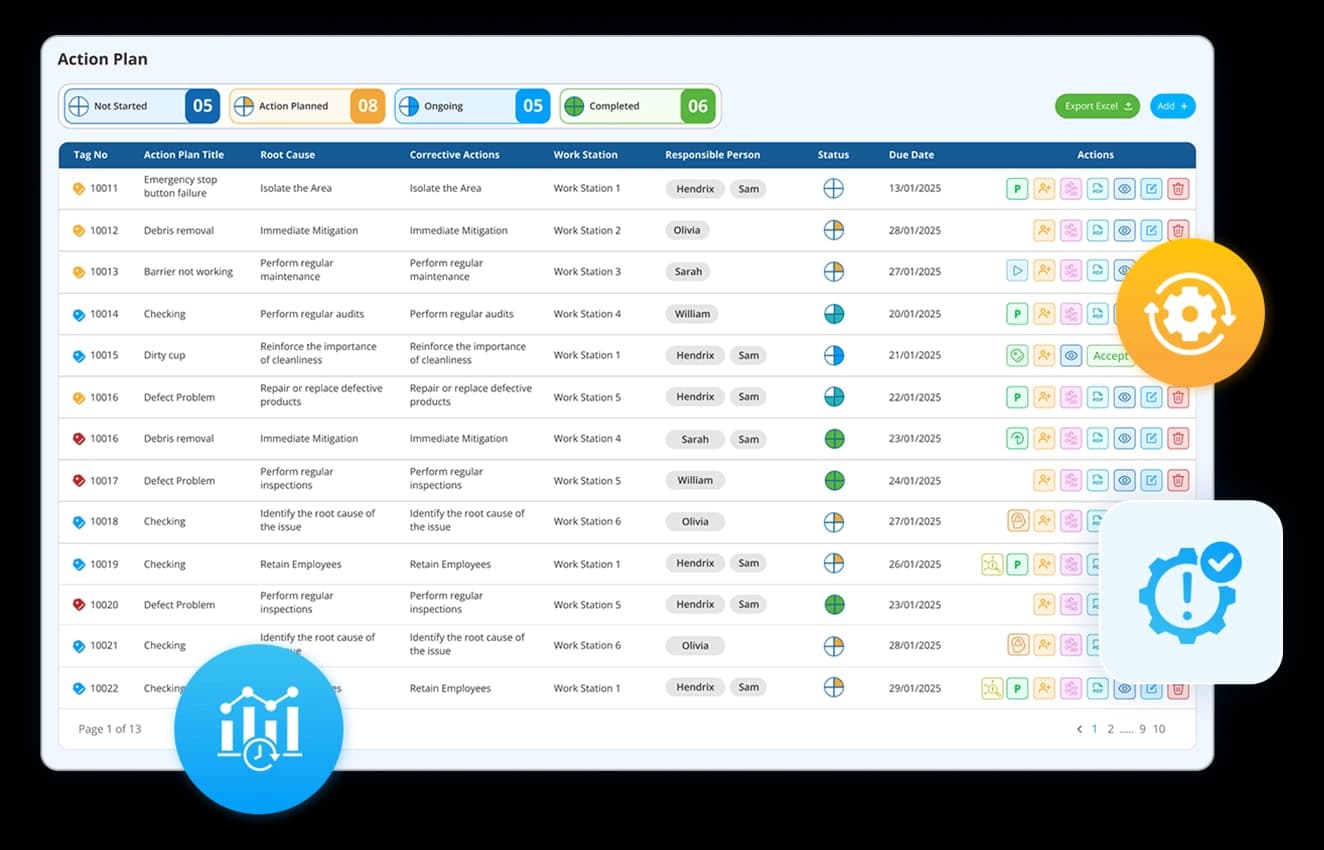
Take targeted action to resolve the issue and ensure KPI recovery.
- Dedicated corrective action log to document and track resolutions.
- Action plan creation with assigned owners, deadlines, and status updates.
- Automated follow-ups to ensure timely execution of corrective actions.
Eliminate future risks by applying structured preventive measures.
- Lessons learned documentation to prevent similar issues.
- Preventive action planning with assigned responsibilities.
- CAPA review meetings to evaluate improvement opportunities.
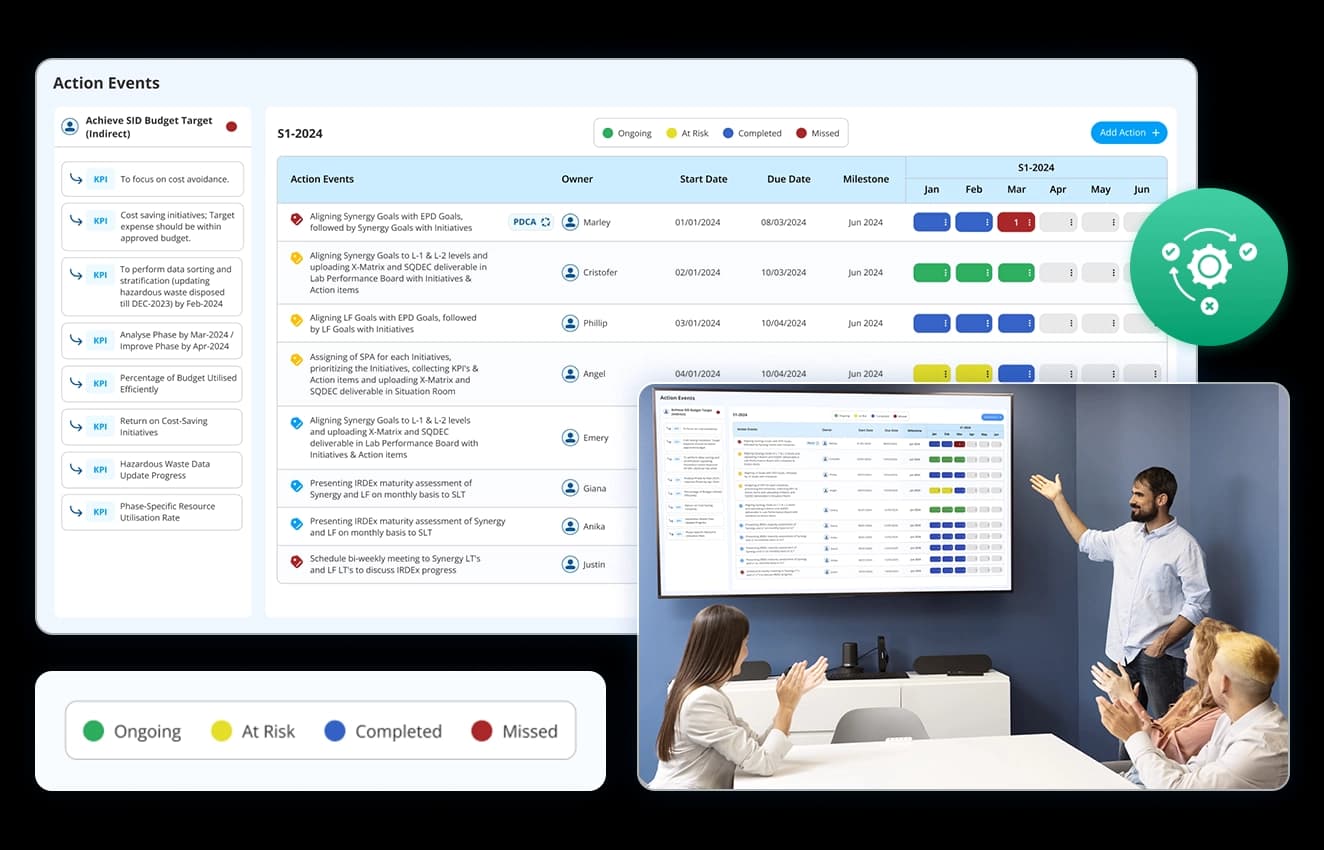
Evaluate the impact of corrective and preventive actions with real-time insights.
- Live KPI dashboards for real-time progress tracking.
- Automated performance reports to assess effectiveness.
- Continuous monitoring with custom alerts for deviations.
Turn issues into opportunities with Data Point's CAPA Dashboard
A structured CAPA template ensures every corrective and preventive action is well-documented and executed for sustained performance improvement.
Here is an example for CAPA in a manufacturing setup:
- Issue identified: Increased defect rate in production.
- Root Cause Analysis (RCA): Machine calibration errors detected via Fishbone Diagram.
- Corrective action: Recalibrated machines and provided operator training.
- Preventive action: Implemented scheduled maintenance and automated alerts.
- Monitoring & review: KPI dashboards track defect reduction trends.

Choice of industry leaders and Fortune 500 companies


How does Data Point streamline CAPA for KPI excellence?
With automated workflows, real-time tracking, and real-time insights, Data Point simplifies the CAPA process— turning challenges into data-driven decisions.

Faster root cause identification
Uncover the real issues behind KPI deviations with powerful analytics.

Automated action tracking
Assign, monitor, and evaluate CAPA tasks in a single platform.

Preventative strategies for long-term success
Reduce risks and ensure consistent KPI performance.
Stop recurring issues before they impact performance—take a proactive approach with Data Point's CAPA system.
CAPA Software: The Complete Guide to Corrective and Preventive Action Management
Learn how CAPA software helps teams identify deviations, manage corrective and preventive actions, analyse root causes, monitor KPI performance, improve accountability, and prevent recurring issues across operations.
What is the difference between a corrective action and a preventive action, and why do most CAPA processes get this wrong?
Corrective and preventive actions are not the same thing at different stages of non-conformance or KPI deviation and eliminates it. A preventive action addresses what could happen. It looks beyond the current instance and asks where the same failure mode could develop before it produces another deviation. Most CAPA processes treat preventive action as a formality at the end of the corrective process. A box gets ticked. A vague measure gets documented. The underlying conditions that allowed the failure are never systematically addressed.
The practical result is a CAPA log full of closed actions that keep reopening. The same failure modes recur because the corrective action resolved the instance and the preventive action was never taken seriously. Keeping the two stages distinct, with separate ownership, separate verification criteria, and separate KPI monitoring, is what turns a CAPA process from a compliance exercise into something that actually stops problems from repeating.
How does a structured CAPA process support deviation management across multiple sites?
Managing deviations across multiple sites using disconnected systems creates a specific problem: the same failure mode can develop independently at different locations with no visibility between them. Site A investigates and resolves a quality issue. Site B encounters the same issue three months later and starts the investigation from scratch. The knowledge generated at Site A never reaches Site B because the CAPA records are not connected.
A centralised CAPA system changes that dynamic. Deviation management workflows running through the same platform mean:
- A corrective action confirmed at one site is visible and referenceable across the organisation
- Preventive actions triggered by a finding at one location can be applied proactively at others
- Leadership gets a consolidated view of open deviations across all sites without chasing individual reports
For global manufacturing organisations evaluating platform options, cross-site CAPA visibility is one of the most frequently cited requirements. Resolving deviations locally while losing the learning organisationally is a cost that rarely gets quantified but consistently limits improvement.
How does Pareto analysis in the root cause stage improve the quality of corrective actions?
Most CAPA investigations identify multiple possible causes. The corrective action that follows is only as good as the prioritisation that precedes it. Addressing a low-frequency cause while leaving the dominant one in place produces a corrective action that looks complete on paper and does very little in practice.
Pareto analysis applied to failure reason data in the root cause stage ranks causes by frequency and impact before any corrective action is defined. Used alongside the Fishbone Diagram, the two tools serve different purposes: the fishbone maps the full causal landscape, and the Pareto identifies where within that landscape to direct the corrective effort first. The result is a corrective action targeted at the cause that accounts for the majority of the problem's impact, not the cause that was easiest to identify or most recently discussed.
How does a CAPA review meeting differ from a standard management review, and what should it cover?
A standard management review covers performance across the board. A CAPA review meeting has a narrower and more specific purpose: it evaluates whether the corrective and preventive actions that were implemented are actually working, and whether any open actions are at risk of missing their deadlines.
The distinction matters because mixing CAPA review into a general management meeting means it rarely gets the attention it needs. Open actions get a status update. Overdue items get noted. Nothing gets escalated or re-examined because there is not enough time in the agenda.
A dedicated CAPA review covers three things:
- Whether corrective actions have moved the KPIs they were designed to affect
- Whether preventive actions are in place and verified, not just documented
- Whether any patterns across multiple CAPAs point to a systemic issue that individual actions are not resolving
That last point is where most management reviews fall short. Individual CAPAs get reviewed in isolation. The pattern across them is never examined. A CAPA review meeting structured around the full log, not just the most recent entries, is what makes that pattern visible.
How does real-time KPI deviation detection change the speed of a CAPA response?
The speed of a CAPA response is determined by how quickly the triggering event is identified. In most organisations, that identification happens after the fact. A KPI report is reviewed in a weekly meeting. A non-conformance is flagged at end of shift. By the time the CAPA process starts, the deviation has already had time to compound.
Real-time KPI deviation detection changes that starting point:
- KPI trend graphs surface performance gaps as they develop, not after they have settled into a pattern
- Colour-coded huddle board views make deviations visible to the right people immediately
Actual versus target visualisations and Quad Chart summaries give teams the context to assess severity before the investigation even begins
The earlier the trigger, the shorter the window in which a deviation can cause downstream damage. A CAPA process that starts on day one of a deviation looks very different from one that starts on day seven.
How does the corrective action log create accountability without creating bureaucracy?
The tension in most CAPA systems is between documentation and speed. A process heavy enough to satisfy an audit is often too slow to be useful in daily operations. Teams start taking shortcuts. Actions get logged after the fact. Deadlines are set retrospectively. The log becomes a record of what happened, not a tool for managing what is happening.
A corrective action log that creates genuine accountability does three things without adding administrative overhead:
- Assigns ownership at the individual level, not the team level, so there is no ambiguity about who is responsible
- Sets deadlines that are tracked automatically, with follow-ups triggered when actions are overdue rather than relying on manual chasing
- Links each action to the specific root cause it was designed to address, so the connection between investigation and resolution is always traceable
The difference between a log that drives accountability and one that just records it is whether the system does the follow-up work or whether a person has to.
How does monitoring KPIs after a corrective action confirm that the action has actually worked?
Closing a CAPA does not mean the problem is resolved. It means the actions have been completed. Those are different things. A corrective action can be executed correctly and still fail to move the KPI it was designed to affect, which means either the root cause identification was wrong or the action did not fully address it.
Monitoring the relevant KPI after a corrective action is implemented is what distinguishes a verified resolution from a closed record. Live KPI dashboards with custom deviation alerts mean the performance impact of a corrective action is tracked in real time rather than reviewed in the next monthly report. If the KPI does not recover as expected, the alert fires before the deviation compounds, and the investigation can be reopened while the context is still fresh. A CAPA that cannot be verified against performance data is not closed. It is deferred.
How does a CAPA system connect to broader continuous improvement activity, and why does that connection matter?
A CAPA system that operates in isolation from the broader improvement programme creates a structural gap. Problems get investigated and resolved reactively, but the findings never feed into the proactive improvement activity happening in parallel. Kaizen events, value stream mapping exercises, and continuous improvement plans are built without the data that CAPA investigations have already generated.
The connection matters because reactive and proactive improvement should reinforce each other. A pattern of recurring deviations identified across multiple CAPA records is exactly the kind of systemic issue that a kaizen event or a process redesign should address. Without that connection, the improvement programme works from assumptions about where waste and failure live, while the CAPA log contains the evidence. Keeping both within the same platform means the data generated by problem resolution is available to the teams planning improvement activity, rather than sitting in a separate compliance system that the operations team never accesses.
Hear it from our customers

MARC ROBINSON
Director, Global Operational Excellence

“By providing a central location to input, analyse and share our KPIs, 'Data Point' enables site management to more easily focus on the entire business as a team. Its ability to allow automated data entry and trend analysis gives us more time for improvement rather than just reporting numbers. Combined with a disciplined approach within our SQDC meeting process, I believe 'Data Point' will help us continually focus on key issues and drive business excellence in all areas.”
Transform Issues into Improvement Opportunities with Data Point's CAPA Dashboard
Get a personalised demo of Data Point’s CAPA Dashboard and see how structured root cause analysis, corrective actions, and preventive strategies can elevate your team’s performance and accountability.
