Beyond dashboards: How LTS Data Point supercharges Power BI limitations for real-time Lean management
Power BI isn't always enough on its own. Discover how Data Point overcomes Power BI’s limitations with real-time tracking, built-in Lean tools, daily management boards, and actionable workflows — making it a powerful alternative or the perfect complementary solution.
Contents
- Power BI: Powerful, but not the whole picture
- Typical challenges teams face with Power BI alone:
- What Power BI and LTS Data Point delivers- A quick overview
- Does LTS Data Point come ready with the tools I need? Here’s what’s built in
- What are the main limitations of Power BI?
- Can an be used to overcome Power BI limitations?
- Power BI vs. LTS Data Point Balanced Scorecard: A practical comparison — and how Data Point solves the gaps
- Is Data Point more than a dashboard? Here’s how it works daily
- If Power BI alone make limitations, what about integrating Power BI and Data Point?
- Keep Power BI — Supercharge it with Data Point
- How it works: Power BI + Data Point in one connected loop
- Know more about LTS Data Point ; the Power BI alternative or co-partner
- Enterprise features Data Point provides on demand
- Bring your Power BI to life with Data Point
Last updated on : July 9, 2026

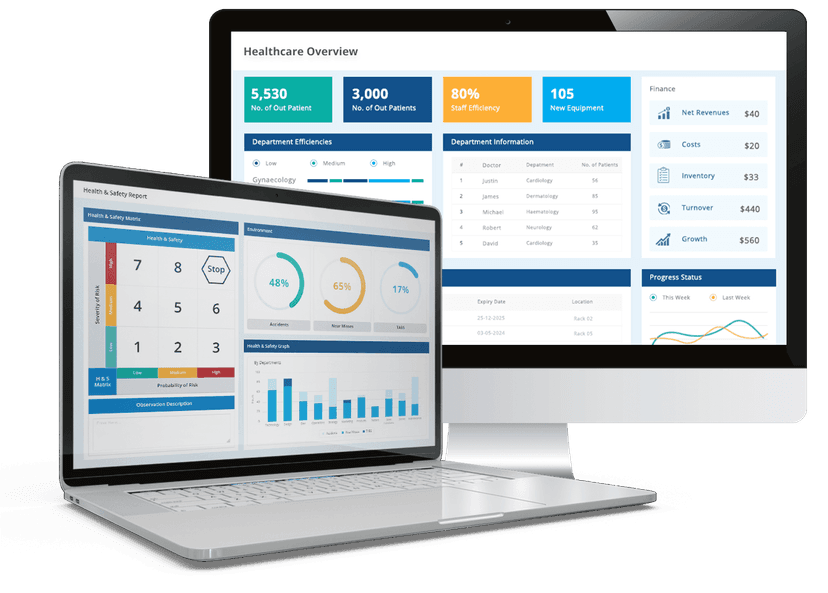
Power BI is an exceptional tool for executive dashboards — but it can’t run your daily operations or solve problems on its own. That’s where LTS Data Point- the digital Balanced Scorecard software steps in.
Beyond visual management, data analysis and report-making, Data Point connects live performance, daily huddles, problem-solving frameworks and real-time action tracking — all in one place.
If you’re already using Power BI, combining it with Data Point- the more advanced version of Power BI tools takes your dashboards from static reports to a connected, daily improvement engine. And if you’re starting fresh, Data Point alone gives you a complete solution — from strategic planning to daily results — without gaps.
Power BI: Powerful, but not the whole picture
What is Power BI? - Power BI, a business analytics service by Microsoft, is a complete reporting solution that offers data preparation, data visualisation, distribution, and management through development tools and an online platform. It aids the users to convert data into interactive dashboards and visual reports.
Power BI is trusted by thousands of businesses worldwide — for good reason:
- It pulls together data from multiple systems
- It creates powerful visual dashboards and custom reports
- It helps senior leaders spot trends and make high-level decisions
Yes, Power BI wasn’t built to manage daily operational control. It can show you what’s happening, but not why it’s happening, who’s fixing it, or whether the actions are on track.
Looking for a tool built for operations, not just reports? See what LTS Data Point have
Typical challenges teams face with Power BI alone:
- Information is often delayed or needs manual updates.
- Root cause analysis happens elsewhere — in spreadsheets, emails or meetings.
- Action plans get buried in separate tools.
- Daily team meetings still rely on whiteboards or disconnected slides.
- Accountability and follow-up are hard to track.
What Power BI and LTS Data Point delivers- A quick overview
Legend:
- YES — Fully covered
- LIMITED — Possible but manual/partial
- NO — Not provided
- BUILT-IN – Delivered inside with ready workflows and tools
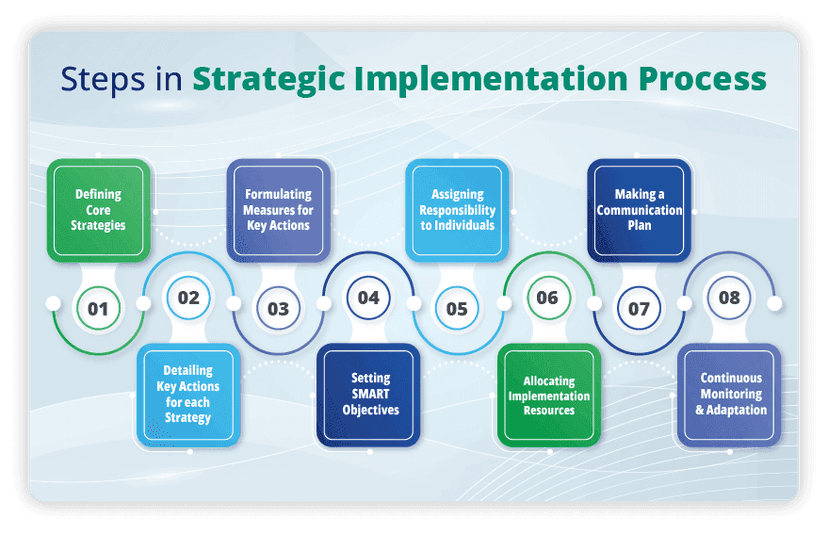
Does LTS Data Point come ready with the tools I need? Here’s what’s built in
Power BI is a powerful blank canvas — it gives you the flexibility to design custom dashboards and reports the way you want them. But with that freedom comes a cost: you have to build the structure, workflows, and tools yourself, often stitching together spreadsheets, add-ons, and manual processes.
Think you need to build your own boards in Data Point? “NO!”. Data Point does the heavy lifting for you. It comes with built-in, proven Lean management frameworks. No need to reinvent the wheel.
BUILT-IN really means:
- The tool is there by default, no separate integration needed, you don’t need to build it from the scratch.
- It works out-of-the-box, so your team can start using it immediately.
- You can adapt it, so it fits your exact Lean, Six Sigma, or strategy approach.
Because every company’s way of working is different Data Point’s frameworks are also customisable:
- You can configure what your huddle boards like SQDCP/ SQDIP show — add or remove metrics.
- You can adjust Fishbone Diagrams, 8D forms, Quad Charts — to fit your own problem-solving process.
- You can customise action plan statuses, categories, owners, deadlines.
- You can design tiered huddle boards for different teams or levels.
- You can tailor Balanced Scorecard framework structure, strategy maps, and KPI tracking.
What are the main limitations of Power BI?
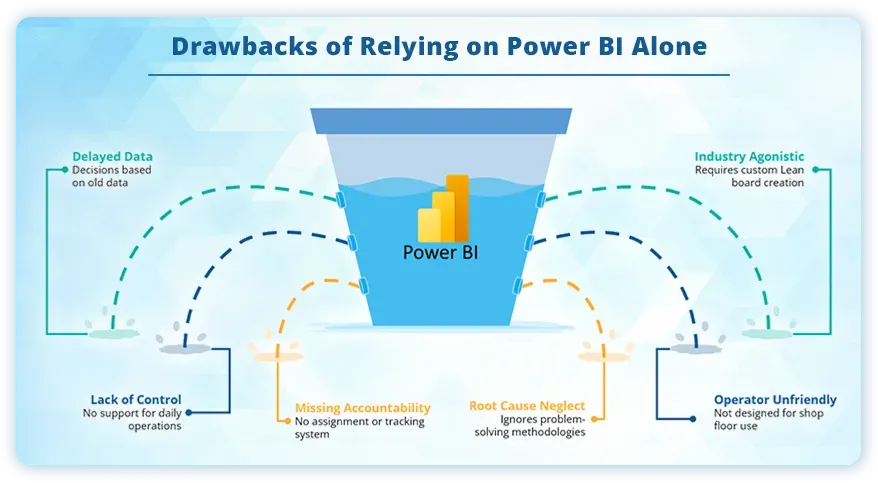
Does Power BI have any limitations? Even though Power BI is a versatile tool for analysis and visualisation, it has many limitations. As we’ve already discussed in the context of power bi vs digital balanced scorecard, some of the challenges and gaps prevent it from delivering a complete, connected view of your business. Here are the real limitations of Power BI that often hold teams back from turning insights into real, daily improvements
1. Struggles with large data sets and heavy reports
Power BI can face performance drops when working with huge data volumes or multiple layered dashboards. Reports can take longer to load or update, which slows down decision-making.
2. Confusing versions, licences and setup options
Power BI isn’t just one product — it comes in versions like Pro, Premium and Embedded, with other components each with different features, user caps and prices. This makes it harder for teams to pick the right one, plan budgets, and set up permissions. Hence, the users need to spend more energy and time to set up and figure out the function. Also, the multi-tiered licensing system makes it more complex.
3. Limited integration outside the Microsoft Ecosystem
Power BI works best inside Microsoft’s world (Excel, Azure, SharePoint). Bringing in data from non-Microsoft apps or older legacy systems can need extra connectors or technical work.
4. Restricted data sharing for external or wider teams
Sharing dashboards outside your core team — with partners, customers or wider audiences — often means buying extra licences or hitting sharing limits, which can block smooth collaboration.
5. Data refresh limited by plan and source
Your dashboards don’t always update live. How often they refresh depends on the licence and data source. Basic plans allow only a few scheduled refreshes a day — which means you might not see today’s numbers in real time.
Still struggling with Power BI gaps? See how Data Point has endless solutions
Let Data Point turn your plans into measurable daily actions.6. Custom reports can still have design limits
Another major Power Bi limitation is that, even though it has many charts, creating a deeply customised layout or unusual interactive report often needs workarounds, coding or third-party visuals.
7. Learning curve for DAX and advanced features
Using Power BI for simple charts is easy. But building more advanced models, custom calculations or dashboards needs DAX language skills and experience — which means extra training time for your team.
8. Mobile and tablet usability isn’t perfect
Power BI offers mobile apps, but not every report adjusts neatly to small screens. Some visuals get tricky to navigate on mobiles or tablets — which limits how teams check live data on the shop floor or on the move.
Can an Operational Excellence software be used to overcome Power BI limitations?
Yes, an operational excellence software like LTS Data Point digital balanced scorecard (BSC), especially in the form of advanced software like Data Point, can address several challenges inherent to Power BI limitations. Here's how:
Power BI vs. LTS Data Point Balanced Scorecard: A practical comparison — and how Data Point solves the gaps
Power BI shows the story — Data Point helps you change it. Step into real-time operations with Data Point
Is Data Point more than a dashboard? Here’s how it works daily
For many organisations, visualising results is only part of the story, the limitation of Power BI starts here. True improvement happens when teams can see why results look the way they do, agree on what to fix, and track actions until problems are solved — all in real time, right where work happens.
This is where Data Point, your digital Balanced Scorecard and Lean performance platform, bridges the gap.
Data Point is designed to handle what Power BI can’t:
- Live connectivity:
It connects to your existing systems (Maintenance, Quality, Engineering, Projects) and streams real-time KPIs into easy-to-read visual boards.
- Daily operational boards
Whether it’s SQDCP boards, custom Balanced Scorecards, Gemba boards or team-specific displays, Data Point makes daily performance visible and actionable.
- Tracks daily tasks & problems
Beyond showing performance, Data Point breaks it down — recording each issue, assigning clear owners, deadlines, and corrective actions. Teams always know what’s open, what’s next, and who’s responsible.
- Built-in lean tools:
From Hoshin Karni X matrix, Fishbone Diagrams, CAPA (Corrective and preventive action plan) to Lean daily management, Process flows and VSM , and Quad Charts — teams don’t just see problems, they can tackle them directly in the platform.
- Engages frontline teams:
Data Point isn’t just for managers — it’s designed for daily operator huddles, shift handovers, and team stand-ups. Everyone, from the shop floor to supervisors, uses the same live information to stay focused on what matters now.
- Action plans with accountability:
Data Point keeps every action plan alive — you can see the status (Not Started, Planned, Ongoing, Completed), owners, deadlines, and progress — without switching between systems.
- Daily huddles and engagement:
Designed for daily stand-ups, tiered meetings and continuous improvement culture — not just reporting but doing.
- Keeps everyone aligned:
Because Data Point ties real-time data to daily actions and goals, everyone is working towards the same targets — from operators on the shop floor to executives viewing dashboards in Power BI. No duplication. No lost actions. No guesswork.
See why leaders choose Data Point over generic BI tools
If Power BI alone make limitations, what about integrating Power BI and Data Point?
All the gaps above don’t mean you need to replace Power BI — you just need the right partner to make it work harder for your daily operations. Because you may already invest in Power BI but later comes up with the Power BI limitations.
No worries, keep it! Data Point can overcome its limitations so you can manage your daily operations, solve problems on the spot and feed fresh, trustworthy KPIs straight back to your Power BI dashboards.
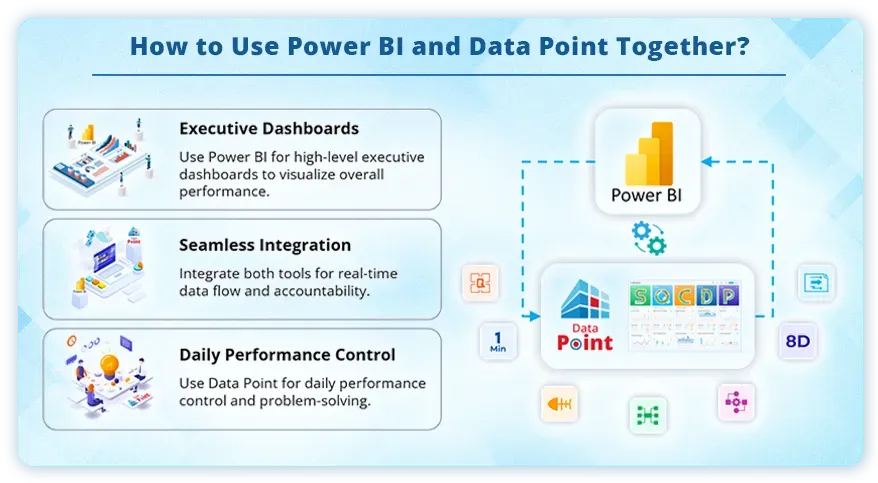
Keep Power BI — Supercharge it with Data Point
Yes — Power BI can absolutely be integrated into Data Point’s live, interactive boards.
Here’s how it works in practice:
- Keep Power BI to stay as your big-picture executive dashboard.
- Use Data Point to handle the live daily performance boards, SQDCPs, huddle boards, root cause tools, problem solving tools and action tracking.
- Data Point can embed Power BI visuals inside its boards — so teams see big-picture KPIs alongside their daily live updates, tasks and status in one place.
- Run structured problem-solving on the spot with Fishbone Diagrams, 8D, Quad Charts — all built into Data Point and fully linked to actions and tasks. No need to build this from scratch in Power BI.
Or the other way around: Bring Power BI visuals straight into your Data Point boards — or push Data Point’s live data back up to Power BI. Data Point’s real-time KPIs and actions can feed back into Power BI, keeping your executive dashboards up to date with trusted frontline data.
The result?
One loop for action and accountability - Power BI shows what’s happening; Data Point drives what needs to be done about it. Together, they close the gap between insight and daily improvement.
No lost investment — only more ROI. Companies that combine Power BI and Data Point get the best of both: world-class analytics plus live operational control.
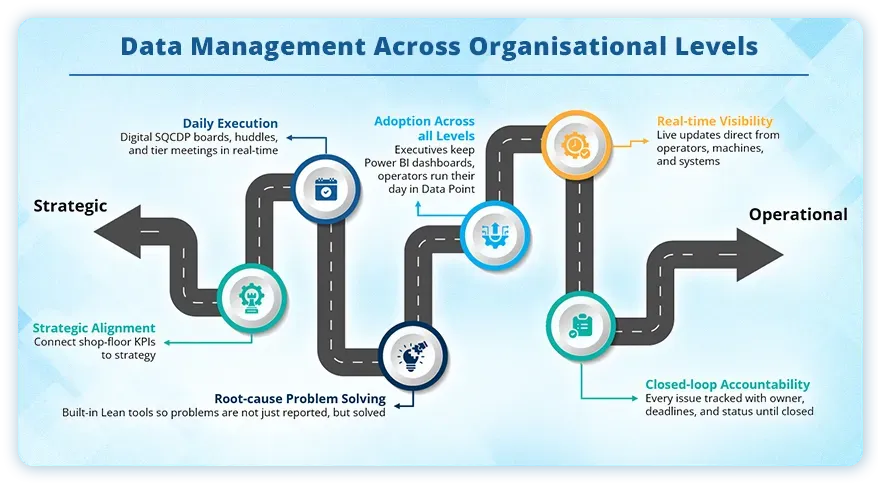
How it works: Power BI + Data Point in one connected loop
1. Data flows in
Live shopfloor data — production, quality, maintenance, KPIs — is captured automatically in Data Point.
2. Data Point runs daily ops
Teams use Data Point’s built-in boards and tools (SQDCP, Huddles, Action Tracking, Root Cause Analysis) to run meetings, solve problems, and update progress — in real time.
3. Insights feed Power BI
Verified, up-to-date data from Data Point flows straight into your Power BI dashboards — so leaders see the true performance picture, not old numbers.
4. Power BI visuals support strategy
Power BI brings the big-picture view — scorecards, trends, executive summaries — so top-level strategy stays connected to daily reality.
5. Teams stay in sync
Teams display key Power BI charts inside Data Point boards — so daily huddles and tier meetings stay focused on live targets and actual data, not static slides.
Know more about LTS Data Point Balanced Scorecard; the Power BI alternative or co-partner
Data Point Balanced Scorecard (BSC) is a tried and tested framework for organisational success. Digital Balanced Scorecard, the advanced version of traditional BSC aims to align business activities to the vision and strategy of the business, improve internal and external communications, and monitor business performance against strategic goals.
The Data Point Balanced Scorecard is ideal for:
- Companies across various industries, including manufacturing, healthcare, automotive, banking, electronics, aerospace, energy, FMCG, and retail
- Organisations of all sizes, from small businesses to large enterprises
- Businesses requiring advanced visualisation tools, strategic management process and detailed reporting
- Automating scheduling and risk identification
- Easy setup and quick learning for users
- Supporting enterprise-wide deployment
- Cross-platform data integration
Move from reactive tools to a proactive platform. We are here to help you
Enterprise features Data Point provides on demand
Apart from the solutions and features we’ve already covered; Data Point also provides on-demand capabilities tailored to your specific needs.
- X-Matrix for strategic planning & Tracking
- Project & Capex tracking
- Takt time tracking
- Production planning module
- Short interval control board
- Production line, area, cell, workstation & Shift configs
- Operator, supervisor & Quality data capture screens
Bring your Power BI to life with Data Point
Power BI is excellent at showing you where you stand — but making improvements stick needs more than charts and dashboards. Data Point picks up where Power BI stops. With built-in Lean tools, daily huddles, problem-solving boards and real-time tracking, you get a connected system that turns insights into action — every single day.
If you already use Power BI, keep it — and extend its value with Data Point. If you don’t, Data Point alone gives you a complete framework to align people, strategy and daily operations in one place.
Ready to see what LTS Data Point can do for your teams?
Get in touch with us today and take the next step toward true continuous improvement.

Geandra Queiroz, Operations Management Consultant
Geandra is an Operations Management Consultant at Lean Transition Solutions, specialising in Lean philosophy, Lean Six Sigma, and strategic planning across manufacturing and healthcare. She is currently completing her PhD in Industrial Engineering at the Federal University of São Carlos, researching the integration of Operations Strategy, Lean, and Green Manufacturing.