How to Measure KPIs: All you need to know
Last updated on : November 7, 2025
In today’s data-driven business landscape, measuring performance is no longer a choice, but a necessity. Key Performance Indicators (KPIs) serve as vital tools that help organisations monitor progress, evaluate success, and align operations with strategic goals. Whether you are managing a manufacturing process, keeping an eye on a team, or driving digital transformation, understanding how to define, track, and analyse KPIs can significantly increase decision-making and operational efficiency.
This blog explores the fundamentals of KPIs, their role in performance management, and how digital tools like balanced scorecards can elevate your measurement strategy.
What is a KPI?
A Key Performance Indicator (KPI) is a measurable value that displays how effectively an organisation, team, or process is attaining its strategic or operational objectives.
In simple terms, KPIs help track progress toward goals and recognise areas that need improvement.
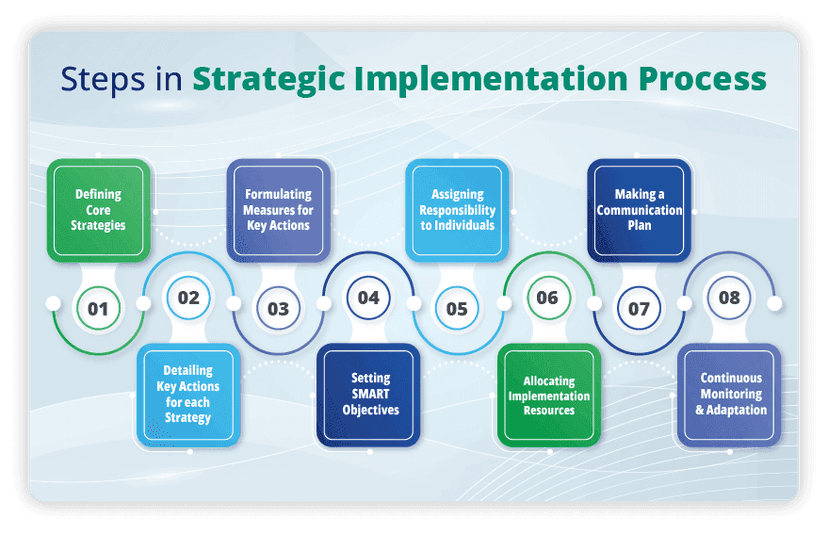
The right process of measuring KPIs for business success
To measure KPIs effectively, businesses must follow an organised approach that aligns performance indicators with strategic goals. This begins with clearly defining what success looks like, identifying critical success factors, and selecting KPIs that are both relevant and practical. A balanced mix of leading and lagging indicators ensures proactive and reflective insights. By keeping KPIs SMARTER—Specific, Measurable, Achievable, Relevant, Time-bound, Evaluated, and Readjusted—organisations can track meaningful progress, make informed decisions, and continuously refine their strategies for sustained success. Here are the processes of measuring KPIs in an effective way.
Differentiate your KPIs and metrics
It is important to differentiate between KPIs and regular metrics. KPIs directly links to strategic goals, while metrics offer supportive operational data. Clarity on definitions and differentiation makes it easier for businesses to focus on what truly matters.
How are KPIs different from other metrics?
There are plenty of data that can be measured in your business and measuring everything is simply not the answer. Measuring too much data may overwhelm you and hinder the growth of your business. To prevent this disaster, it is important to know the difference between KPIs and other metrics like Objectives and Key Results (OKRs).
So, what are the characteristic features that differentiates KPIs from other metrics? Let's discuss.
- KPIs are measurable values that directly reflect how well an organisation is doing, in terms of achieving its key business objectives. Data points on the other hand, provide general insights or may track activities that may or may not be related to strategic goals of the business.
- KPIs focus on measuring progress towards strategic objectives and critical success factors, while other metrics provide contextual or operational insights to support analysis and decisions.
- KPIs drive decision-making at the leadership or organisational level, while other metrics support performance monitoring but don’t directly indicate success or failure of the business strategy.
- KPIs are monitored and reported regularly (monthly, quarterly, or annually). Other metrics can be monitored as per the need of operational purposes.
To summarise, all KPIs are metrics, but not all metrics are KPIs.
KPIs emphasise what truly matters to achieve goals, while other metrics simply provide additional information.
Got the difference, but still confused how to choose the right KPIs? We got you.
Discover how LTS Digital Balanced Scorecard can measure KPIs
Categorise your KPIs
Categorising KPIs based on their function, focus area or performance level is a must for smooth functioning of your business. Some of the benefits of categorising KPIs are:
- Improves strategic alignment
- Clarifies priorities and focus areas
- Improves decision making
- Supports balanced performance measurements
- Enhances tracking and reporting
- Facilitates accountability
- Simplifies root cause analysis
- Enables cross-functional insights
- Supports continuous improvement cycle
- Makes digital dashboards more effective
If you must know how to categorise KPIs for your benefit, you must also know what the different types of KPIs are as well. Let's see the different kinds of KPIs, and what it is used for.
What are the different types of KPIs?
Before we run, we must learn to walk. It is necessary to learn about different kinds of KPIs before learning on how to choose the right KPI for your business goal. These kinds of KPIs have its own benefits and balancing them while choosing the right one is a must.
Some of the different types of KPIs are:
1. Strategic KPIs: Strategic KPIs focus on tracking progress toward long-term, organisation-wide goals. They show whether the overall strategy is working or not.
- Used by: Senior leadership or executives.
- Examples: Revenue growth rate, market share, Customer Satisfaction Index (CSI), Return on Investment (ROI), and employee engagement score.
2. Operational KPIs: Operational KPIs monitor daily or short-term performance in departments or processes. They focus on efficiency and implementation at operational level.
- Used by: Department heads or supervisors.
- Examples: Production volume per shift, customer support, on-time delivery, inventory turnover, and equipment downtime.
3. Leading KPIs: Leading KPIs predict future performance and recognise trends early. They behave like early warning signs, preventing issues from happening.
- Examples: number of sales lead generation, training hours per employee, preventive maintenance activities completion, and website conversion rate.
4. Lagging KPIs: Lagging KPIs measure outcomes after actions have occurred. They show what has already happened which is useful for evaluating success.
- Examples: quarterly sales revenue, customer retention rate, number of product defects, and profit margin.
How to choose the right KPI?
Choosing the right KPI for your business is of utmost importance – it guarantees that you are tracking what truly drives your organisation’s success rather than what's easy to measure.
Here's a step-by-step guide to select the right KPIs
1. Align with Strategic Goals: Always start from your organisational objectives, not on the data you have in your hands.
- Ask: “What are we trying to accomplish?”
- Example: If your goal is to improve customer retention, then the relevant KPI would be Customer Retention Rate or Net Promoter Score (NPS).
2. Identify Critical Success Factors (CSFs): Establish the key activities or conditions required to meet your goals.
- Example: For a manufacturing efficiency, CSFs might include equipment uptime and defect reduction.
3. Make it SMART: Every KPI should be SMART, or in fact, SMARTER.
- Specific: Clear and focused.
- Measurable: Measure with reliable data.
- Achievable: Realistic targets with tools to achieve them.
- Relevant: Tasks tied directly to your strategic goals.
- Time-bound: Should be tracked over a specific period.
- Evaluate: Easy to understand and review.
- Readjust: Able to readjust KPIs to fit your business goals in case of no progress.
4. Focus on Practical Indicators: Choose KPIs that direct decision-making and progress, not just observation.
- Example: Instead of monitoring total production hours, focus on monitoring units produced per labour hour. This helps in analysing productivity trends and areas for improvement.
5. Balance Leading and Lagging Indicators: A healthy KPI set balances both to direct proactive and reflective improvement.
- Leading KPIs predict future performance like number of training hours per employee.
- Lagging KPIs show results after actions such as employee turnover rate.
6. Keep it Few and Focused: Having too many KPIs to track per goal builds up clutter and dilute focus. The best KPIs provide clarity, not confusion.
The wise approach is to track only 3-7 KPIs per goal.
7. Review and Refine Frequently: As business conditions evolve, reassess your KPIs to ensure they still align with strategy and deliver practical insights.
In short, remember to “choose KPIs that measure what matters – not just what’s measurable.”
Not familiar with KPI measuring tools?
Different methods of measuring KPIs
Measuring KPIs can be done in both traditional and digital manner.
Traditional ways of measuring KPIs include measuring KPIs in excel or spreadsheets, paper-based reports, periodic performance reviews, and manual data entry from reports. These KPI analysis reports ended up being time-consuming and error prone, difficult to compare across teams, getting delayed insights hindering proactive action, and lack of visualising and real-time tracking.
Digital tools for measuring KPIs made this much easier and more effective. Some of these include dashboard-based measurement (Balanced Scorecard), IoT and sensor integration, ERP/CRM integration, predictive KPI analysis, mobile and cloud KPI tracking, and automated reporting and alerts. Some of the advantages included real-time visibility, data accuracy and integrity, predictive insights, easy collaboration and transparency, and scalability across locations and teams. Digitally analysing KPIs would be the best KPI measurement method for managers.
Best practices for measuring KPIs
Measuring KPIs can be tricky, mainly because there are qualitative KPIs just as much as there are quantitative KPIs. To keep an eye on various KPIs, it is important to make them measurable for easy comprehension and strategic planning. It is also important to keep in mind that KPIs should measure performance and not the activity.
To streamline performance tracking and strategic alignment, businesses increasingly rely on tools for measuring KPIs such as digital dashboards, Balanced Scorecards, and ERP-integrated analytics platforms. These tools not only automate data collection but also provide real-time insights and visualisation, making KPI tracking more efficient and practical. For instance, a KPI measurement example in manufacturing could be tracking Overall Equipment Effectiveness (OEE) using a formula that combines availability, performance, and quality. To simplify implementation, organisations can use a KPI measurement template that outlines key elements like KPI definition, calculation method, data source, owner, and review frequency—ensuring consistency and clarity across departments.
Understanding how to track KPIs are just as important as choosing them. Here are a few ways on how to track KPIs:
1. Define the KPI clearly: First thing to note before measuring KPIs is to be clear about what the KPI stand for.
What to include:
- What is being measured
- Why it matters
- How it will be calculated
- Who owns the KPI
- How often it will be monitored.
Example: Take the example of customer retention rate.
- What: Percentage of customers who stay over a period
- Why: Suggests customer loyalty and satisfaction
- Owner: Sales or customer success
- Frequency: Monthly
2. Set a baseline and target: The baseline will be current performance level which acts as the starting point and the target will be the desired performance level which is aligned with strategic goals. This helps measure progress and gap clearly.
Example:
- Baseline: 75% on-time delivery
- Target: 95% within 6 months
3. Use a reliable formula: Each KPI should have a standardised formula for consistency.
Example:
- Profit margin: (Net profit / Revenue) x 100
- Employee turnover rate: (Number of exits / Average headcount) x 100
- OEE: Availability x Performance x Quality
4. Collect accurate and consistent data: Collecting accurate and consistent data is a must to measure KPIs properly.
- Recognise data sources (CRM, ERP, HRMS, production logs, surveys, etc.)
- Ensure data quality (accuracy, timeliness, completeness)
- Automate data collection wherever possible to reduce manual errors
5. Determine the measurement frequency: The goal here is to balance timeliness (to act fast) with trend precision (to see patterns).
- Strategic KPIs: monthly or quarterly
- Operational KPIs: daily or weekly
6. Visualise and monitor over-time: Use dashboards, scorecards, or control charts to visualise KPI trends. Visualisation makes it easy to spot deviations and drive corrective actions.
- Balanced Scorecard tools
- KPI dashboards
- Lean management boards (SQDC, huddle boards)
How to avoid common mistakes when measuring KPIs?
Understanding how to choose appropriate KPIs and how to accurately measure them is only half the journey. The next step which may seem simple is one of the most important ones.
Let's see what the most common mistakes are every company makes when measuring KPIs.
- Measuring too many KPIs: Trying to monitor too many data leads to information overload and dilution of focus. Instead, it’s always better to focus on 3-7 meaningful KPIs per goal.
Example: Instead of tracking 25 manufacturing metrics, focus on OEE, defect rate, and delivery performance.
- Choosing irrelevant metrics: Irrelevant metrics or vanity metrics are those metrics that seem impressive but don’t drive real outcomes.
Example: Instead of tracking number of website visitors, it is better to track website conversion rate or leads generated per visit.
- No clear link to business goals: KPIs that aren’t tied to strategic goals don’t show whether the industry is moving forward or not. It's better to start from the organisational goals, then define KPIs that quantify progress toward them.
- Lack of clear definitions and formulas: If KPIs are not clearly defined, people interpret them differently.
Document: KPI definition, KPI formula, data source, frequency, and owner.
Example: Productivity could mean output/hour or output/employee.
- Inconsistent or unreliable data: This means data errors, manual entry mistakes, or unstandardised sources lead to misleading conclusions. Use automated systems and data validation wherever possible to guarantee accuracy and consistency.
- Ignoring leading indicators: Always relying on lagging KPIs is not enough. There should be a balance between leading and lagging KPIs.
- Not setting targets or benchmarks: Not setting targets will make judging success impossible. Define SMARTER targets – Specific, Measurable, Achievable, Relevant, Time-bound, Evaluate, Readjust.
- Not analysing or updating KPIs: KPIs begin to lose relevance as strategies and markets evolve. Keep an eye on KPIs periodically – drop outdated ones and add new ones aligned with current goals.
- Focusing only on quantitative data: As we have already seen before, there unmeasurable KPIs which are also important. Try to combine quantitative KPIs like defect rate with qualitative ones like employee feedback.
- Lack of clear communication and accountability: If employees don’t understand what KPIs mean or how they influence results, they won’t be able to act on them. Cascade KPIs clearly and assign ownership to drive engagement.
It's quite natural to make mistakes in the very beginning, but it’s better to avoid them as soon as possible.
Interested to know more on how to measure KPIs?
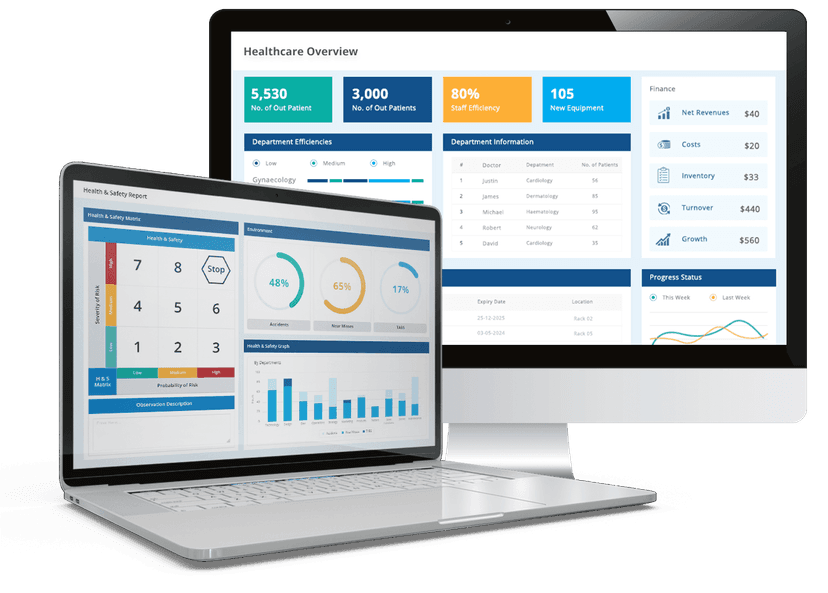
KPI dashboard: Why complicate things when you can track KPIs on a single screen?

Keeping an eye on too much data all at once can seem hectic. It eventually drains your time and energy resulting in poor performance of your business. This can be avoided if there was some scope in visualising all this on a single screen, in a simple and easily comprehensible manner. That's exactly what a KPI dashboard software does.
KPI dashboards exhibit everything on a single screen – how well the production goes, how well the delivery schedule is taken care of, and so on. A KPI dashboard software doesn’t simply display numbers on the screen but tells a story behind your performance. It captures key metrics in real time, offering practical insights while keeping your strategic goals front and centre.
Why use dashboards to measure KPIs?
KPI dashboard software display everything on a single screen making it easy to measure KPIs and make it accessible to every other staff involved. These dashboards being digital representations, make it easy to customise, update and track easily. Other important benefits of using KPI dashboards are as follows:
- Centralised visibility: All KPIs can be made visible across departments in a single interface.
- Real-time insights: Helps to spot deviations and bottlenecks immediately.
- Informed decision-making: Allows leaders to make decisions on live data.
- Accountability: Owners can be assigned, ensuring clear ownership of objectives and measurable progress.
- Engagement: Visual data enables teams connect better with performance results.
Digital dashboards make things much easier compared to traditional boards. It is no surprise that in today’s digitally advanced century, there’s no longer any benefit using traditional boards. Digital dashboards and knowledge about them are what’s going to upgrade business in this 21st century.
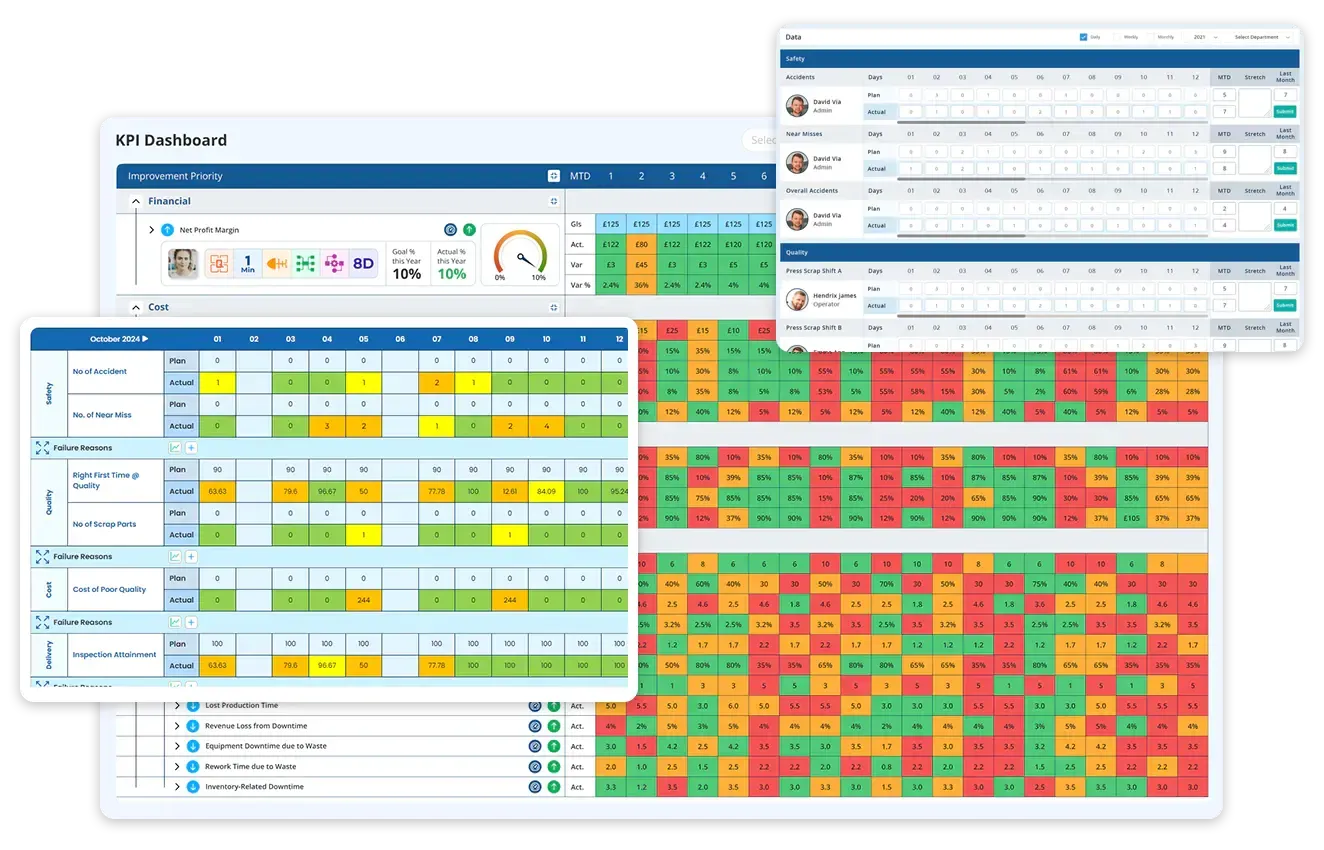
LTS Data Point: Best KPI dashboard software available
Data Point is a digital Balanced Scorecard (BSC) or KPI platform designed to align strategy with implementation, offering real-time dashboards, root cause analysis (RCA), lean operational features and other potential.
Key features of using Data Point to measure KPIs
Data Point offers some elite features that makes the software one of the most preferred to measure KPIs in large industries. Let's see what unique features of Data Point makes it stand out more.
- Interactive dashboards and KPI visualisation: It enables creation of dashboards showing real-time values and targets, status indicators, and trend charts. Some of the KPI measurement frameworks include SQDCP, FCIL, SQDC etc.
- Variance tracking: It enables defining target values and comparing actual performance, spotting gaps and variances.
- Automated data integration: It combines ERP, MES systems, and other data sources to reduce manual data entry and ensure data timelines.
- Supports continuous improvement: It has built-in strategy support (huddle boards, root cause analysis, waste tracking, which is beneficial for manufacturing and operational environments.
- Cross-level KPI alignment: It enables to link KPI from frontline operations up to strategic level, allowing alignment across organisational layers.
- Customisable: You can define your own KPIs, calculation rules, alerts, etc.
- Global access: The platform supports access on multiple devices anywhere anytime, making KPI data available to various stakeholders.
KPIs are more than just performance indicators, they are the compass that directs your business towards success. When chosen correctly and measured accurately, they equip teams, sharpen strategies and promotes growth. But the real trick lies in how you use them, not simply as a tracking tool, but tracking to act upon it. With the right tools, clear definitions, and strategic alignment, your KPIs can transform data into decisions and objectives into achievements. Start measuring what matters and let your KPIs drive the change your business deserves.
Don’t just measure KPIs, lead it with LTS Data Point
FAQs
1. What is a KPI and why is it important for business success?
Key Performance Indicator (KPI) is a measurable value that shows how effectively a business is achieving its strategic objectives. It helps organisations track progress, make informed decisions, and improve performance.
2. How can you set effective KPIs for your organisation?
Start by aligning KPIs with strategic goals, identifying critical success factors, and ensuring each KPI is SMARTER—Specific, Measurable, Achievable, Relevant, Time-bound, Evaluated, and Readjusted.
3. What's the difference between KPIs and other metrics?
KPIs are directly tied to strategic goals and drive decision-making, whereas other metrics provide operational or contextual insights that may not reflect strategic success.
4. Can you give KPI measurement examples?
- Customer Retention Rate = (Customers retained / Total customers) × 100
- Profit Margin = (Net Profit / Revenue) × 100
- Overall Equipment Effectiveness (OEE) = Availability × Performance × Quality
5. What are leading and lagging KPIs?
- Leading KPIs predict future performance (e.g., number of training hours).
- Lagging KPIs measure outcomes after actions (e.g., quarterly revenue).
6. What are some of the best tools to measure KPIs?
Digital tools like Balanced Scorecards, KPI dashboards, and ERP-integrated platforms offer real-time tracking, visualisation, and automated reporting.
7. How often should KPIs be measured?
- Strategic KPIs: Monthly or quarterly
- Operational KPIs: Daily or weekly
8. What are the common mistakes to avoid when measuring KPIs?
- Tracking too many KPIs
- Using irrelevant or vanity metrics
- Failing to link KPIs to business goals
- Ignoring leading indicators
- Not setting clear targets or definitions
9. Why is it important to categorise your KPIs?
Categorising KPIs improves strategic alignment, simplifies reporting, and enhances decision-making by clarifying focus areas and performance levels.
10. What are the different kinds of KPIs?
- Strategic KPIs (e.g., ROI, market share)
- Operational KPIs (e.g., on-time delivery)
- Leading KPIs (e.g., sales leads)
- Lagging KPIs (e.g., profit margin)
11. How do KPI dashboards help in performance tracking?
KPI dashboards centralise data, provide real-time insights, and enable visual storytelling of performance trends—making it easier to act on data.