Why KPI dashboard software is essential for cost control in 2026?
Last updated on : July 31, 2025
In 2026, cost control isn’t just about cutting expenses — it’s about managing performance better every single day. It makes every cost visible, measurable, and manageable in real time. This is where KPI Dashboard Software becomes a must-have tool for businesses wanting to stay competitive, reduce waste, and maximise efficiency. When you track the right KPIs, monitor them in real time, and act on them through clear action plans, cost savings and efficiency naturally follow.
Many leaders still wonder, “How can we actually use our performance data to control costs and improve results?”
This guide explains exactly what KPI dashboards do, how they fit into everyday lean management, and how better tracking, measuring, and acting on your KPIs leads to smarter cost control, better planning, and real improvements in how your business runs.
What is KPI dashboard software?
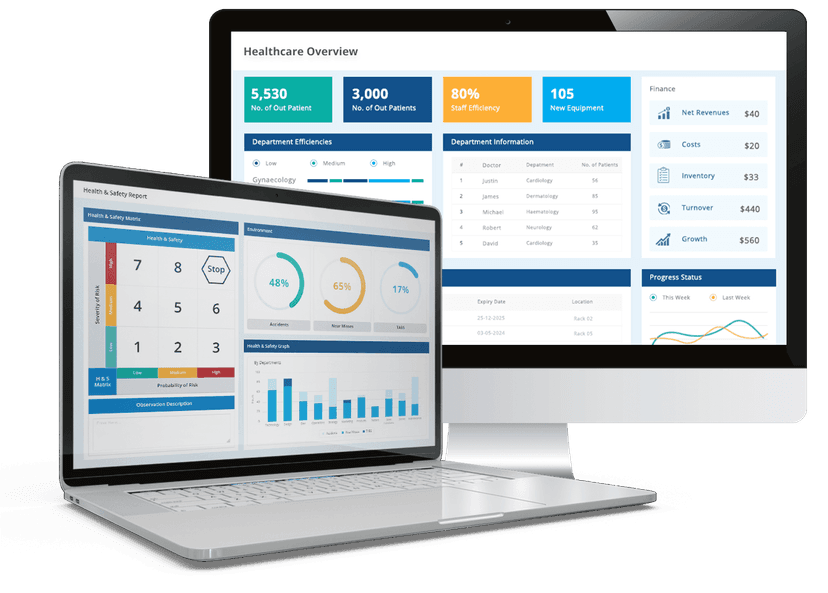
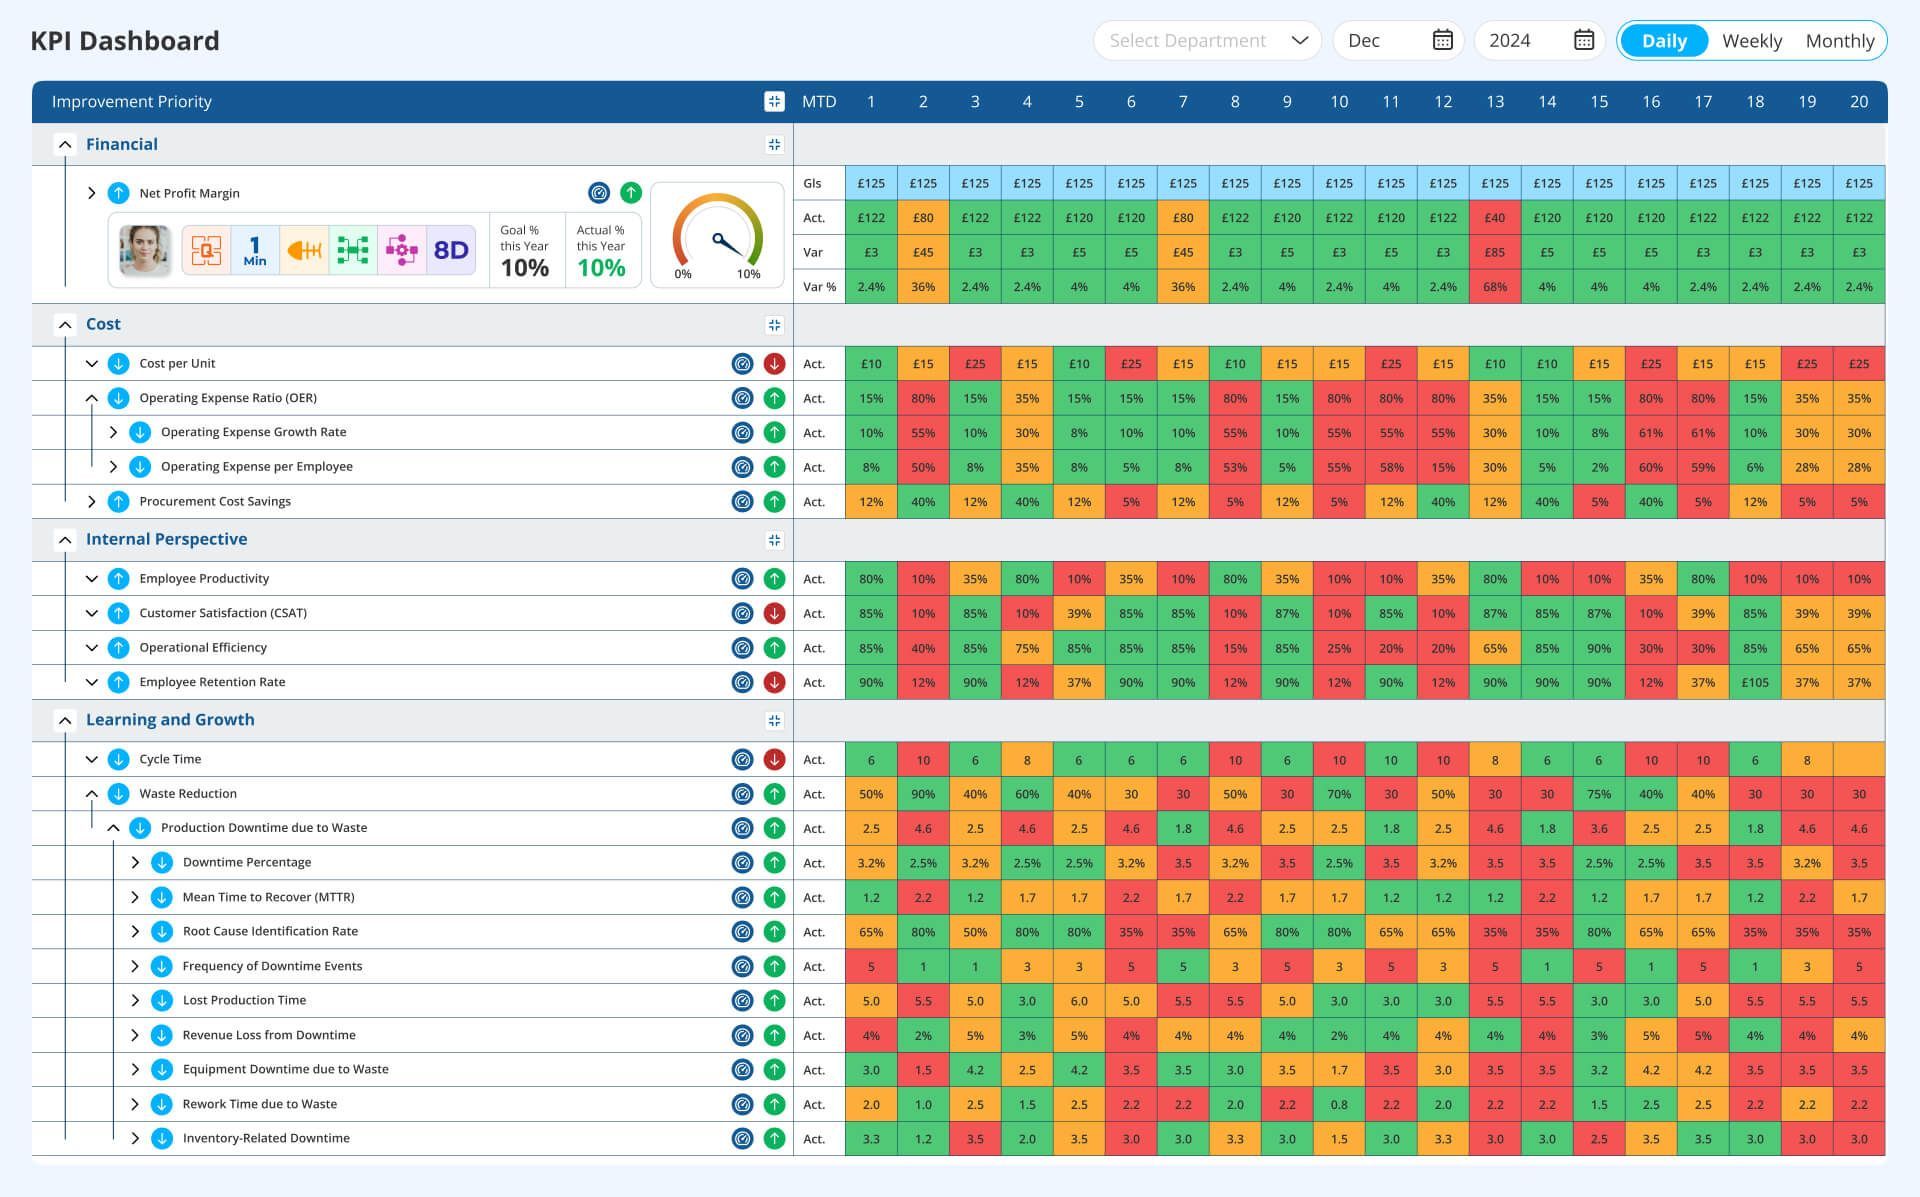
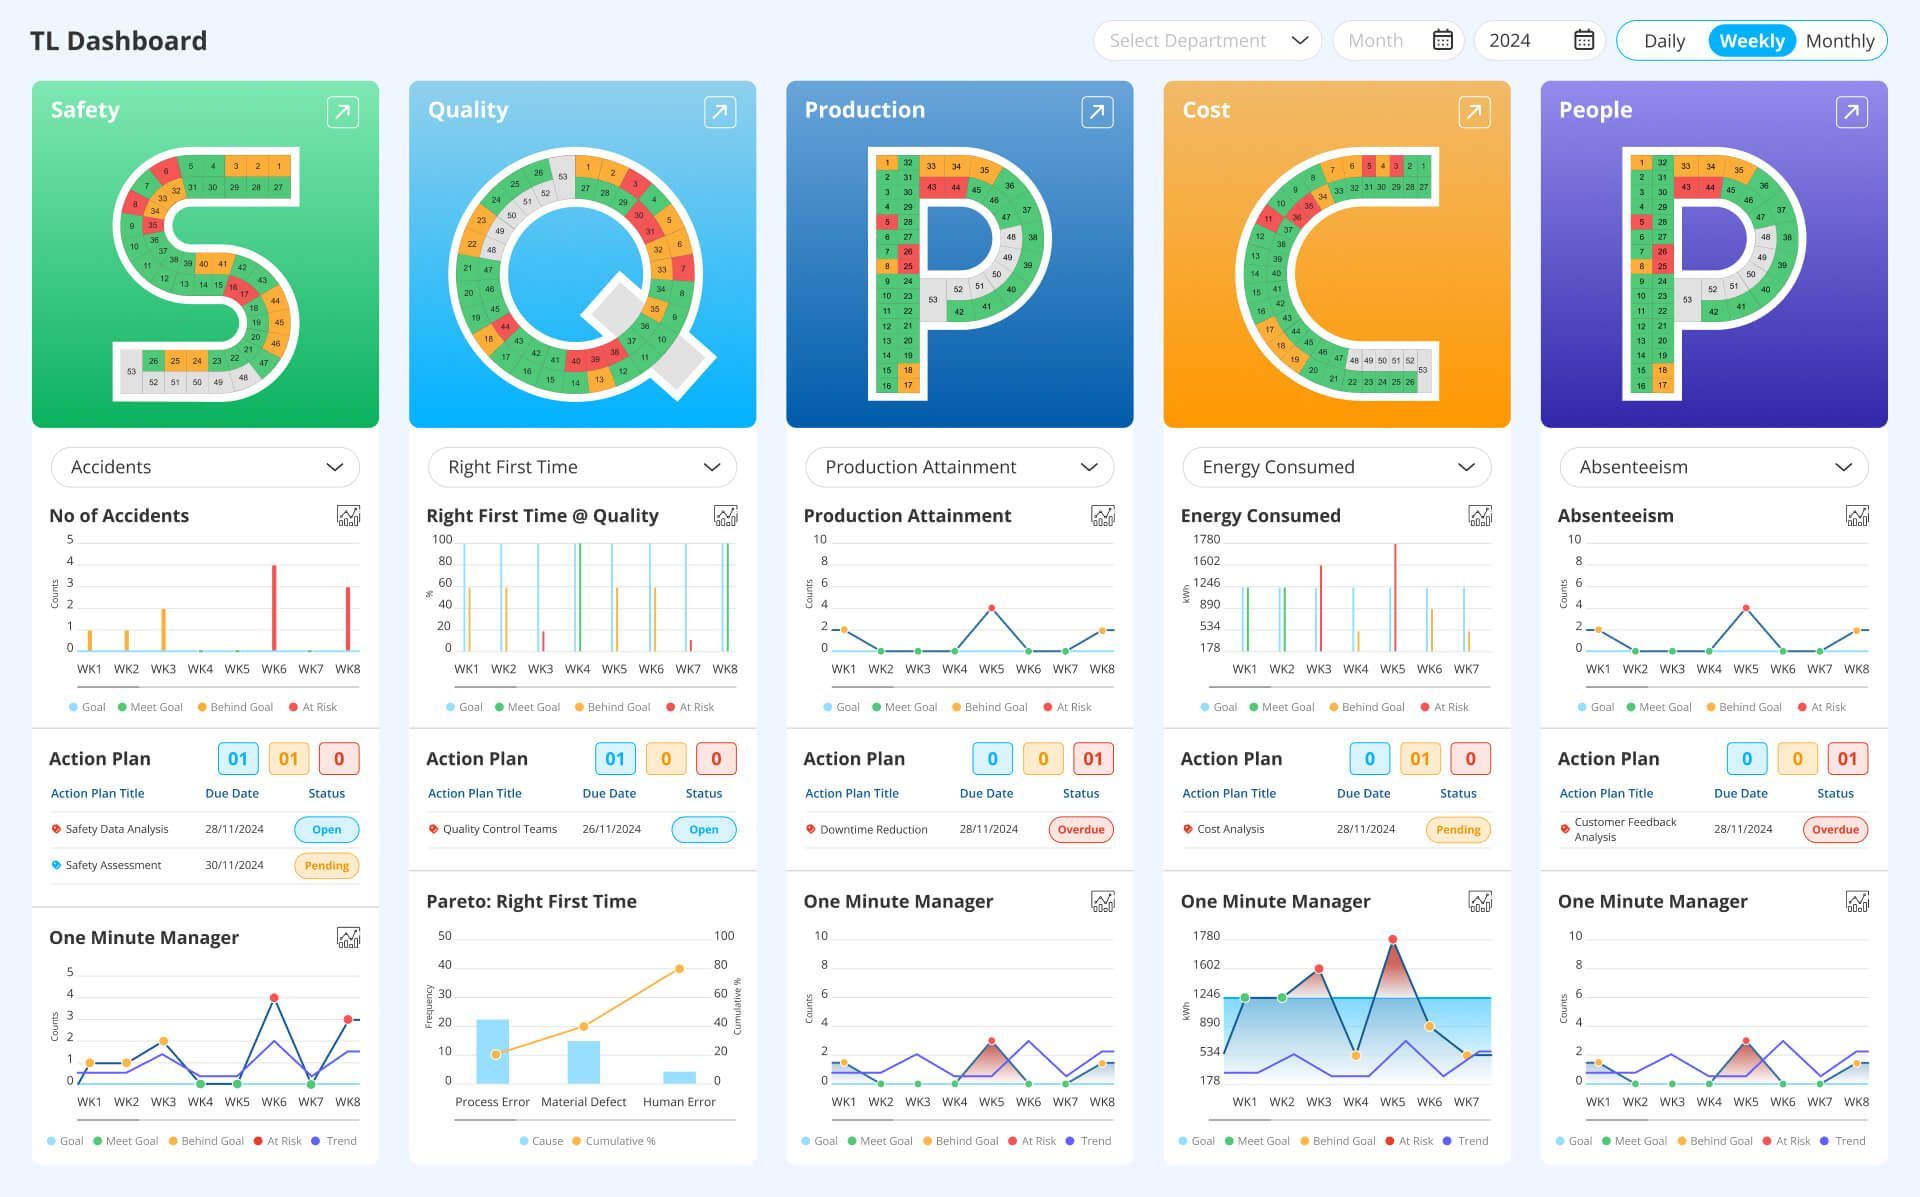
A KPI Dashboard is a visual tool that tracks, displays, and updates your Key Performance Indicators (KPIs) in one place. Instead of hunting through spreadsheets and scattered reports, your team can see all critical metrics— in clear, real-time charts.
How are KPI dashboards and cost effectiveness related?
What if you couldn’t see where your money is leaking? KPI dashboards solve that challenge by turning data into clear insights. KPI dashboards and cost effectiveness are closely linked because dashboards provide real-time visibility into performance metrics, helping businesses identify inefficiencies, reduce waste, and make data-driven decisions that directly lower costs.
A modern KPI dashboard is the smartest cost control system you’ll ever run
What makes a visual KPI dashboard different?
- Dynamic: Unlike static reports, dashboards update automatically.
- Visual: Uses charts, graphs, and gauges — no need for complex data crunching.
- Customisable: Pick which KPIs matter to you — cost per unit, project spend, budget variance.
Popular KPI dashboard types
Why do businesses need KPI tracking software for cost control and efficiency?
Here’s why smart companies use KPI tracking tools to get serious about cost savings and enhancing performance.
KPI tracking software makes cost control practical, not just theoretical. Without it, you may not see hidden spending leaks, duplicate expenses, or budget overruns until it’s too late.
Key reasons to use KPI tracking tools
Keeping costs in check isn’t just about watching expenses — it’s about staying on top of your performance every day. Here’s why using a KPI tracking tool makes that possible:
- Real-time data: Know exactly what’s happening in your operations now, not last week.
- One version of truth: Everyone, from the shop floor to the boardroom, works from the same up-to-date numbers.
- Automatic alerts: Get notified instantly if a KPI goes off track, whether it’s costs, quality, or output.
- Clear ROI: See how your actions — not just reports, turn into real improvements and savings.
- Daily lean management: Support lean daily meetings with accurate live data to fix issues fast.
- Better accountability: Assign owners to each KPI, so everyone knows who’s responsible for hitting targets.
- Action planning: Turn underperforming KPIs into improvement projects — not just static numbers.
- Failure analysis: Spot patterns in missed targets and take corrective action before they become costly problems.
Look at this example of a cost reduction with the help of KPI managing system:
A company using KPI tracking software noticed a spike in maintenance costs on one machine. By catching it early, they prevented a costly breakdown — saving thousands in repairs and downtime.
Common challenges in cost management and how dashboards help
Cost control effectiveness often fails when data is hidden or outdated. Here’s how dashboards break the barriers.
Many companies struggle with:
- Siloed data (everyone works from different files)
- Manual reporting (slow, error-prone)
- Resistance to transparency
KPI dashboard software solves this by:
- Centralising cost data
- Updating automatically
- Showing clear visuals anyone can grasp
Here is an example of how a centralised dashboard enables cost saving.
If a finance team and operations team see different cost numbers, it delays the action. A single dashboard removes that confusion.
Turn every performance target into measurable savings
Must-have KPI dashboard features for smarter cost management?
There’s no shortage of dashboards in the market — but what makes one the best for cost tracking? This part explains the must-have features that separate average dashboards from effective ones.
When choosing the best KPI dashboard software, look for practical features that keep your cost data clear and actionable. The goal is simple: spend less time managing spreadsheets, more time controlling spending.
Must-have features
- Custom KPIs: Track only what matters — no clutter.
- Integration: Connect with ERP, accounting, and CRM tools.
- Visual clarity: Dashboards that are easy to read at a glance.
- Financial tracking: Budgets, forecasts, actual spending — all side by side.
- Mobile access: Monitor costs anywhere.
Basic KPI dashboard Software Vs advanced KPI management system
How KPI dashboard software supports cost control & efficiency?
Now we connect the dots — here’s how dashboards directly help you control costs and boost overall efficiency.
Cost control means spending only where it truly adds value. KPI dashboards help you find savings by exposing costs you might overlook in manual reports.
Ways KPI Dashboards improve efficiency
A well-designed KPI dashboard does more than monitor costs — it helps teams work smarter every day. Here’s how it lifts efficiency in clear, practical ways:
- Bottleneck identification: Spot delays or slow processes so they can be removed quickly.
- Real-time monitoring: See live performance data rather than waiting for end-of-week reports.
- Workload balancing: Identify gaps or overloads and shift resources where they’re needed most.
- Standard work verification: Ensure teams follow agreed processes, reducing rework and mistakes.
- Visual performance trends: Catch dips in output early and fix them before they grow into bigger problems.
- Cross-team alignment: Keep all departments on the same page with shared live data.
- Faster decision-making: Clear visuals mean quicker meetings and faster action.
- Proactive problem-solving: Use alerts and trends to solve problems before they impact performance or cost more to fix.
How does KPI tracking efficiency result in cost reduction strategies?
When your KPI dashboard helps you work more efficiently, cost savings naturally follow. Here’s how improved efficiency through tracking turns into real cost control:
- Detailed spend breakdown: Break down direct and indirect costs so you know exactly where money is being used — and wasted — across departments or projects.
- Budget vs actual tracking: Compare planned budgets with actual spending in real time, so you can spot overspending straight away and correct it before it grows.
- Trend monitoring: Identify cost patterns or repeated spikes over time, so you can fix root causes instead of just reacting to the same issue again and again.
- Smarter decision-making: Use clear, up-to-date data to plan changes confidently, cut waste, and avoid decisions based on guesswork or outdated figures.
- Resource reallocation: Spot underused or overused resources, then reassign them where they add more value — avoiding unnecessary extra costs.
- Actionable insights: Turn underperforming areas into targeted cost-saving projects, backed by real data, not assumptions.
- Fewer surprises: Reduce last-minute budget shocks by checking live figures instead of waiting for month-end reports.
Look at this example of using digital dashboards for daily management and how it contributes to minimising costs.
A project manager uses a cost management dashboard to compare planned vs actual costs weekly. By doing this and assessing and analysing overall performance, they keep projects on budget, reduce last-minute surprises, and free up funds for new investments.
What are the best KPIs for cost control and efficiency?
Not every KPI helps with cost control. This section shows you which ones actually move the needle.
When setting up your cost control dashboard, choose KPIs that directly show where money flows. Here are practical examples:
Essential cost KPIs
A strong KPI dashboard for cost control should track clear, direct cost figures. Here are key cost KPIs most organisations use to keep spending in line:
- Cost per unit produced: Shows how much it costs to make each item or deliver each service.
- Budget variance (%): Tracks the difference between what you planned to spend and what you actually spent.
- Cost avoidance savings: Measures savings achieved by preventing future costs — not just cutting current ones.
- Maintenance costs: Keeps tabs on planned and unplanned maintenance expenses.
- Overhead expenses: Tracks indirect costs like utilities, admin and facilities.
- Operating expenses (OPEX): Measures the day-to-day running costs of your business.
- Procurement costs: Monitors spending on materials, parts, or external services.
- Labour costs: Tracks total wages, overtime, and any unplanned staffing costs.
- Waste and scrap costs: Measures the cost of wasted materials or rejected products.
- Energy costs: Monitors spend on electricity, gas or fuel — often a hidden drain on budgets.
- Logistics and transport costs: Tracks what you spend to move goods internally and to customers.
When these figures are clear and visible on a dashboard, it’s much easier to spot overspending, plan budgets and protect margins.
Related KPIs that indirectly affect cost and efficiency
Not all savings come from obvious line items. Some KPIs focus on efficiency and quality — they don’t show as ‘costs’ directly, but they strongly influence what you spend. Tracking them helps prevent hidden losses and supports lean daily management.
Here are important examples of KPIs to include in your KPI dashboard:
- Downtime: Monitors unexpected production stoppages that lead to wasted time and higher costs.
- First pass yield (FPY): Tracks how often products are made correctly the first time; higher FPY means less rework and scrap.
- Rework rate: Measures how much work needs doing twice; more rework means higher labour and material costs.
- On-time delivery: Shows how reliably you meet customer deadlines; missed deadlines can lead to penalties or extra costs.
- Cycle time: Measures how long it takes to complete a task or process; shorter cycle times usually reduce costs.
- Machine utilisation: Tracks how efficiently equipment is used; poor utilisation often means wasted resource costs.
- Employee productivity: Monitors output per worker or per shift; higher productivity reduces labour cost per unit.
- Inventory turnover: Shows how fast stock moves; slow stock ties up cash and storage costs.
- Supplier lead time: Long or inconsistent lead times can increase costs through rush orders or excess stock.
Customise and track your KPIs smarter with the best dashboard
How to use KPI dashboards for cost cutting strategies?
Dashboards don’t just track; they guide action. The best companies don’t wait for costs to go up; they use dashboards to stay ahead.
Here’s how to link them with smart cost-cutting ideas.
Practical cost cutting strategies with KPI dashboards
- Spot wastage: Identify excess inventory or process bottlenecks.
- Lean practices: Use dashboards to track lean metrics like cycle time.
- Energy savings: Monitor utility costs to lower energy waste.
- Productivity boosts: Compare planned vs actual productivity to reduce overtime costs.
- Asset utilisation: Track machine usage to avoid idle time and improve ROI on equipment.
- Preventive maintenance: Use maintenance KPIs to avoid unexpected breakdowns and high repair costs.
- Workforce allocation: Analyse shift performance and headcount KPIs to reduce unnecessary labour costs.
How to track and measure cost optimisation KPIs
Tracking cost KPIs means setting baselines, collecting accurate data, and checking regularly. Here’s a simple flow of cost metrics measuring:
A [Define cost KPIs] ➡ B [Set baseline & targets] ➡ C [Collect real-time data] ➡D [Monitor trends] ➡E [Adjust and optimise]
Tips for better cost optimisation
- Use automatic data feeds — no manual data entry.
- Review weekly or monthly — don’t wait till year-end.
- Share dashboards with teams so everyone acts on the same data.
Real-life examples of KPI dashboards for cost savings
KPI dashboards are not just theoretical tools — many organisations already use them daily to track performance, solve problems early and manage costs more effectively. Here are real-world examples that show how a proper KPI management system turns data into visible savings across different industries.
Example 1: Manufacturing
Challenge: A mid-sized factory struggled with unexpected spikes in scrap material costs, which were quietly eating into margins. Manual reports were too slow to catch issues in time.
Solution: By using a financial KPI dashboard linked with production data, the operations manager could see scrap costs in real time, broken down by machine and shift. Daily lean meetings used this dashboard to review waste hotspots.
Result: The team spotted overproduction trends and set clear limits, supported by automatic alerts when waste levels crept up. As a result, they cut raw material waste by 15% within three months — saving thousands without affecting output.
Example 2: Projects
Challenge: A project manager used a cost tracking dashboard to compare forecast vs actual spend. It flagged overspending in labour hours, saving the project $20,000.
Solution: They introduced a project cost management dashboard that compared planned budgets against actual daily spend for materials, subcontractors and equipment hire. Site managers updated figures daily, visible to head office in real time. Result: The dashboard flagged overspending patterns early. By reassigning budgets and tightening procurement processes, the company kept project costs within plan and avoided surprise overruns, leading to direct cost savings and improved trust with clients.
Example 3: Small Business
Challenge: A local service business used a cost-efficient dashboard to cut utility bills by tracking energy use trends. Solution: They used a cost efficiency dashboard to track fuel expenses by job type, location and technician. Daily KPI checks highlighted routes with high travel time. Result: By adjusting schedules and planning more efficient routes, the business reduced travel costs by 12% while completing more jobs per day — boosting both cost savings and productivity.
Your industry, your KPIs, start your cost-saving journey
How to choose the right KPI dashboard software for cost control?
A quick checklist for decision-makers to choose right KPI too or software for cost control
- Custom metrics
- Integration with ERP/MES/CRM
- Automated reporting
- Mobile access
- AI-powered insights (tie this to AI overviews)
- Factors: scalability, ease of use, real-time updates, support.
Ready to take control of your KPIs and reduce costs? Get Data Point Balanced Scorecard today
A modern KPI Dashboard Software helps you spend wisely, work efficiently, and grow without hidden costs eating into profits. Here is where Data Point is special. If you want to turn your KPI tracking into real action, cost savings and higher efficiency — all in one place — the Data Point Balanced Scorecard is designed for you.
Data Point combines full KPI management, lean daily management tools, real-time tracking, automated reporting and built-in AI-driven insights to help you:
- Track, monitor and measure the right KPIs.
- Connect performance results to clear cost savings.
- Run daily lean meetings with live, accurate data.
- Spot failures or gaps quickly — and take action.
- Link operational teams, managers and strategy all in one system.
It’s easy to use, fully scalable and integrates seamlessly with your ERP, MES or CRM. Whether you’re managing a factory floor, a project site or a full company, Data Point keeps everyone focused on what matters — performance, efficiency and sustainable cost control.
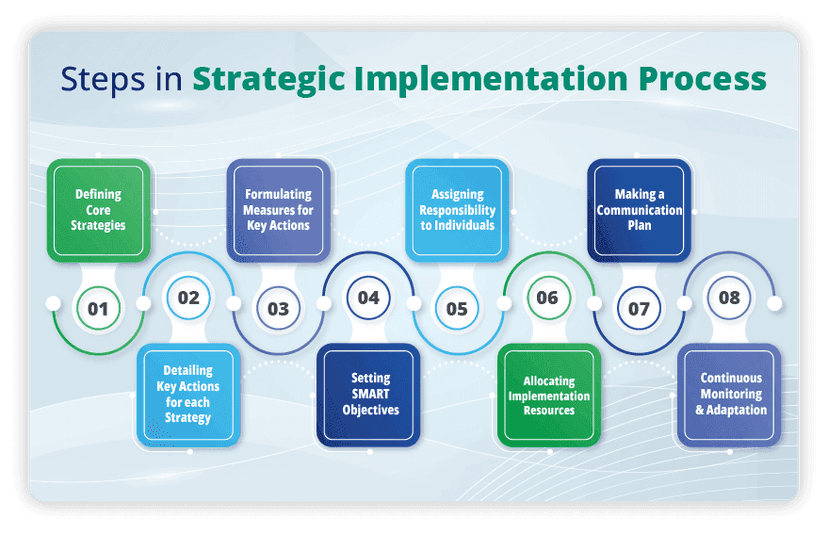
How to implement a KPI Dashboard Software: Step by step process
Even after finding the best software for KPI management like LTS Data Point , based on the Balanced Scorecard principle, teams struggle to use it fully. Here’s a simple, clear process to help you set up your dashboard, so it drives performance improvements and supports cost-reduction goals.
Follow these key steps to make sure your KPI dashboard works properly from day one:
Set clear goals: Start by deciding what you want to achieve — for example, cutting waste by 10% or keeping project budgets under control.
Identify key areas: Look at the parts of your business where costs are highest or where savings could have the biggest impact.
Choose the right KPIs: Pick KPIs that directly track cost drivers, like budget variance, scrap rate, downtime, or labour costs. Add supporting KPIs that indirectly affect costs, like quality or delivery performance.
Map your data: Check where the needed data sits — in your ERP, CRM, MES or spreadsheets — and make sure it can flow into your dashboard automatically.
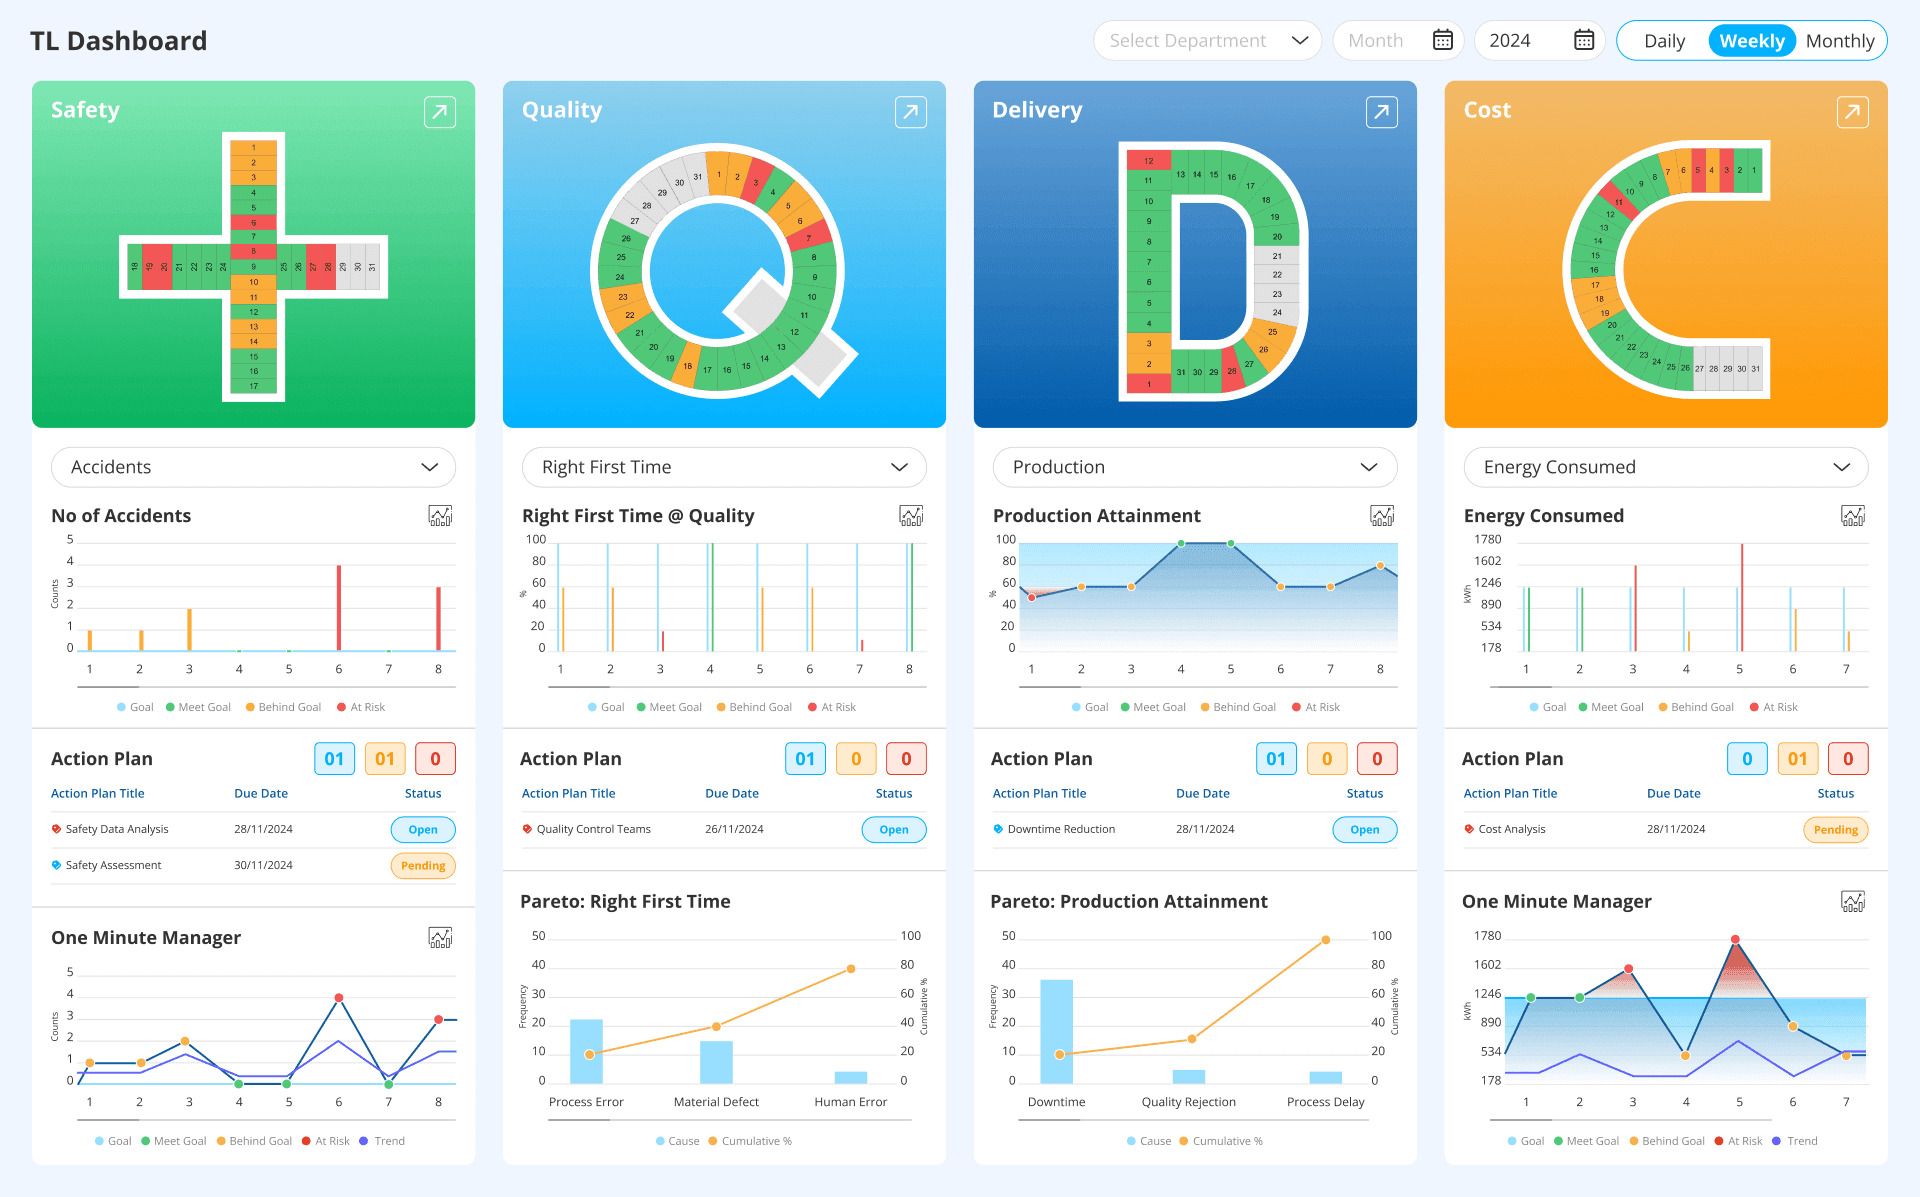
Design your dashboard: Lay out your dashboard so it’s clear and easy to read — group KPIs by area (cost, quality, delivery) so teams know what to check daily.
Set baselines and targets: Define what ‘good’ looks like. Use past data to set realistic targets that show when things are on track or going off course.
Train your team: Make sure everyone knows how to read the dashboard, spot problems and take quick action when KPIs show a risk.
Review and improve: Hold regular meetings (like daily stand-ups or weekly huddles) to check performance, update action plans, and adjust KPIs if needed.
When you track the right KPIs, review them in real time and act on what you see, cost savings and efficiency gains follow naturally. Data Point Balanced Scorecard gives you everything you need in one place — full KPI tracking, lean daily management, strategic alignment and live, accurate insights to turn goals into real results. Ready to see how it works? Book your free demo or talk to our experts today.
FAQs
1. What is KPI dashboard software and how does it work?
KPI dashboard software is a tool that collects, displays and monitors your key performance indicators in one place. It pulls live data from your existing systems so managers and teams can see performance trends.
2. How can real-time KPI tracking improve cost control?
Real-time KPI tracking shows you what’s happening now — not last month. By spotting budget overruns, waste or downtime as they happen, businesses can fix problems immediately, avoid hidden costs and protect their profit margins.
3. What features should I look for in KPI management software?
Look for features like custom metrics, real-time updates, easy integration with ERP or CRM, automated reporting, mobile access and AI-powered insights. Good KPI management software should help you turn raw data into clear actions and better cost control.
4. Is a KPI dashboard useful for small businesses too?
Yes — small businesses use KPI dashboards to track performance, reduce manual reporting and stay on top of budgets. Even simple KPI dashboards help owners manage daily costs, plan better and stay competitive without needing large teams.
5. What KPIs can indirectly affect business costs?
KPIs like machine downtime, first pass yield, quality scores, employee productivity and on-time delivery all influence costs behind the scenes. Tracking these helps reduce waste, rework and late penalties, which protects your bottom line.
6. How does KPI software support lean daily management?
KPI dashboard software makes lean daily management easier by giving teams live data for stand-ups or huddles. It keeps everyone focused on performance, highlights problems early and turns small daily actions into long-term cost savings and efficiency gains.