October 16, 2024
Do you know that a KPI dashboard can help a manufacturing company to set objectives, monitor progress, and make better decisions by measuring performance over time? Let's understand it.
Sometimes, a manufacturing manager flies blind with multiple production targets, delivery timelines and safety incidents. The scattered data across different systems struck somewhere makes the organisation unable to see the bigger picture. That's the tussle various manufacturing companies face: visualising performance.
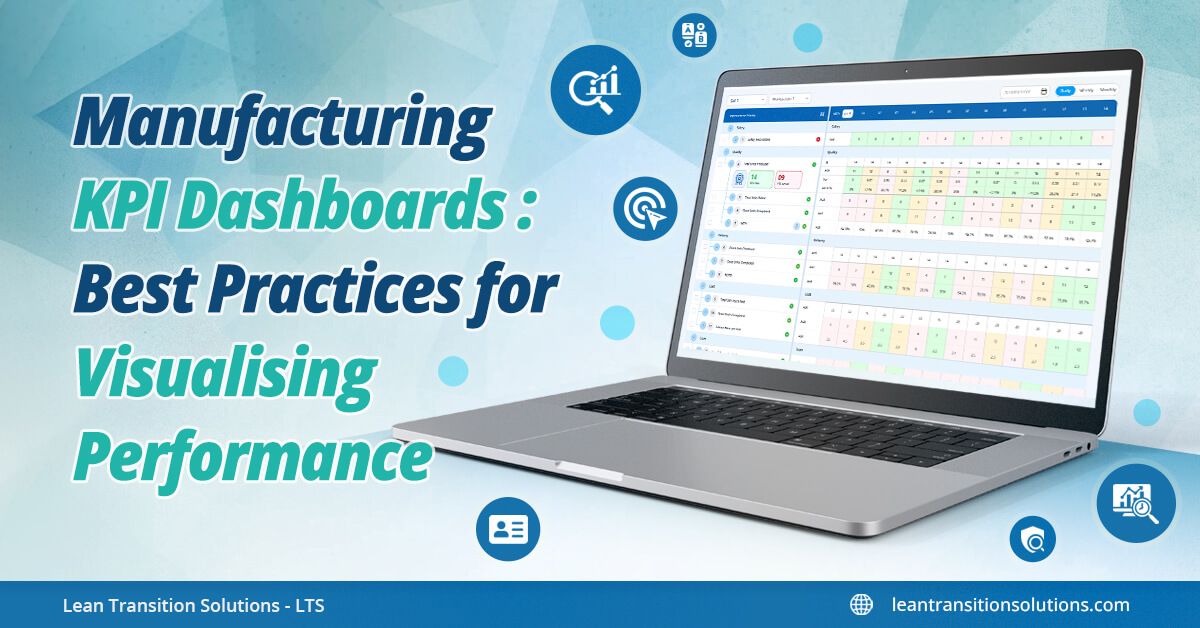
This is where KPI dashboards come in. Measuring the Key Performance Indicators (KPIs), the quantifiable metrics which is the backbone of a manufacturing business that improves organisational performance. Imagine having a single screen that displays you everything—how your production lines are undertaking, how well your team is attaining delivery schedules, where costs are wasting up, and so on. A dashboard tracks your significant KPIs, provides you with real-time insights and aligns them with your strategic objectives. Apart from providing numbers, a dashboard narrates your performance stories through visualisation.
Without a systematic visualisation tool, it is difficult for every business to stay competitive. Lack of a dynamic dashboard causes improper monitoring of key metrics, misalignment and delayed decision making. Let's look at its other features.
Now, it is clear that having a KPI dashboard can give magical results than using traditional visual board methods. To boost the effectiveness and efficiency of KPI management, implementing a Balanced Scorecard is the best approach. Balanced Scorecard aligns every business activity with strategic goals and ensures a comprehensive view of performance. The several benefits of Balanced Scorecard as a KPI tracking and strategic planning software include making data-driven decisions and fostering communication and collaboration.
Through effective performance visualisation, manufacturing managers can monitor progress, set objectives and make informed decisions. Unclear visibility and scattered data hinder the manager from getting an overall picture of what's happening in the firm. Performance visualisation is easy with the help of a KPI dashboard, which consolidates every Key Performance Indicator on a single screen and provides real-time insights into cost management, production and delivery. It also enables consistent tracking, increased workforce productivity, and attainment of strategic objectives through centralised data and transparency. Balanced Scorecard is a dedicated KPI tracking software that provides an efficient KPI dashboard for better visualisation. The Balanced Scorecard gives a holistic view of performance by aligning business activities with strategic goals and data-driven decision-making. Implementing a Balanced Scorecard software helps manufacturing organisations act excellently in KPI management and ultimately drive to success.
1. What is a KPI Dashboard?
KPI Dashboard provides an instantaneous organised review and analysis of Key Performance Indicators (KPIs) by displaying them in visual elements such as charts, graphs and so on. KPIs are the quantifiable performance measurement over time for certain strategic objectives.
2. How do you visualise KPIs?
With the help of a KPI Dashboard a business can visualise their relevant KPIs in an easy to understand way. Dashboards provide visual feedback, real-time assessment and trend analysis and insights.
3. What are the best practices for KPI setting?
4. What is KPI in lean manufacturing?
In manufacturing, Key Performance Indicators (KPIs) are quantifiable metrics used to track the efficiency and performance of a production process.
5. What is a manufacturing dashboard?
A manufacturing dashboard visualises production process and performance. It offers a quick overview of production, quality assurance, inventory level and other important information.