Why most MNC strategies fail — And how to fix them with real-time execution tools with examples

Last updated on : August 1, 2025
Key takeaways
- MNCs need a clear KPI cascade from corporate to site level.
- Modern tools like Data Point Balanced Scorecard replace static spreadsheets and generic BI dashboards.
- Features like Hoshin Kanri X matrix and real-time tracking drives true accountability.
- Root Cause Analysis (RCA) and action plans keep strategies alive — not forgotten on paper.
- Visibility from top to bottom helps deliver real results, faster.
From strategy planning to execution: What MNC leaders need to know
Building a strong strategy for a single factory or site is challenging enough. But how do you create an effective organisational strategy for a multinational company with operations scattered across countries, cultures and time zones?
It’s a question that keeps VPs of operations, pillar site heads and corporate strategists awake at night — especially in manufacturing, where every hour of downtime or misalignment can cost millions.
Today, we’ll break down exactly what makes a good multinational strategy work in practice, why so many fail to deliver, and how modern tools like the LTS Data Point Balanced Scorecard help transform big goals into results — from the boardroom to the shop floor.
Top-performing MNCs don’t just plan — they track and adapt with precision. Why not you?
The big picture: Why organisational strategy is different for MNCs
At its core, a strategy should answer:
- Where are we now?
- Where do we want to be?
- How will we get there?
- How do we measure progress?
But multinational companies add layers of complexity:
- Multiple pillar sites: each region or site might have unique challenges.
- Diverse leadership: regional heads, plant managers and corporate HQ often juggle conflicting priorities.
- Communication barriers: time zones, languages and cultures can slow alignment.
- Disconnected data: sites run their own spreadsheets or local dashboards, so corporate leaders lack real-time insights.
It’s no surprise many leaders ask:
‘What’s the best way to align every site with our global goals?’
Why do multinational companies need a clear corporate strategy?
Whether you make auto parts or electronics, your success depends on more than good products. A strong corporate strategy gives you:
- Clarity: what’s important and what’s not.
- Focus: where you’ll win and how you’ll compete.
- Alignment: every site and team works towards the same goals.
- Accountability: you know who owns what.
- Resilience: you adapt fast when things change — because they will.
Without a clear strategy, local sites drift. Departments set their own goals. People waste time on work that doesn’t move the business forward.
What are the core pillars of a successful corporate strategy?
For manufacturing MNCs, a strategy must cover these pillars:
- Vision and mission: your north star — where you’re going and why.
- Strategic goals: clear targets for profit, growth, quality, safety, and sustainability.
- Pillar areas: break goals into focus areas — operational excellence, quality assurance, cost management, people development.
- KPIs and metrics: how you measure success at each level.
- Cascading: how big goals flow down to daily work at each site and line.
- Governance and SOP: how plans, performance and resources are reviewed and adjusted.
- People and culture: how you engage and empower teams to deliver.
- Tools and processes: the systems that make it visible and actionable.
Still using static spreadsheets to manage global performance? Try the all-in-one strategy and KPI management platform.
How do you align multiple sites and regions with your corporate goals?
A powerful strategy is useless if it lives only at headquarters. Success comes when you cascade it:
- The corporate board sets big targets.
- Regional heads adapt them to local realities.
- Site managers break them into daily KPIs.
- Team leaders translate them into tasks.
- Operators know exactly how they contribute.
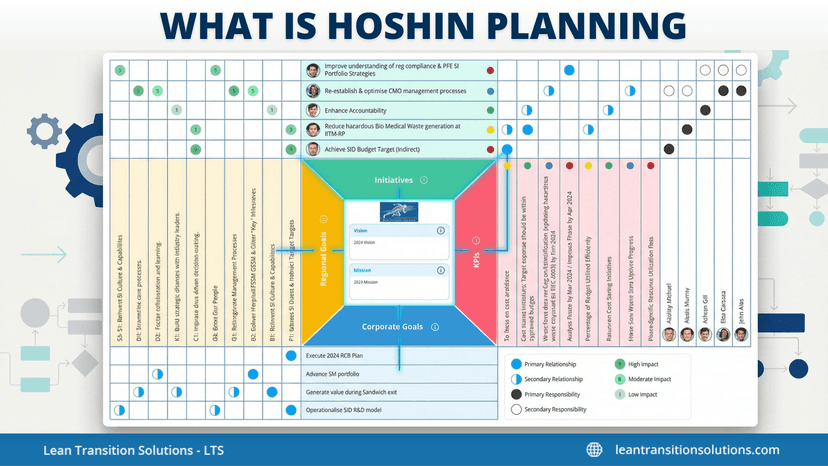
A proven way to manage this is the X matrix or Hoshin Kanri — tools that visually link goals, KPIs, owners and timelines.
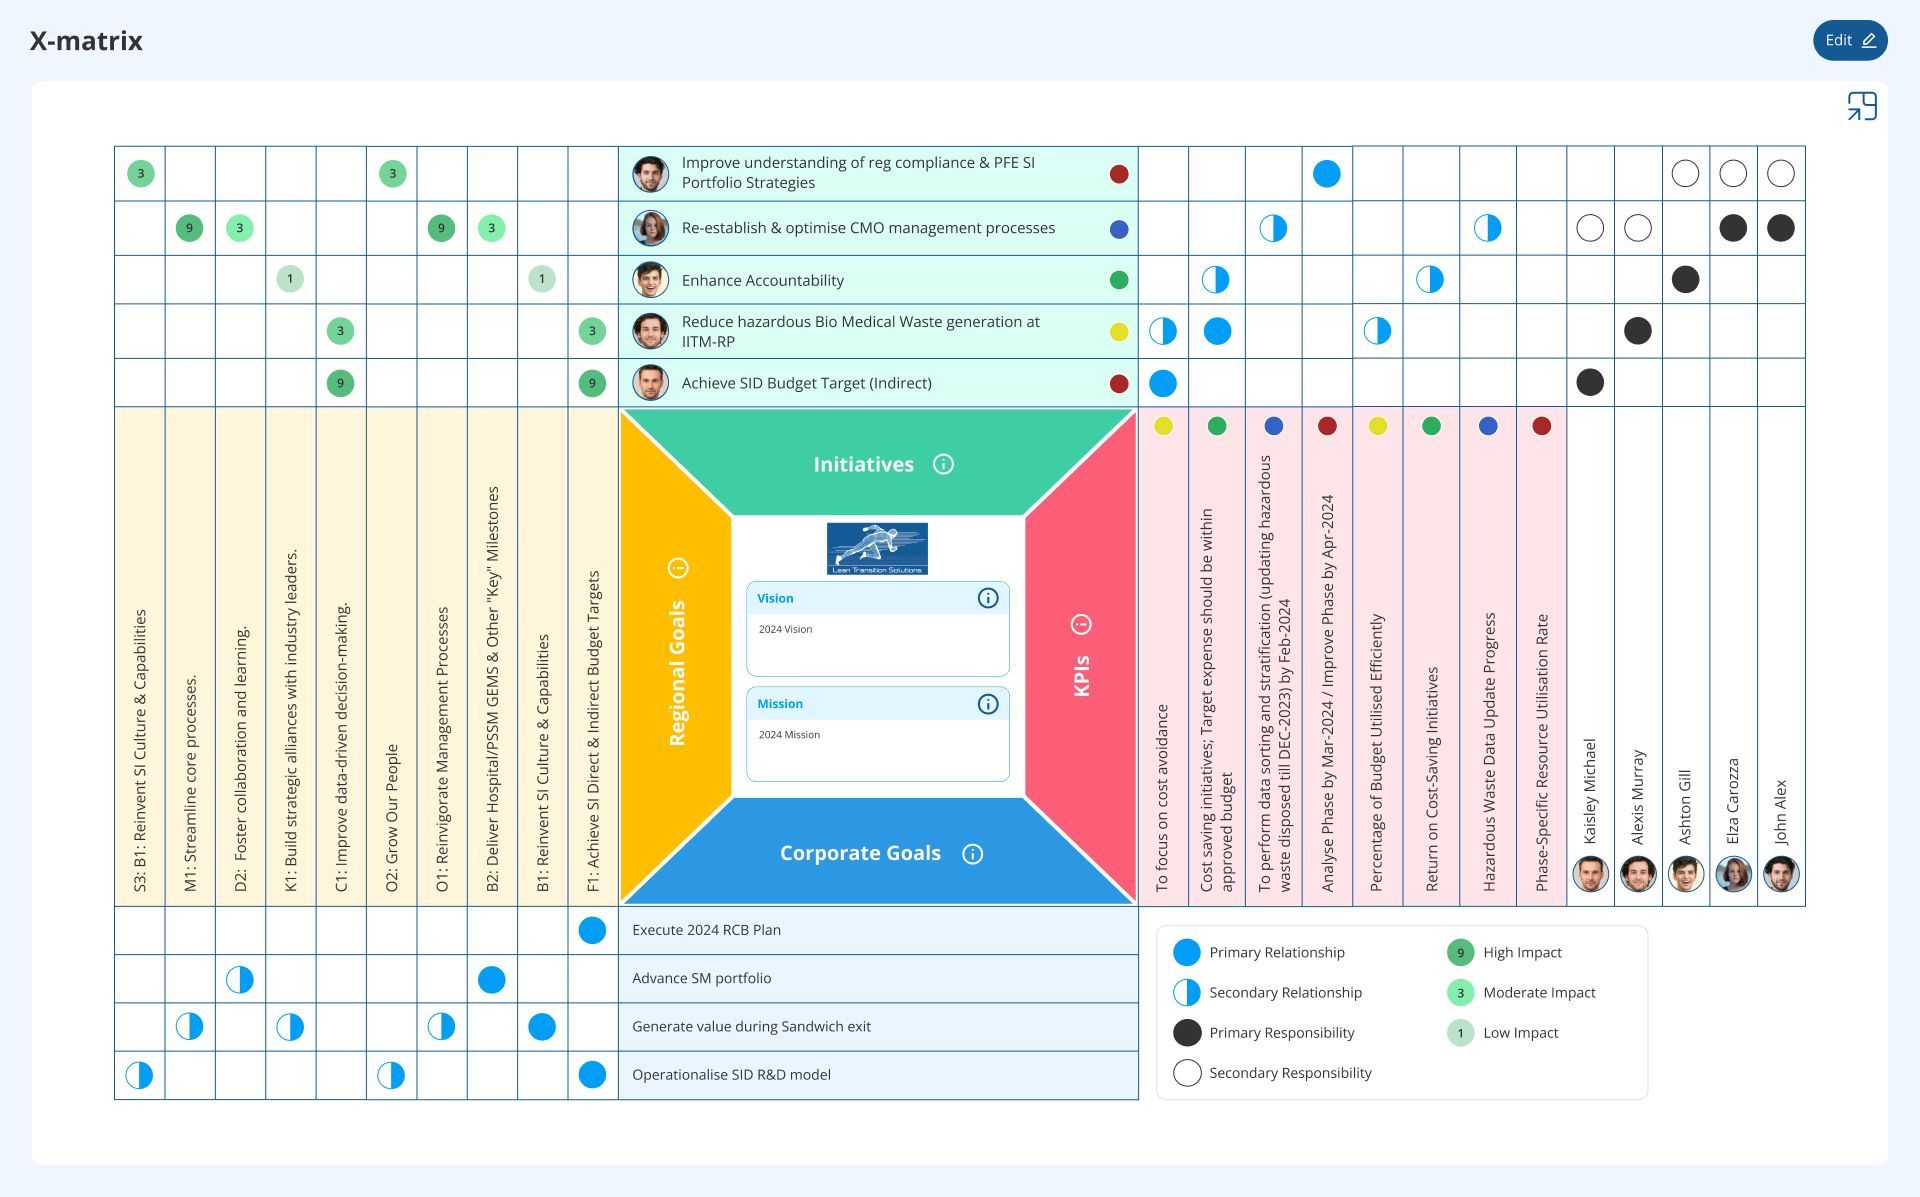
How Hoshin Kanri X Matrix provide visual strategy deployment?
The X Matrix, a core component of Hoshin Kanri strategy deployment, offers a single-page visual that connects long-term goals to annual objectives, KPIs, accountable owners, and improvement initiatives. It enables corporate leaders to define strategic intent, while allowing regional and site teams to see how their work aligns — all in one structured, shareable format.
How to build a winning multinational strategy: A step-by-step guide
Below is a simple blueprint you can adapt for your organisation. While this outlines the basic approach, it can also be executed more efficiently using modern digital tools and advanced techniques.
Define clear corporate objectives
Start at the top. What are your company’s big ambitions? Example:
- Increase global production by 15%
- Reduce cost per unit by 5%
- Achieve net zero emissions by 2030
Identify strategic pillars
Group those objectives into focus areas. Many manufacturers use pillars like:
- Operational excellence
- Quality assurance
- Cost efficiency
- Sustainability
- Safety
- Customer satisfaction
Develop regional and site-level goals
A goal means little without a local context. Each region should adapt pillars to its reality. For example:
- Corporate: ‘Cut cost per unit by 5%’
- Region A: ‘Reduce energy costs by 3%’
- Region B: ‘Minimise scrap by 4%’
Derive KPIs from goals
This step is often missed. A goal is direction; a KPI is evidence.
- Goal: ‘Reduce scrap’ → KPIs need to track for achieving this goal: first pass yield, defect rate
- Goal: ‘Improve uptime’ → KPIs need to track for achieving this goal: OEE, mean time to repair (MTTR)
Build accountability
Assign each KPI an owner. Make it visible. This avoids blame games when results fall short.
Monitor progress continuously
Use modern tools or KPI management systems that track KPIs in real time — not stale spreadsheets that get updated once a month.
Choose the strategy execution system trusted by global leaders to align every region, every KPI
How do you know your global strategy is working: the best way to track strategy execution
This is where many MNCs get stuck. They plan well but fail to track execution effectively.
A few common pitfalls:
- Spreadsheet chaos: each site runs its own files — nobody has the same version.
- Lagging data: reports come weeks later, when it’s too late to fix.
- No root cause checks: if KPIs fall behind, there’s no structured way to solve it.
Why are spreadsheets not enough for global strategy execution?
Spreadsheets break under the weight of a multinational operation:
- Files get out of sync.
- Sites hide bad data.
- Leaders lose trust in the numbers.
- No easy link between metrics and actions.
The fix? Implementing a clear strategy-to-execution system
The fix is getting a Modern Strategy execution software with the features of:
- Live dashboards
- Aligned goal cascades
- Visual tools (like an X matrix or Hoshin Kanri)
- Root cause analysis methods (fishbone, five whys)
- Action plans embedded in the same platform
What’s the best way to connect corporate SOPs with local operations?
Many MNCs struggle because standard operating procedures (SOPs) look good in a binder — but they’re not followed daily. To close this gap:
- Tie SOP compliance to KPIs.
- Train teams on why SOPs matter.
- Audit regularly — but also act on audit results.
- Give each site the freedom to adjust SOPs safely when local realities demand it.
Tools like Data Point Balanced Scorecard help link SOP checks to live performance metrics and corrective actions — so standards don’t just exist, they work.
Which KPIs should a multinational manufacturing company track?
Every MNC needs a balanced set of KPIs:
- Financial: cost per unit, revenue growth, gross margin.
- Operational: OEE (overall equipment effectiveness), cycle time, downtime.
- Quality: defect rate, first pass yield, rework cost.
- People: training hours, safety incidents, engagement scores.
- Sustainability: energy per unit, waste recycled, emissions per tonne.
Each KPI must be SMART — specific, measurable, achievable, relevant and time-bound. And every KPI must have an owner.
Example: manufacturing KPI cascade for a multinational company
Modern tools that make corporate strategy work
Once you have your strategy framework, the next challenge is choosing tools that bring it to life. Many leaders ask:
‘What’s the best way to track strategy and KPIs for a multinational company?’
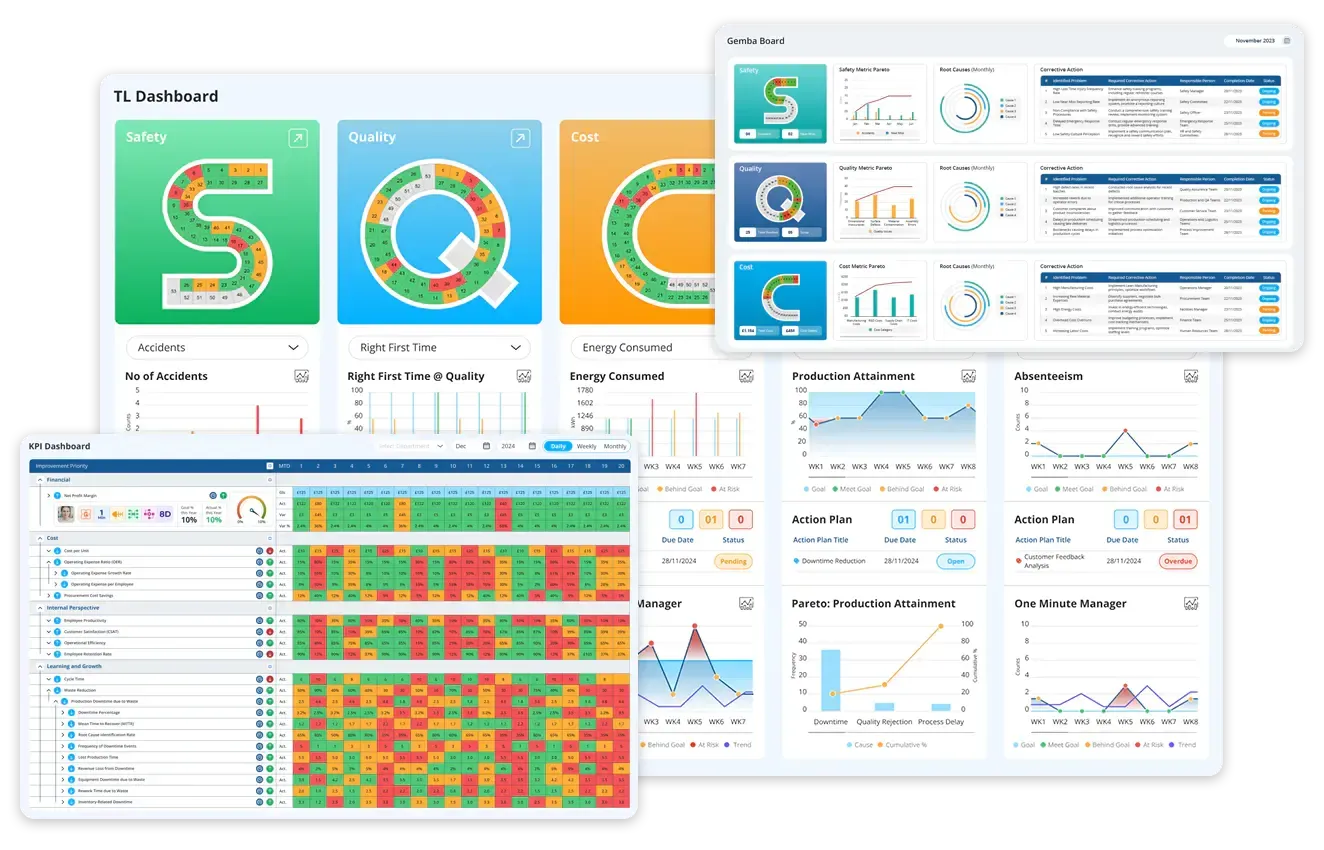
Here’s what modern, practical tools do better than spreadsheets or generic BI dashboards:
- Visual strategy maps: see how goals connect, from boardroom to line-level tasks.
- Hoshin Kanri / X matrix: clear policy deployment to link strategy, tactics, KPIs and owners.
- KPI dashboards: live performance at every level — corporate, regional, site, team.
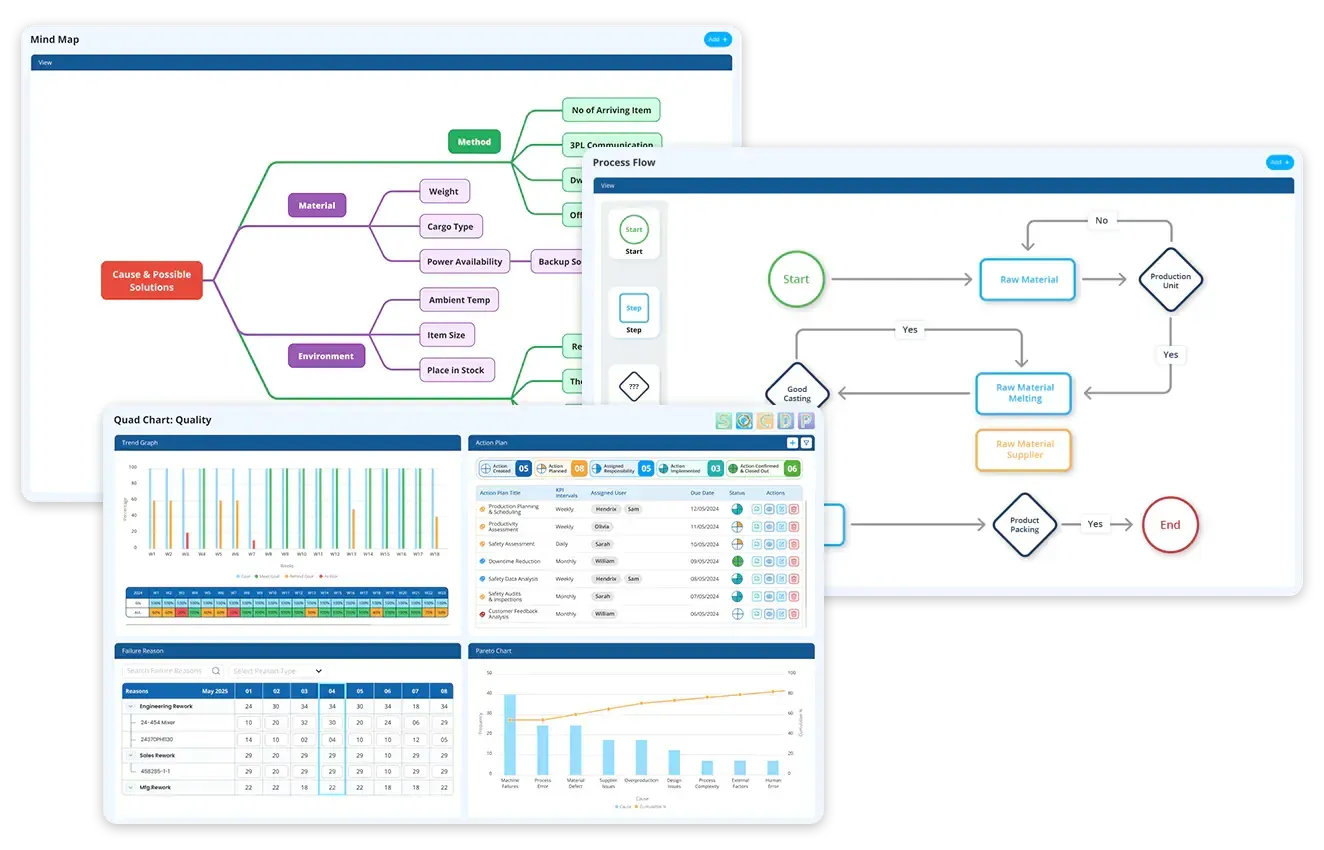
- Root cause tools: fishbone diagrams and five whys built in.
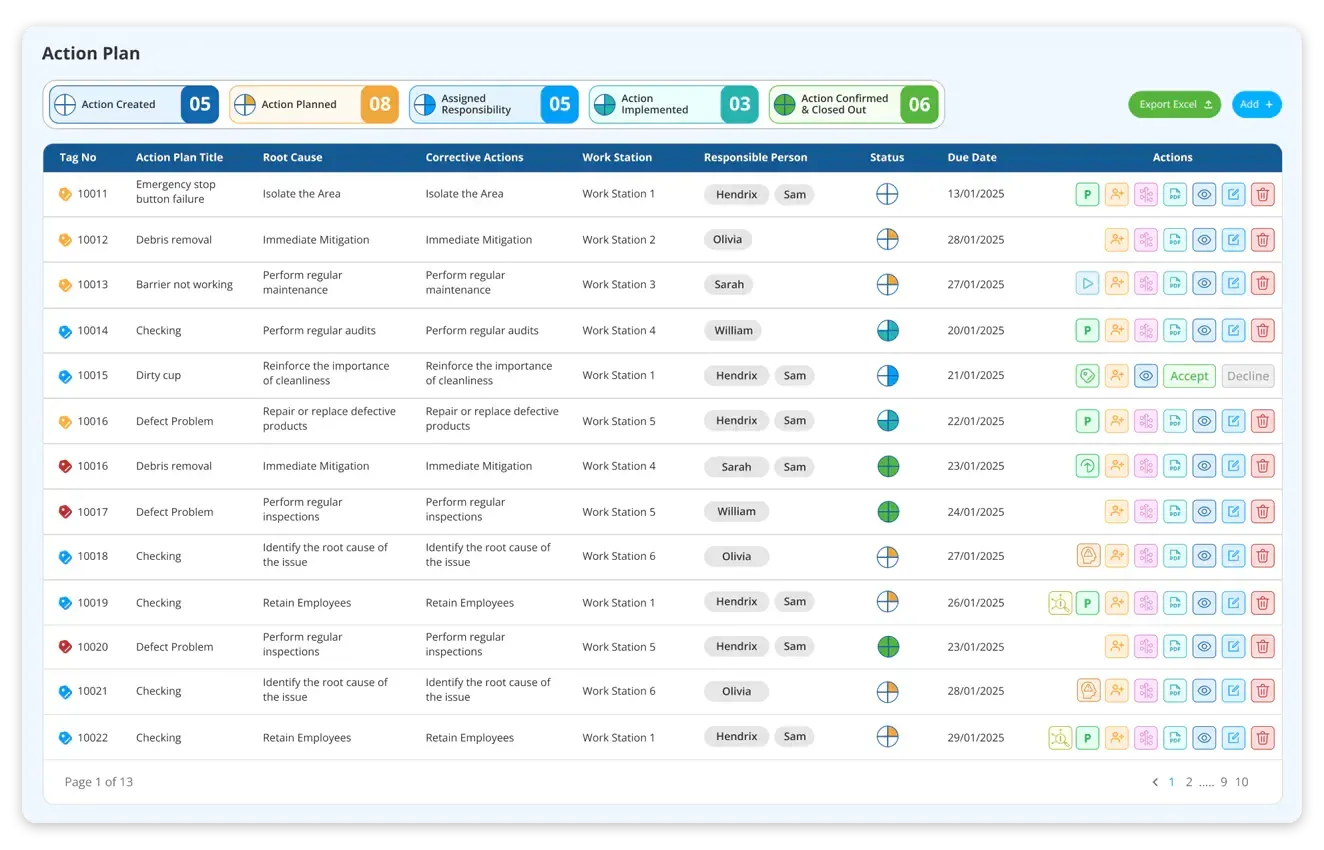
- Action plans: create tasks, assign owners, track due dates and monitor progress — all in one place.
How do you ensure people stay engaged with the strategy?
Even the best strategy fails without people. Successful MNCs:
- Make goals visible and simple to understand.
- Hold regular stand-ups and pillar meetings.
- Celebrate wins — highlight sites or teams hitting KPIs.
- Use scorecards and dashboards everyone can see.
- Link strategy to daily problem-solving.
- Train leaders to coach, not just check results.
Leading MNCs are switching to digital strategy tools that actually scale — are you ready?
How can manufacturing leaders use root cause analysis to stay on track?
When a KPI slips — say, scrap spikes at a site — good companies don’t just blame people. They:
- Spot the deviation in real time.
- Use root cause tools like the fishbone diagram or five whys.
- Develop countermeasures.
- Link the fix to an action plan.
- Track the action plan’s impact on the KPI.
What makes the Fishbone diagram a strategic tool for multisite root cause analysis?
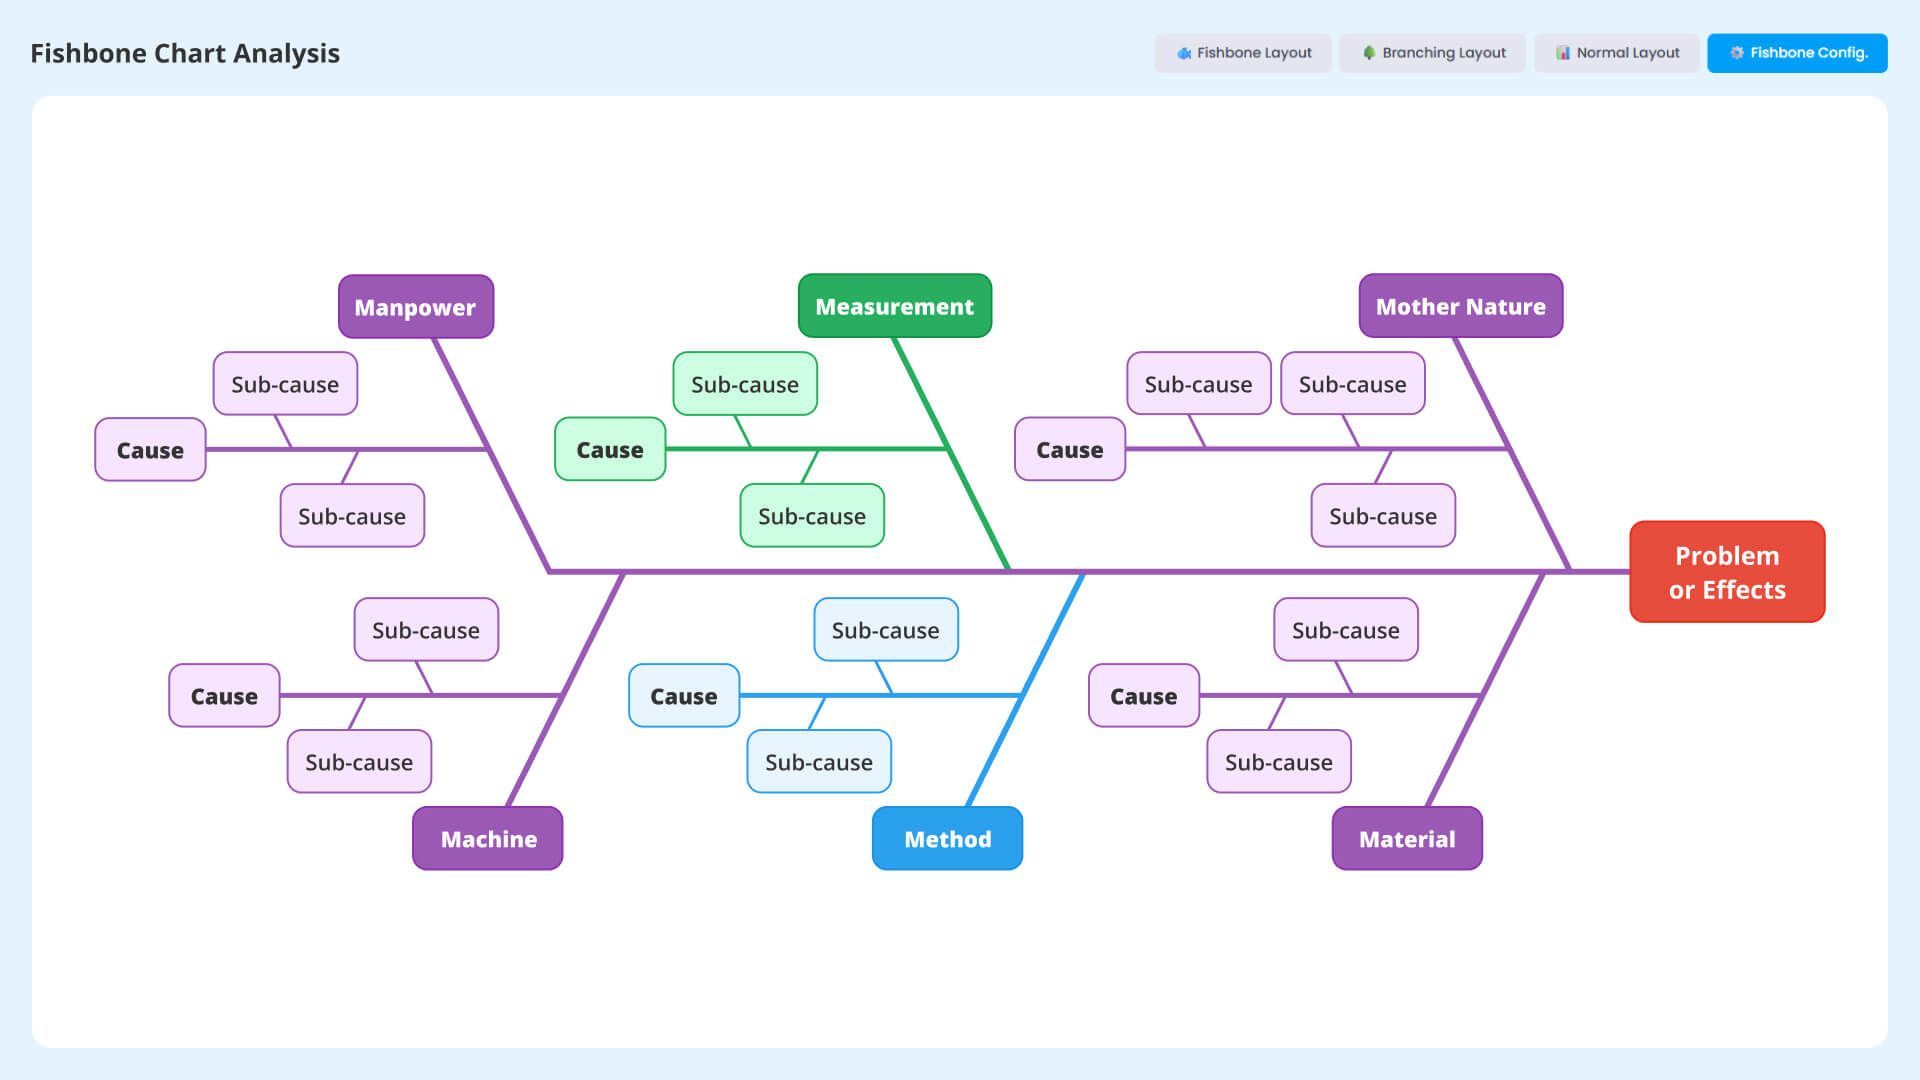
The fishbone diagram (also called the Ishikawa diagram) gives manufacturing leaders a visual way to trace issues back to their root causes. Like the spine of a fish, the central “bone” represents the problem.
For example, consider it as a drop in yield or a spike in downtime. From it, categories like People, Process, Equipment, Environment, and Materials branch out as “bones,” helping teams map potential contributing factors quickly.This helps leaders to visually break down a problem without guesswork.
In a digital Fishbone system, his diagram is more than a sketch — it's an interactive tool. Teams can link root causes directly to KPIs, track action plans, and ensure that insights from one plant benefit all.
How does a balanced scorecard make strategy execution practical?
A modern balanced scorecard turns big goals into daily work by:
- Linking strategy, tactics, metrics and actions.
- Making every site’s performance visible instantly.
- Highlighting gaps early.
- Guiding daily meetings and stand-ups.
- Holding everyone accountable, from corporate HQ to line leaders.
Data Point as the best KPI visualisation and management software replace endless spreadsheets with:
- Live dashboards everyone can trust.
- Visual goal cascades (X matrix).
- Root cause tools built in.
- Corrective actions connected directly to KPIs.
- Lean tools for continuous improvement.
Real-world example: how a global manufacturer achieved better strategy management with Data Point
One global automotive supplier struggled with high scrap costs across plants in Asia and Europe. Using the LTS Data Point Balanced Scorecard, they:
- Created an X matrix to align corporate goals to site KPIs.
- Monitored defect rates daily on live dashboards.
- Launched root cause checks using built-in fishbone tools.
- Tracked corrective actions in the same system.
Within six months, they reduced scrap by 8% — saving over £2 million.
Ready to align strategy and execution?
If you want your multinational strategy to move from spreadsheets and slide decks to real-time action — see how LTS Data Point Balanced Scorecard can help.
- From corporate strategy to site-level KPIs
- From root cause to continuous improvement
- From silos to clear, aligned daily action
Build a strategy that delivers results, not just reports.
Choose Data Point strategy execution system trusted by MNC leaders to align every region, every KPI.
FAQs
1. How do I develop a corporate strategy for multiple sites?
Define a clear mission, break it into measurable goals, cascade those goals through regions and sites using visual tools, and track progress with live dashboards and scorecards.
2. What’s the best way to align SOPs with strategy?
Tie SOP compliance to KPIs, audit regularly, adapt SOPs safely for local sites and link corrective actions to strategy metrics using a single tool.
3. Which tools help manage multinational KPIs?
Use a balanced scorecard like Data Point, which combines strategy maps, X matrix, Hoshin Kanri, real-time KPI tracking, root cause analysis and lean action planning in one place.
4. How do I create an effective strategy for a multinational company?
Break it down:
- Define clear corporate goals.
- Group them into strategic pillars.
- Adapt goals to regions.
- Derive KPIs.
- Cascade them with owners.
- Track progress in real time.
- Solve problems quickly.
5. Which strategy is most suitable for a multinational organisation?
A combination of global standardisation and local adaptation is ideal. Frameworks like Hoshin Kanri help align corporate strategy with regional and site-level actions.
6. How to track a strategic plan?
Use real-time KPI dashboards to monitor progress, identify gaps, and ensure alignment between objectives and actual results.
7. What is the best practice for reporting MNC performance?
Best practices include consistent KPI frameworks, cross-regional data standardisation, and using visual management tools to ensure clarity across departments and locations.
8. How to choose the best tool for planning and executing multinational strategies?
Look for tools that support strategy mapping, goal cascading, multi-site collaboration, and real-time KPI tracking—all in one digital platform.
9. How digital KPI dashboards ensure better MNC performance?
KPI software provides instant visibility into global operations, flag performance issues early, and supports faster, data-driven decisions across all sites.

Geandra Queiroz, Operations Management Consultant
Geandra is an Operations Management Consultant at Lean Transition Solutions, specialising in Lean philosophy, Lean Six Sigma, and strategic planning across manufacturing and healthcare. She is currently completing her PhD in Industrial Engineering at the Federal University of São Carlos, researching the integration of Operations Strategy, Lean, and Green Manufacturing.