Effortless Continuous Improvement for sustainable growth
Drive sustainable growth with Data Point by enabling continuous improvement through real-time insights and strategic alignment.
Empower your organisation with data-driven Continuous Improvement
Continually evaluate the business performance with analytic findings that ensure each improvement initiative yields quantifiable results.
- KPI tracking
- Performance dashboards
- Scorecards and reports
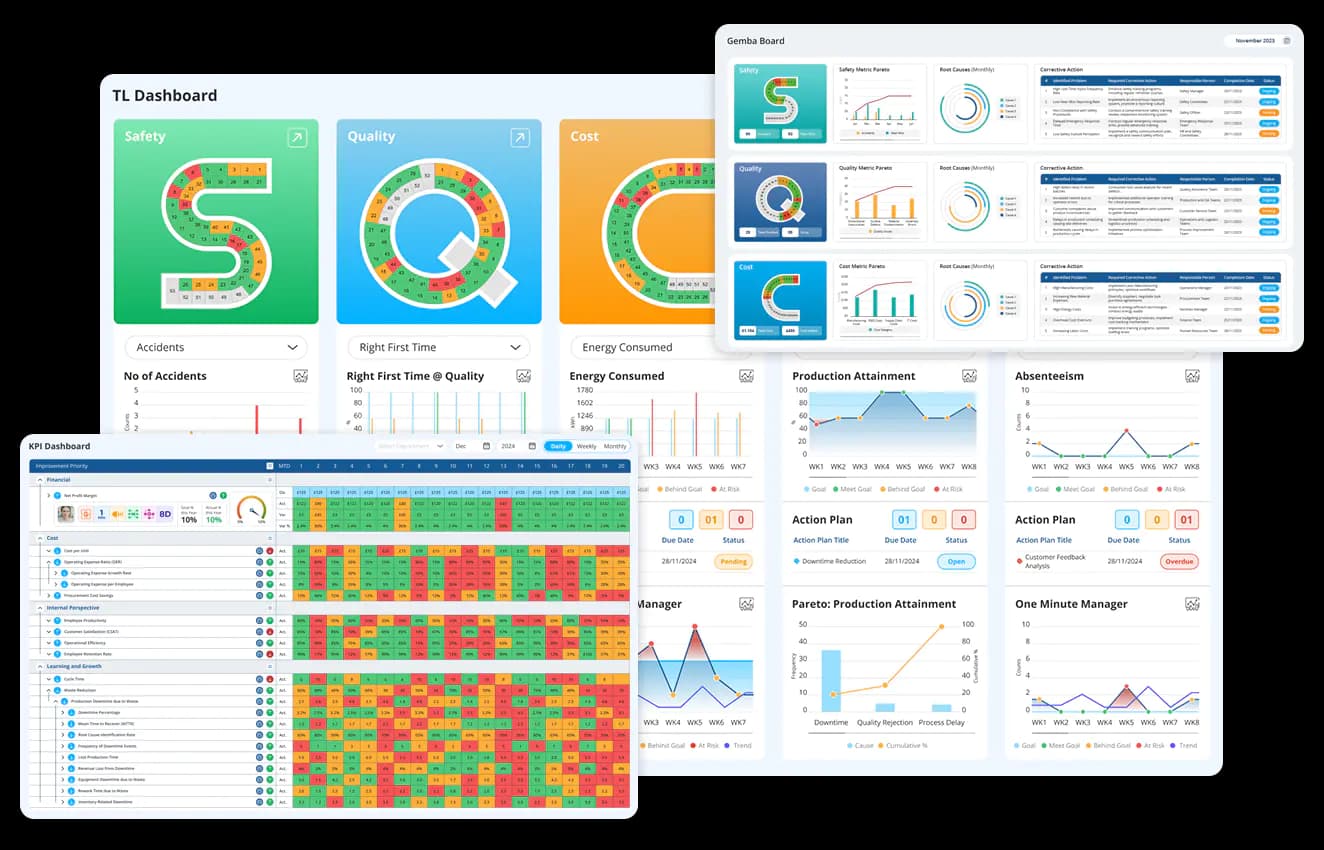

Master Lean’s 8 wastes, optimise production and achieve cost savings. Use data visualisation dashboards to track and address inefficiencies.
- Waste reduction tools
- Bottleneck resolution
- Savings tracking dashboards
Leverage Six Sigma methodologies to reduce process variability and enhance operational quality through data-driven decision-making.
- Root cause analysis tools
- Statistical process control
- Process standardisation support

Drive organisational growth with Continuous Improvement

Align continuous improvement goals with business objectives and support Gemba Walks. Track KPIs and enable faster resolutions.
- Flexible process monitoring with Huddle boards
- Process bottleneck alerts
- Corrective action insights
Empower teams with custom dashboards and reports displaying key metrics and project statuses. Take informed actions based on real-time data.
- Performance monitoring dashboards
- Work-in-Progress (WIP) tracking
- KPI and OEE dashboards


Mitigate potential risks with advanced analytics and predictive tools. Prevent project delays and ensure smooth implementation of improvement initiatives.
- Risk identification tools
- Scenario modelling
- Preventive action planning
Build a Continuous Improvement culture today!
Choice of industry leaders and Fortune 500 companies


















How does Data Point ensure continuous improvement?
Data Point improves procedures and operations by providing a holistic view of an organisation’s performance and regularly evaluating the KPIs.

Centralised information hub
Consolidating all critical data into a single platform

Support for improvement frameworks
Advanced frameworks to guide teams systematically

Continuous feedback loops
Facilitates regular communication and feedback
Let Data Point measure and analyse the impact of your process improvement
Continuous Improvement Software: The Complete Guide to Process Optimisation and Sustainable Growth
Learn how Continuous Improvement software helps organisations identify process variation, perform root cause analysis, standardise improvements, model risks, track initiatives, and sustain measurable performance gains.
How does Statistical Process Control Integration change the way process variability gets identified, compared to just watching a KPI trend?
A KPI trend line shows whether a metric is generally moving up or down. It does not distinguish between normal variation, the natural fluctuation every process has, and a genuine signal that something has changed in the underlying process. Reacting to every small dip as if it were a real problem wastes effort chasing noise.
Statistical process control tools calculate control limits based on the actual variation the process has historically shown, which means a data point can be flagged as genuine special-cause signal rather than ordinary fluctuation. This distinction matters because it tells a team when to investigate and when to leave a stable process alone, which is a different and more disciplined question than simply asking whether the latest number looks good or bad.
How does process standardisation support sustained improvement rather than a one-time gain that erodes over time?
An improvement implemented without a corresponding standard tends to hold only as long as the people who implemented it remain in place and actively enforce it. Once staff changes, memory fades, or attention shifts elsewhere, the process often drifts back toward its previous state, and the gain quietly disappears.
Standardisation support means the improved process is documented as the new baseline, not left as an informal understanding among the team that made the change. This is what distinguishes a genuine improvement from a temporary correction. The standard becomes the reference point new team members are trained against, which is what keeps the gain in place after the original improvement team has moved on to something else.
How does scenario modelling before implementing an improvement reduce the chance of unintended consequences?
Implementing a process change and observing what happens is the most common way improvement initiatives are tested, largely because modelling the change in advance is often skipped as too time-consuming. The cost of that shortcut is that unintended consequences are only discovered after the change is live and already affecting production.
Scenario modelling lets a team test how a proposed change might behave under different conditions before committing to it. This is particularly valuable for changes with dependencies elsewhere in the process, where an improvement that looks beneficial in isolation could create a new constraint once implemented. Testing the scenario first is what catches that kind of consequence before it becomes an operational problem rather than a modelling exercise.
How does a centralised information hub change collaboration between teams working on different improvement initiatives simultaneously?
When each team running an improvement initiative keeps its own records, data, and progress notes in separate systems or spreadsheets, there is no easy way for one team to check whether another team's initiative might affect their own, or whether a similar problem has already been addressed elsewhere in the organisation.
Consolidating critical data into a single platform means that visibility exists by default rather than requiring teams to actively seek it out. A team starting a new initiative can check whether a related effort has already been attempted, and what was learned from it, without needing to know which team ran that initiative or where their records are kept.
How does root cause analysis fit within a Six Sigma approach to continuous improvement, and what does it add beyond a standard investigation?
A standard investigation into a performance issue often stops once a plausible explanation is found. Six Sigma's approach to root cause analysis is more disciplined about confirming that the identified cause is statistically responsible for the variation observed, rather than accepting the first reasonable-sounding explanation.
This distinction becomes important when a process has multiple contributing factors and the team needs to know which one accounts for most of the variation before committing resource to a fix. A structured root cause investigation that confirms cause rather than assumes it is what prevents a corrective action from being aimed at a plausible but ultimately secondary factor.
How does risk identification specifically for improvement initiatives differ from general operational risk management?
Operational risk management typically looks at what could go wrong in ongoing business as usual. Risk identification for improvement initiatives is a narrower question: what could cause this specific change to fail, stall, or produce an unintended negative effect on a part of the process it was not meant to touch.
Identifying those risks before an initiative launches means potential failure points, such as a dependency on a resource that might not be available, or a change that could create a bottleneck elsewhere, are surfaced while there is still time to plan around them. This is a different exercise from a general risk register, because it is specific to the initiative being planned rather than a standing assessment of the operation.
How does preventive action planning as part of risk management differ from the preventive action stage within a CAPA process?
Preventive action within CAPA is typically a response to a specific confirmed root cause, aimed at stopping that failure mode from recurring elsewhere. Preventive action planning within improvement initiative risk management is broader. It is aimed at risks identified before an initiative has even started, based on what could plausibly go wrong with the plan itself.
Both serve the same purpose, preventing a problem before it occurs, but they operate at different points in the improvement lifecycle. CAPA's preventive stage responds to something that has already failed once. Risk management's preventive planning anticipates failure before the initiative has been implemented at all, which means it is working with hypothetical rather than confirmed failure modes.
How do continuous feedback loops keep an improvement initiative from being treated as complete the moment it is implemented?
An initiative marked complete once that planned change has been implemented treats implementation as the finish line. In practice, whether the change produces the intended improvement, and whether it continues to hold over time, only becomes clear through ongoing feedback after implementation, not now the change goes live.
Facilitating regular communication and feedback after implementation keeps the initiative under review rather than closed the moment the visible action is complete. This is what surfaces a gain that erodes over subsequent months, or a change that produced a smaller effect than expected, while there is still opportunity to reinforce or adjust it, rather than discovering the shortfall much later during an unrelated review.
Hear it from our customers

MARC ROBINSON
Director, Global Operational Excellence

“By providing a central location to input, analyse and share our KPIs, 'Data Point' enables site management to more easily focus on the entire business as a team. Its ability to allow automated data entry and trend analysis gives us more time for improvement rather than just reporting numbers. Combined with a disciplined approach within our SQDC meeting process, I believe 'Data Point' will help us continually focus on key issues and drive business excellence in all areas.”
Accelerate Continuous Improvement with Data Point
Track, measure, and optimise business performance with Data Point’s real-time insights and strategic dashboards.
