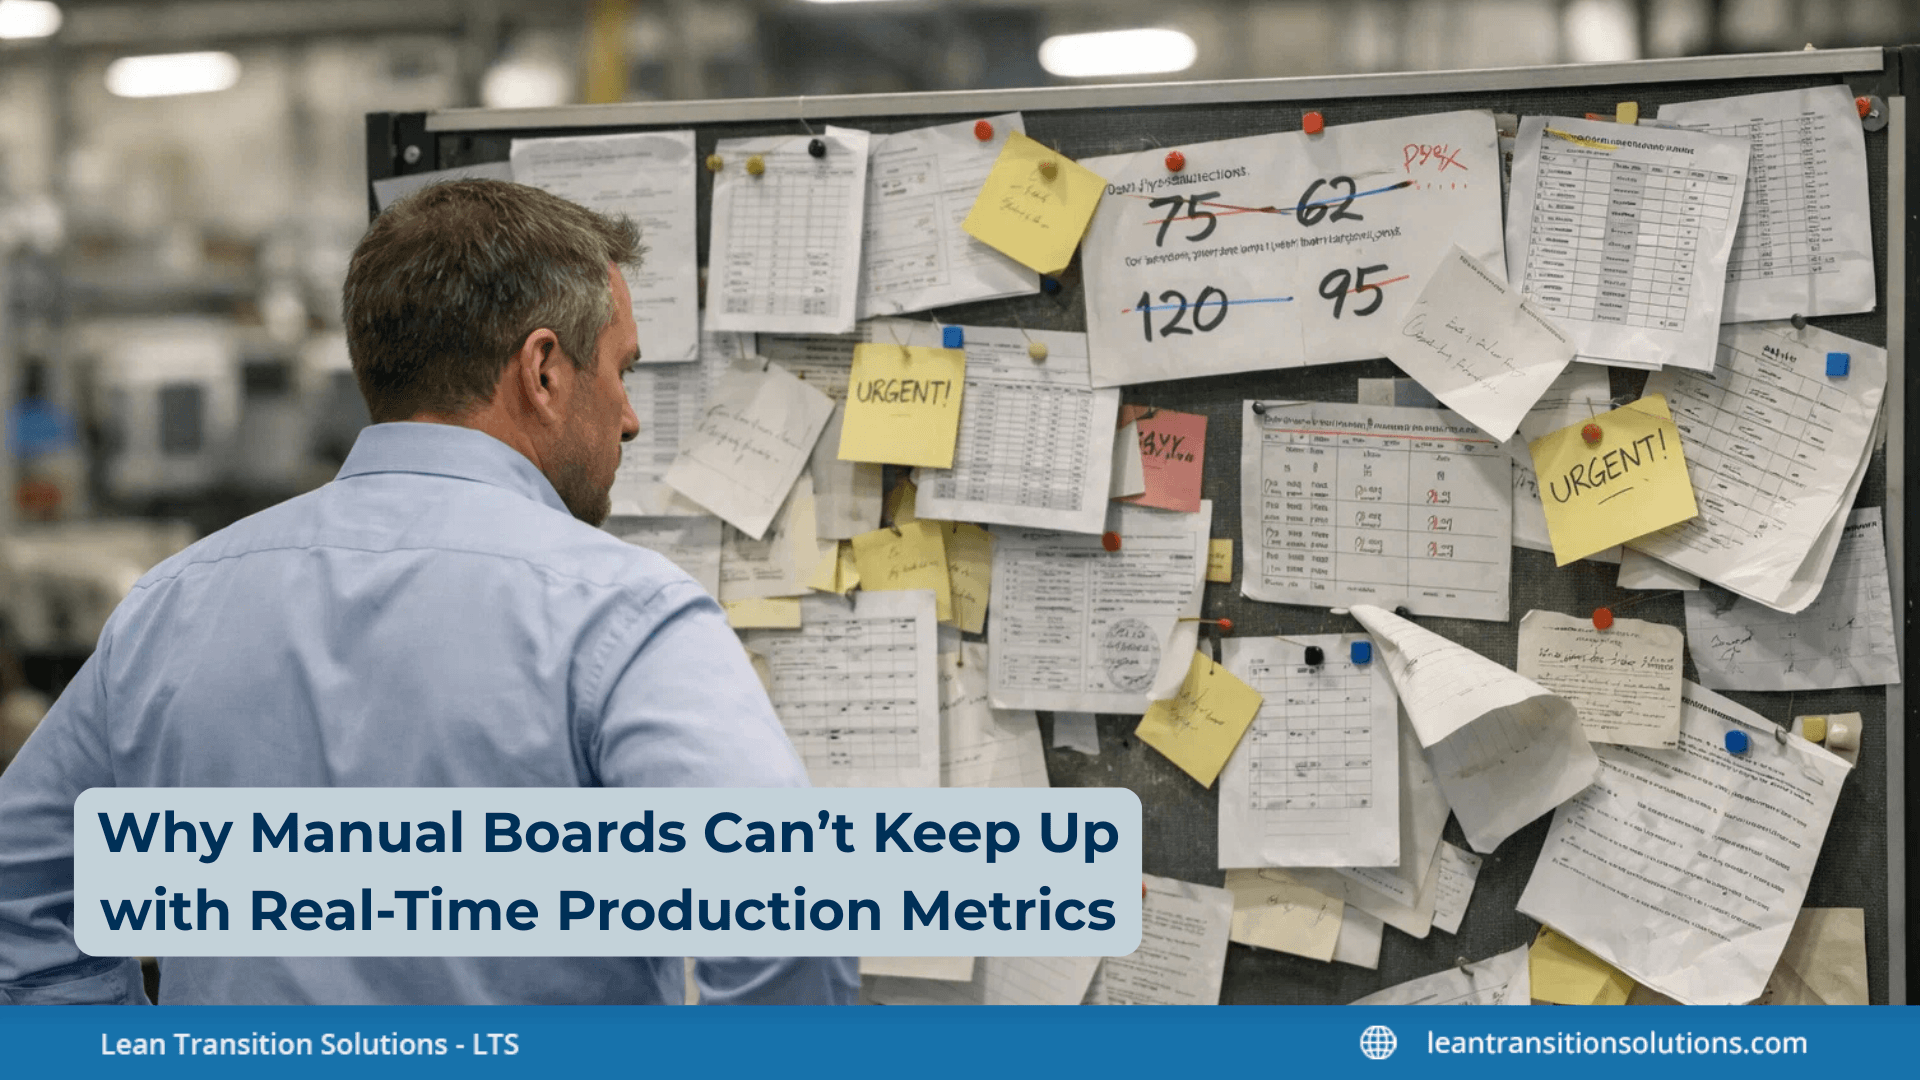
Why Manual Boards Can’t Keep Up with Real-Time Production Metrics
Last updated on : January 9, 2026
For operation managers, production metrics are meant to create clarity and allow confident decision-making. Yet when those metrics occupy manual boards, visibility is often lagged, updates rely on availability, and performance conversations are based on partial or outdated information. As operations scale and expectations for speed increase, these limitations silently undermine alignment, accountability, and response time. This blog examines why manual boards delay production metrics updates, how manual updates reduce precision of production metrics, what risks are created by inconsistent production metrics across shifts and lines, why manual boards don’t support scalable production metrics, how delayed production metrics slow decision-making on the shopfloor, how digital boards strengthen production metrics management, and what makes production metrics reliable in modern operations.
Discover how LTS Data Point digitises daily production tracking
Why manual boards delay production metrics updates
Manual boards delay production metrics updates because they depend entirely on human availability and manual effort, not real-time data flow. In fast-moving production environments, this builds an unavoidable gap between what’s happening on the shopfloor and what’s visible to teams and leaders.
In practice, lags occur because:
- Production metrics are updated at fixed intervals, not continuously (end of shift, meetings, handovers).
- Operators prefer production over documentation, pushing updates down the list.
- Reports travel slowly across shifts and lines, especially when boards are physically located.
- Corrections and rework take time, meaning errors often remain visible longer than they should.
The result is that production metrics mirror yesterday’s reality, forcing leaders to react after problems have already impacted output, quality, or delivery – rather than addressing them in the moment.
How manual updates reduce the precision of production metrics
Manual updates dilute the accuracy of production metrics because they depend on human interpretation, memory, and consistency rather than a single, authentic source of truth. Even with the best intent, manual entry introduces small errors that compound over time.
Accuracy breaks down because:
- Production metrics are recorded after the fact, increasing dependency on estimates instead of actual values.
- Data is translated multiple times (from machines, logs, or spreadsheets to boards), shooting up error risk.
- Different people interpret metrics differently, leading to inconsistent definitions and calculations.
- Updates are rushed or incomplete, especially during high-pressure periods or shift changes.
Over time, these inaccuracies destroy trust in production metrics. Teams stop leaning on numbers, discussions shift from performance to data validity, and leaders lose confidence in using metrics to lead decisions.
See if LTS Data Point fits your production environment
What risks do inconsistent production metrics create across shifts and lines?
Inconsistent production metrics across shifts and lines build confusion, misalignment, and slowed action – especially in multi-line, multi-shift functions where consistency is crucial.
Major risks include:
- Conflicting performance views: Different shifts report different numbers for the same metric.
- Broken accountability: Teams end up questioning data rather than owning outcomes.
- Ineffective handovers: Caused from incoming shifts beginning work without a clear picture of current performance.
- Missed systematic issues: Caused by inconsistencies hiding repeating troubles across lines.
- Leadership blind spots: Makes it hard to compare performance or prioritise interventions.
When production metrics aren’t consistent, trust erodes. Instead of enabling alignment and development, the metrics themselves become a source of friction – delaying decisions and weakening operational control.
Why manual boards don’t support scalable production metrics
Manual boards don’t support scalable production metrics because they are designed for small, local visibility – not for growing processes with multiple lines, shifts, and sites. As complexity increases, manual monitoring struggles to keep pace.
Scalability fragments because:
- Each new line or shift requires separate manual updates, increasing effort and inconsistency.
- Standardising production metrics across teams becomes difficult, as boards evolve differently over time.
- Consolidation is slow and error-prone, frequently requiring spreadsheets or manual summaries.
- Historical production metrics are hard to retain and analyse, limiting trend visibility.
As operations scale, manual boards become harder to maintain and tougher to interpret. Instead of assisting growth, they add friction – making it difficult for leaders to maintain a clear, consistent view of production metrics across the industry.
Explore how LTS Data Point enhances visibility across production metrics
How delayed production metrics slow decision-making on the shopfloor?
Lagged production metrics slow decision-making on the shopfloor because teams are forced to react to issues after they’ve already impacted performance, rather than addressing them as they emerge.
Decision-making slows because:
- Troubles are detected too late, often during assessments instead of in-the-moment.
- Supervisors depend on guesswork, filling gaps where up-to-date production metrics aren’t available.
- Escalations are postponed, as teams wait for verified numbers before acting.
- Corrective actions miss the window of impact, lowering their effectiveness.
When production metrics delay reality, the shopfloor shifts into a reactive mode. Instead of allowing fast, confident decisions, slowed down data increases uncertainty, hesitation, and lost opportunities to protect output, quality, and delivery.
How digital boards strengthen production metrics management
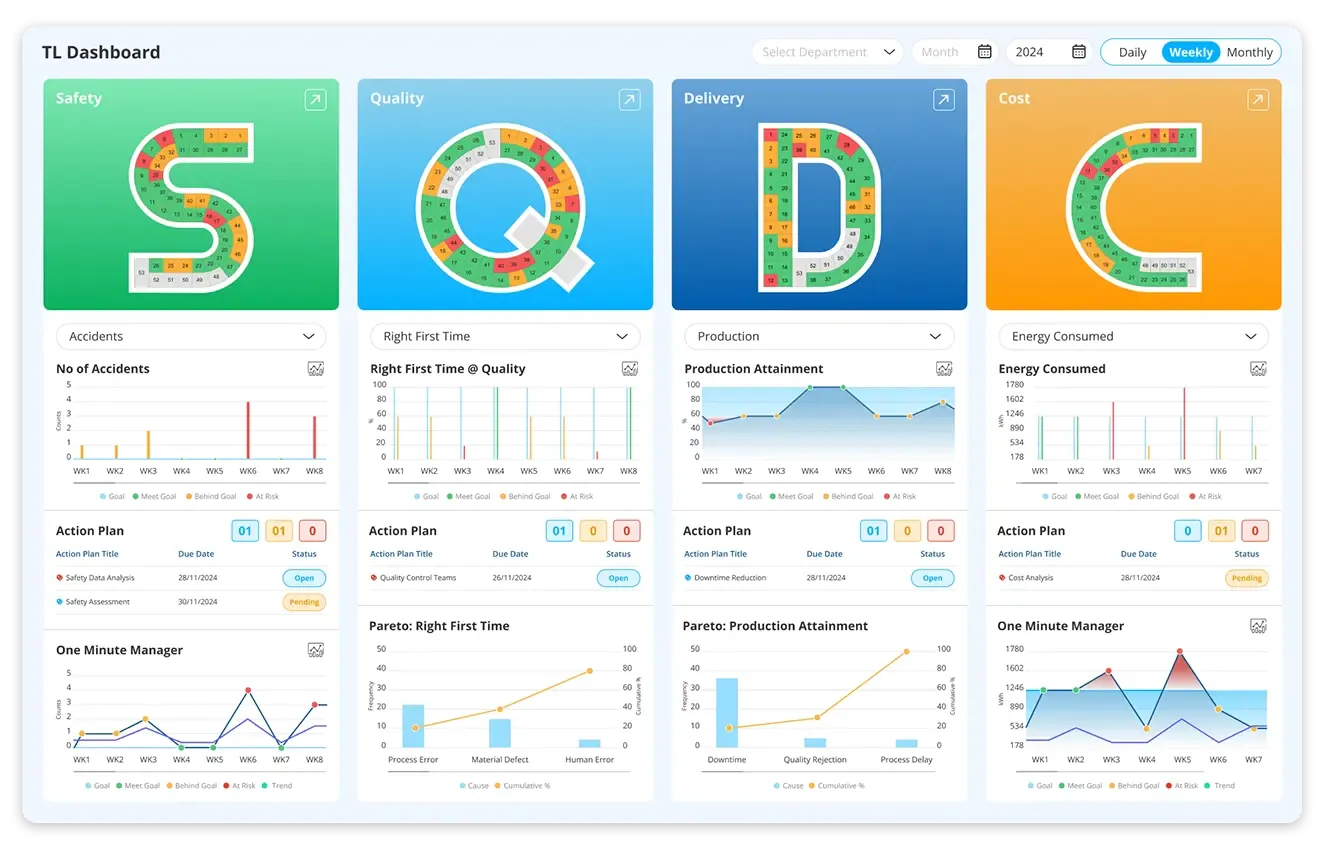
A digital board is a visual management tool that shows production metrics using connected, live data rather than manual updates. Unlike physical boards, digital boards automatically refresh as data changes, giving teams and leaders with a consistent, up-to-date view of performance across lines, shifts, and functions.
By centralising production metrics in a single, accessible view, digital boards preserve the simplicity of visual management tools while removing the delays, inconsistencies, and visibility gaps common with manual monitoring.
Key benefits or digital boards for tracking production metrics
- Live visibility into production metrics, allowing faster response to issues
- Improved accuracy through automated and standardised data capture
- Consistent metrics across shifts and lines, minimising confusion and rework
- Scalable visibility as operations grow, without additional manual effort
- Stronger alignment between shopfloor teams and leadership
- Better decision-making, driven by current information rather than historical snapshots
Manual vs. Digital: Why you must switch to digital systems to keep track on production metrics
Manual boards and digital systems both aim to make production metrics visible, but they function very differently once speed, scale, and accuracy matter.
The difference isn’t about replacing visual management – it's about reinforcing it. Digital production metrics preserve visibility while eliminating the lags and inconsistencies that restrict manual boards in modern processes.
See reliable production metrics in action with LTS Data Point
What makes production metrics reliable in modern operations
Production metrics become reliable only when they’re captured consistently, visible in real time, and assessed through disciplined daily routines. In modern processes, manual monitoring breaks this chain, resulting in delays and misalignment. Digitally allowing daily execution is what restores trust in the numbers – this is where platforms like LTS Data Point help teams maintain precision, visibility, and alignment at scale.
1. Visual management
- LTS Data Point tool: Digital performance boards
- How it supports: Production metrics are displayed visually in a live, digital format, making deviations immediately visible to teams and leaders without manual updates.
- LTS Data Point tools: Digital huddle boards, Daily performance review views
- How it supports: Production metrics are reviewed every day using the same live data, making sure problems are spotted early rather than after the shift or day ends.
3. Problem tracking and follow-up
- LTS Data Point tool: Issue management, Action management
- How it supports: When production metrics miss target, problems are recorded directly against them, with corrective actions allotted, monitored, and followed through to closure.
4. Tiered daily management
- LTS Data Point tool: Tiered performance review
- How it supports: The same production metrics flow from the shopfloor to supervisors and leadership, confirming alignment and removing multiple versions of performance data.
5. Standard work for performance reviews
- LTS Data Point tools: Fixed templates, Standard views
- How it supports: Production metrics are reviewed using consistent templates for daily reviews, shift handovers, and trends – lowering variation and enhancing reliability.
What this enables
By digitally allowing these Lean daily management tools and frameworks, LTS Data Point ensures production metrics are:
- Visible through digital visual management routines
- Reviewed daily through systematic management routines
- Acted upon through issue and action monitoring
- Aligned across levels via tiered reviews
- Sustained over time through standard work
This is how production metrics move from manual tracking to disciplined operational control – without weakening Lean principles or overstating capability.
Manual monitoring may have worked well in the past, but modern operations demand production metrics that are timely, trusted, and acted on daily. When visibility is slowed down and reviews lack structure, performance drifts. Digitally enabling how production metrics are captured, reviewed, and followed through permits teams to move from reactive firefighting to controlled execution – keeping production aligned with what the business actually needs to deliver.
Get guidance on modernising production tracking using LTS Data Point
FAQs
1. How do production metrics differ from productivity metrics?
Production metrics focus on output, throughput, and delivery against plan, while productivity metrics relate output to inputs such as labour or time. Both are connected, but production metrics answer “Are we delivering what we planned?” before asking “How efficiently?”
2. What role do production metrics play in operational risk management?
Production metrics act as early warning signals. Consistent misses, variability, or unstable trends often surface operational risks – such as capacity constraints or process drift – before they escalate into missed deliveries or customer impact.
3. What's the first sign that manual production tracking has reached its limit?
The moment leaders spend more time validating numbers than discussing performance, manual tracking has become a bottleneck rather than a control tool.
4. How often should production metrics be reviewed in a high-performing operation?
In high-performing operations, production metrics are reviewed at multiple cadences – typically per shift, daily, and weekly. The key is not frequency alone, but ensuring each review has a clear purpose, ownership, and follow-up action.
5. How do organisations ensure production metrics remain trusted as operations scale?
Trust is maintained by using single source of truth, standard definitions, and consistent review routines across sites. When teams depend on different format or calculations, confidence in production metrics erodes quickly.
6. How long does it typically take to stabilise production metrics?
Most teams begin seeing improved visibility and consistency within weeks, but stabilising behaviours – such as disciplined reviews and action follow-through – typically takes a few operational cycles to embed fully.
7. How should production metrics be adapted for different roles?
Operators need clear, immediate indicators, supervisors need trend and exception views, and leaders need aligned rollups. The same production metrics can serve all levels when presented through role-appropriate views.

Amer Jumah, Senior Lean Consultant
Amer is co-founder of Agile Solutions and a certified Six Sigma Black Belt, Lean Black Belt, and PMP, with over nine years of experience implementing Lean, Six Sigma, and Agile principles across diverse industries. He specialises in process optimisation, waste elimination, and delivering cost savings through organisational change.