How to create an effective report using the SQDCP framework?
Last updated on : February 27, 2025
In the ever-evolving landscape of performance management, it is crucial for a manufacturing firm to have the necessary tools generating accurate real-time reports. One of the most powerful tools that has appeared to support this journey is the SQCDP report which contain great insights of your manufacturing Key Performance Indicators such as Safety, Quality, Cost, Delivery, and People. These five elements offer a clear perspective of an organisation’s performance and provide key benchmarks that are directly related to organisational operations and objectives.
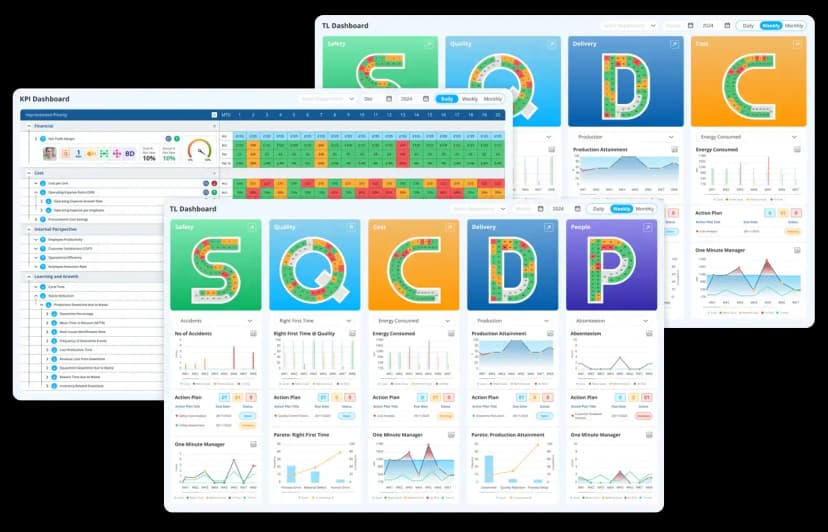
Do you know the modern way of quickly digesting these key metrics? Get a comprehensive digital SQDCP board. When combined with by the visual management tools like Balanced Scorecard, you can easily generate SQCDP overall performance report that help the teams track and analyse the problems real-time as well as get an idea of what needs to be fixed where exact.
This blog will highlight how the elements of the SQCDP report can be easily transformed into a digital environment where the Data Point Balanced Scorecard stands as the master tool for strategic planning, management, and execution.
Data Point Balanced Scorecard, being the best visual management tool provides a comprehensive solution for visualising and analysing performance metrics, particularly when managing frameworks like SQDCP and other variations such as SQDCM, SQDP, SDQI, and SQDIP.
Start using digital SQCDP boards
Let's dive into how businesses can create effective reports using the SQDCP framework.
What's in an SQCDP report?
An SQCDP framework is a structured performance tracking tool used in industries like manufacturing and operations to monitor and analyse five critical pillars of organizational success: Safety, Quality, Cost, Delivery, and People (SQCDP). The SQDCP report contains data collected from these areas that are consolidated to help teams identify issues, align priorities, and drive continuous improvement. The key elements of an SQDCP report are given below.
- Key Metrics: Major performance measures for each group, like defect rates or percentages of on-time deliveries.
- Performance Trends: Visual representations showing how performance changes over time such as using a Pareto chart to make a strong visual impact.
- Progress Indicators: A system using colors to show if targets are being met or need more attention.
- Improvement Actions: Specific steps or plans to boost performance and fix any problems.
Challenges in traditional SQCDP reporting
Traditional SQCDP reporting methods often rely on whiteboards, spreadsheets, or PowerPoint templates. Despite the effectiveness of SQCDP boards, many organisations struggle with:
- Lack of real-time data: Relying on whiteboards or spreadsheets results in delayed updates.
- Manual tracking inefficiencies: Employees spend excessive time gathering and formatting data.
- Limited customisation: Traditional SQCDP reporting methods lack flexibility to accommodate industry-specific metrics.
- Disjointed reporting tools: Standalone solutions make it difficult to integrate insights into broader strategic planning.
Why Digital SQCDP solutions outperform traditional reports
In manufacturing, the shift from paper-based or Excel-driven SQCDP reporting to digital solutions isn’t just a trend, it’s a necessity. While traditional reports rely on manual inputs and static snapshots, digital SQCDP tools transform raw data into actionable insights, empowering teams to act faster, collaborate smarter, and drive continuous improvement. If you're looking to enhance visual management and structured problem-solving, a digital SQCDP board can provide clarity. Learn how to use it effectively in our detailed guide -How do you use a SQCDP board?
Let’s explore why digital SQCDP solutions consistently outperform manual methods and how they can revolutionise your operational efficiency.
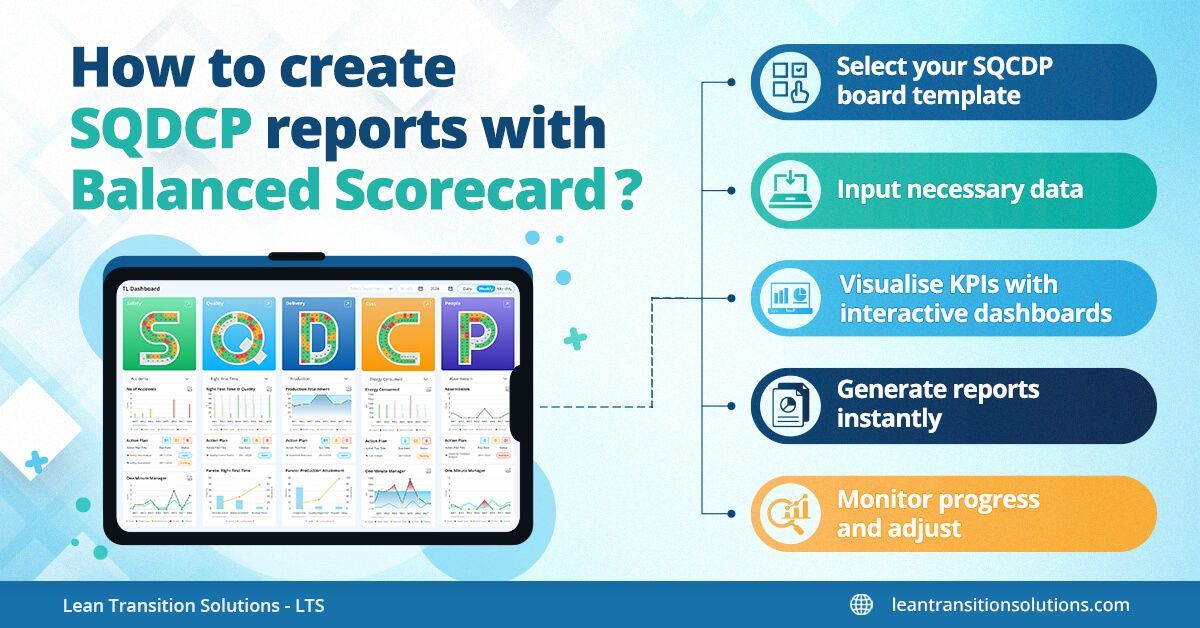
What’s the best way to generate SQCDP reports using digital boards?
1. Select your SQCDP board template
Begin with selecting the appropriate digital SQDCP board template that fits your operational needs. Choosing a digital SQDCP board is the best action. Select the digital platforms that provide a variety of templates that can be easily customised. Make sure that it can track all relevant metrics for specific report making.
2. Input necessary data
Once you have set up your board, start filling it with relevant data. Whether you are tracking production progress, employee engagement, or operational costs, your SQCDP board should reflect real-time information.
Define key metrics for your SQCD report
→ Safety (S) – Number of incidents, near-misses, compliance with safety protocols.
→ Quality (Q) – Defect rates, customer complaints, adherence to quality standards.
→ Cost (C) – Production costs, budget variance, cost-saving initiatives.
→ Delivery (D) – On-time delivery rates, production cycle time, order fulfillment.
→ People (P) – Employee engagement, absenteeism, training completion rates.
3. Visualise KPIs with interactive dashboards
Use viusalisation tools to convert your SQCDP boards into dynamic dashboards. It can take all KPIs and render them into visual formats like bar charts, pie charts, or trend lines, making data actionable and interpretable.
4. Generate reports instantly
You can automatically generate SQDC reports in formats that are suitable for you, such as a PowerPoint to present commercially or a deep PDF report to review internally. Reporting thus becomes much faster and more consistent.
5. Monitor progress and adjust
Once your SQCDP report is generated, use it to evaluate performance and spot areas for improvement. The interactive feature of digital boards allows you to change the parameters in real time, making it easier to hone strategies and track progress over time.
Why is an SQCDP report crucial for your business?
- Make the team equipped with relevant information that allows them to make strategic decisions.
- Recognise emerging opportunities that contribute to marketing advantages.
- Make performance better by identifying bottlenecks and areas for improvement.
- Focus on quick delivery time, quality, and service that build customer loyalty.
- Provide corrective actions results in cost-effective solutions and enhances revenue.
Transform your manufacturing reporting with Data Point’s digital SQDCP boards
Are you still using outdated methods to analyse your SQCDP performance? Without the right tools to track and analyse these metrics in real time the full potential of SQCDP reports remains untapped. Try digital SQDCP board of Data Point Balanced Scorecard and transform your operations with automated, data-driven reports. The software integrates seamlessly with your existing data systems, ensuring that your reports are continuously updated, automatically generated, and ready for action when you need them.
Here’s how Data Point’s SQDCP solutions improves your operational excellence:
- Automated Data Collection – Eliminates manual input errors and saves time.
- Real-Time Performance Tracking – Ensures accurate and up-to-date reporting.
- Customisable Dashboards – Allows teams to tailor views to specific needs.
- Integration with ERP & MES Systems – Connects performance tracking with broader operational data.
- Daily Huddle Board Functionality – Supports team discussions and quick decision-making.
Want Smarter, Faster Reporting?
FAQs
1. What is Digital SQCDP?
Digital SQCDP is a real-time framework for tracking Safety, Quality, Cost, Delivery, and People metrics.
2. How does Digital SQCDP improve efficiency?
By providing real-time dashboards, automated alerts, and predictive analytics, it helps teams respond to issues faster.
3. Why is the SQCDP framework important for manufacturing reporting?
SQCDP framework helps manufacturers identify issues quickly, streamline operations, and drive data-driven decision-making for better efficiency and performance.
4. What are the limitations of a manual SQCDP template?
Traditional SQCDP templates are prone to errors, time-consuming to update, and lack real-time data. With the help of digital SQDCP boards, overcome the limitations like outdated information and delayed decision making.