SQCDP Board Visual Management Software for Lean Daily Management
Bring Safety, Quality, Cost, Delivery and People into one connected daily-management view. See what is off track, focus the huddle and turn issues into owned action.
- Real-Time SQCDP Visibility with AI
- Faster, Focused Daily Huddles
- Clear Action Ownership
- Configurable to Your Operation
- ERP, MES & System Integration
- Built for Multi-Site Scale
Trusted by industry leaders and Fortune 500 companies


















What is SQCDP?
A visual daily management method built around five operational priorities.
SQCDP stands for Safety, Quality, Cost, Delivery and People. It gives frontline teams a common structure for reviewing today’s operation, identifying abnormalities quickly and deciding what needs action or escalation. Data Point digitises that rhythm without turning it into another reporting dashboard.
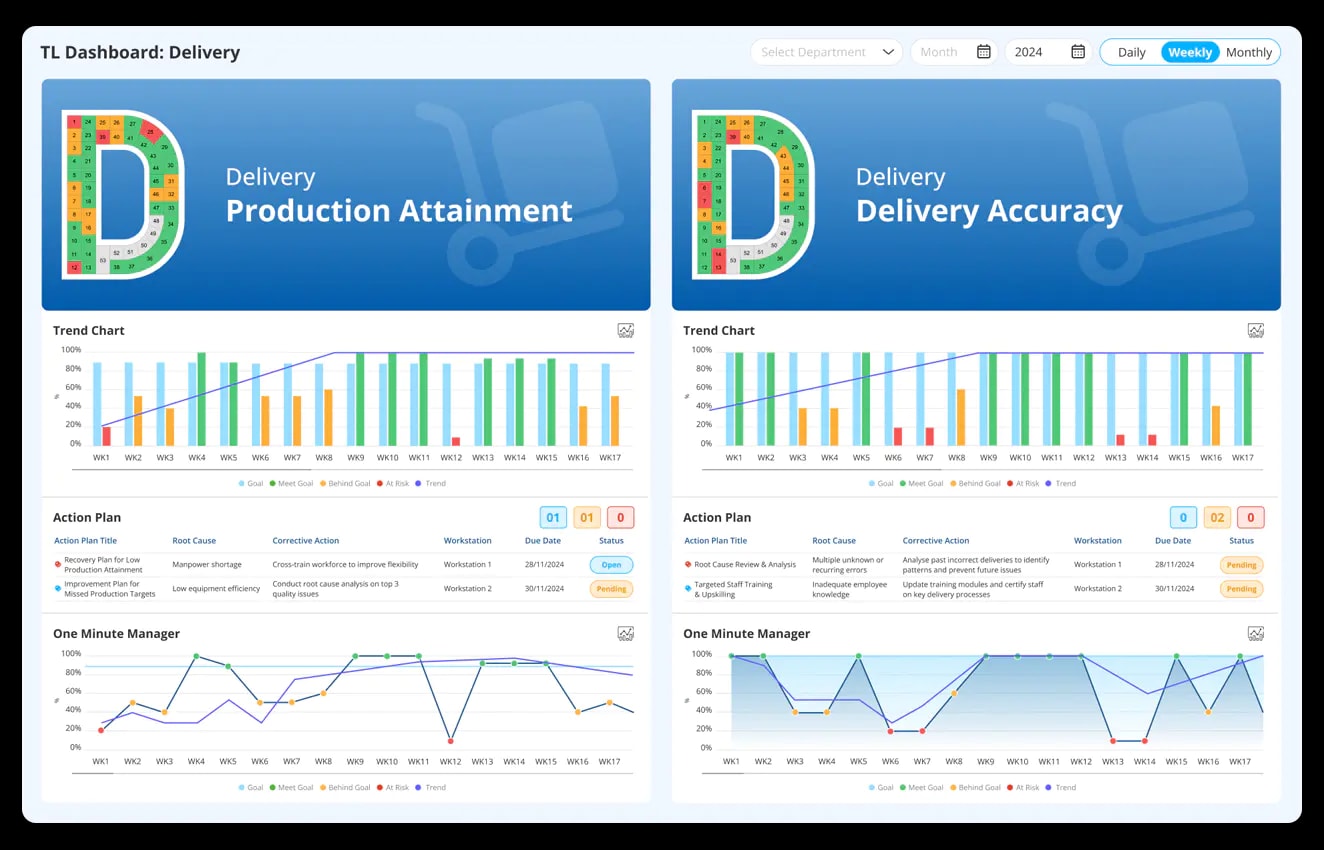
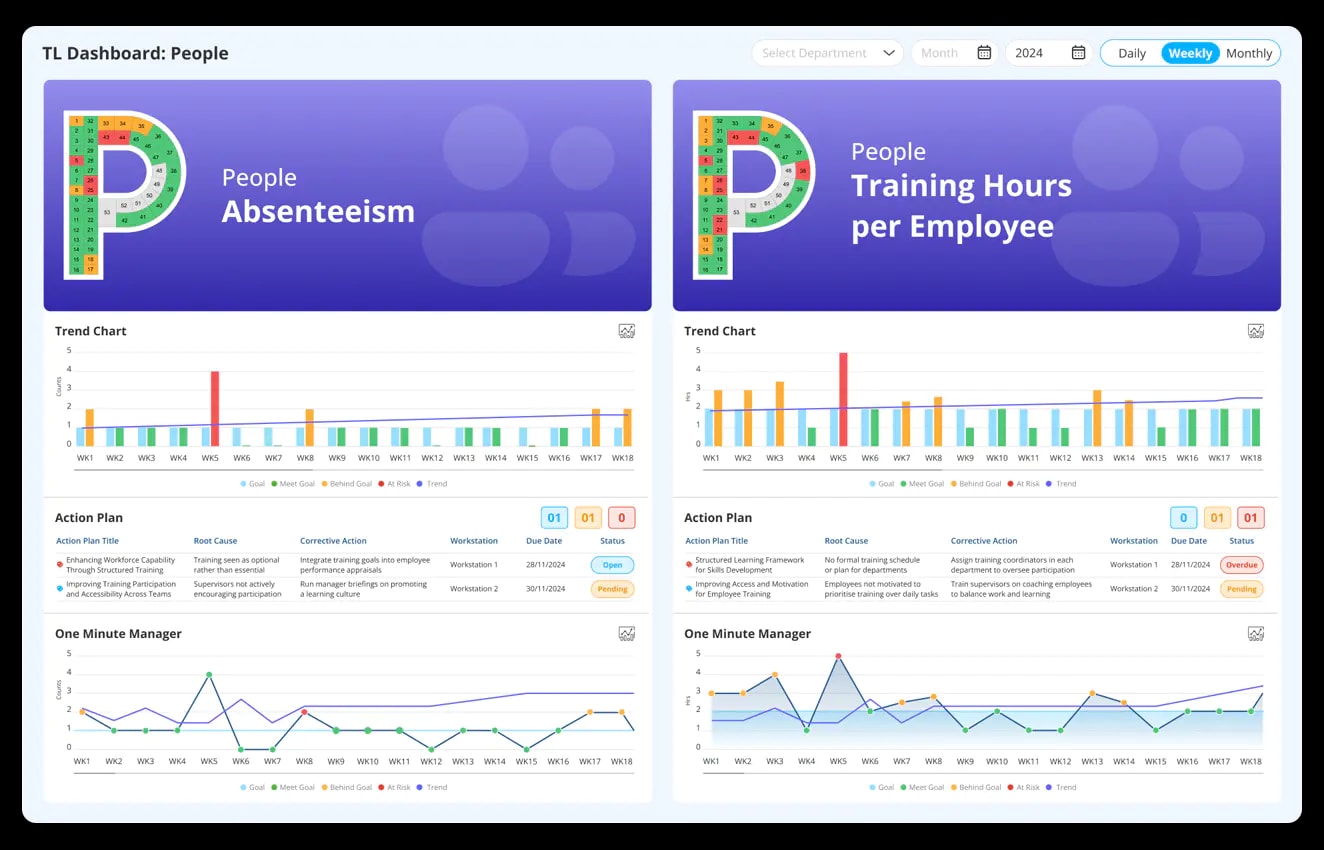
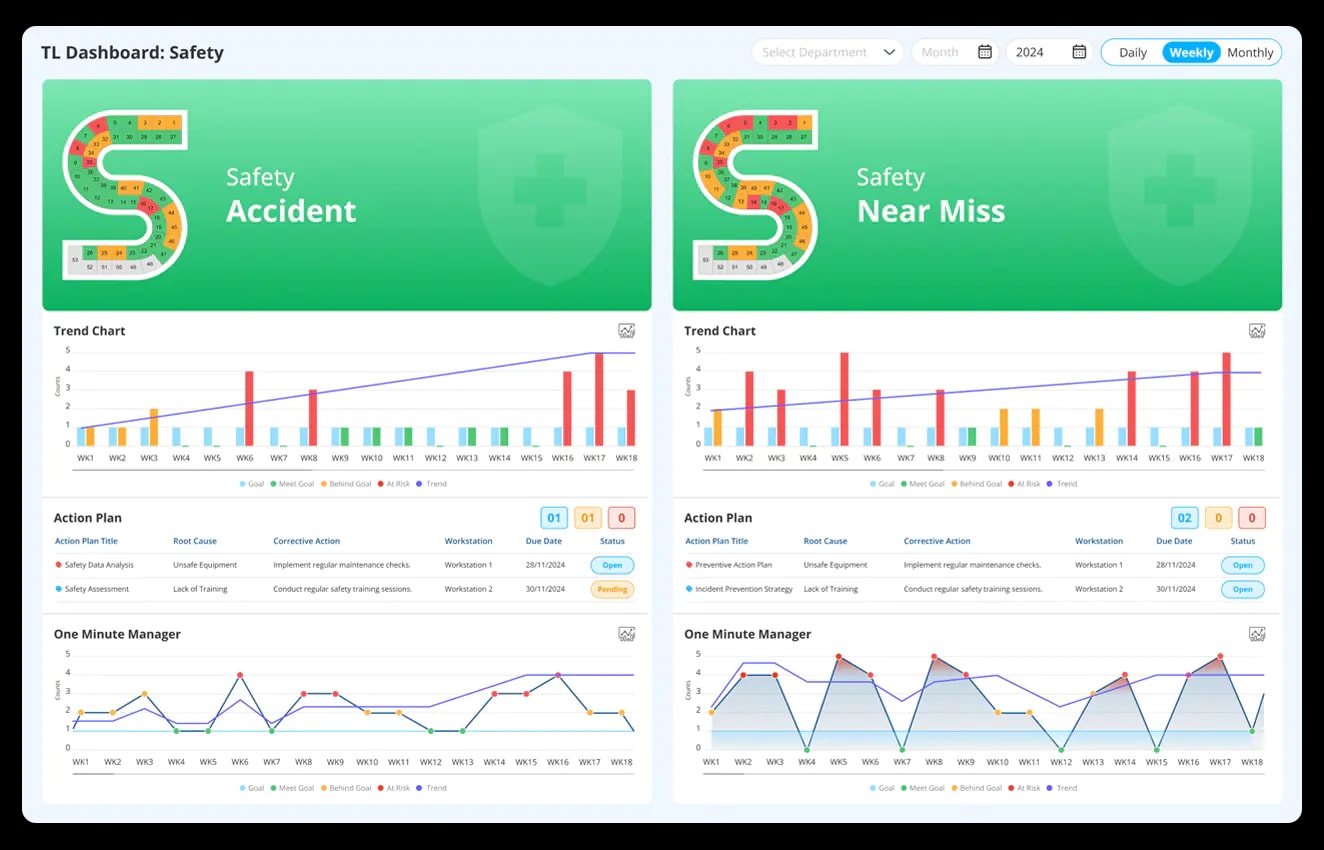
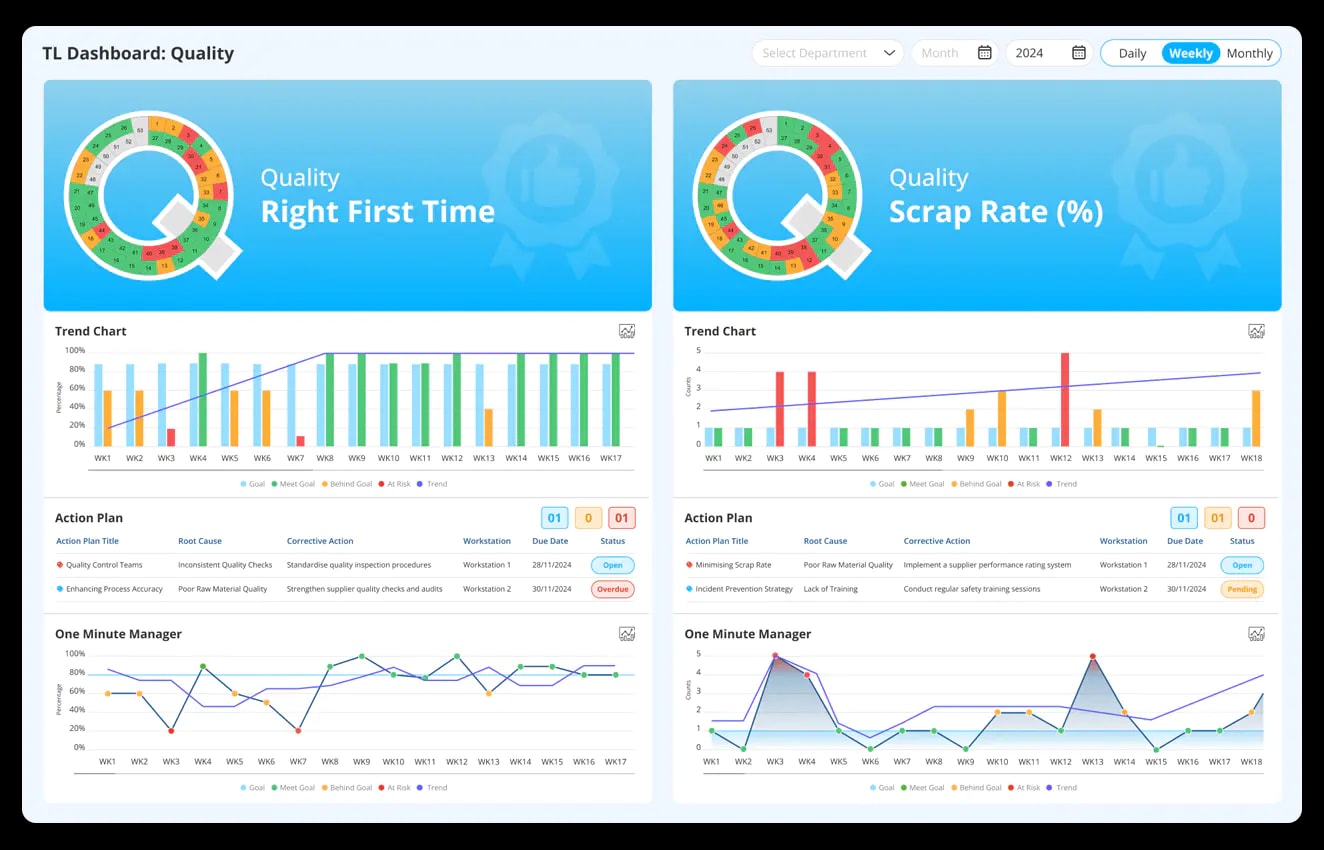
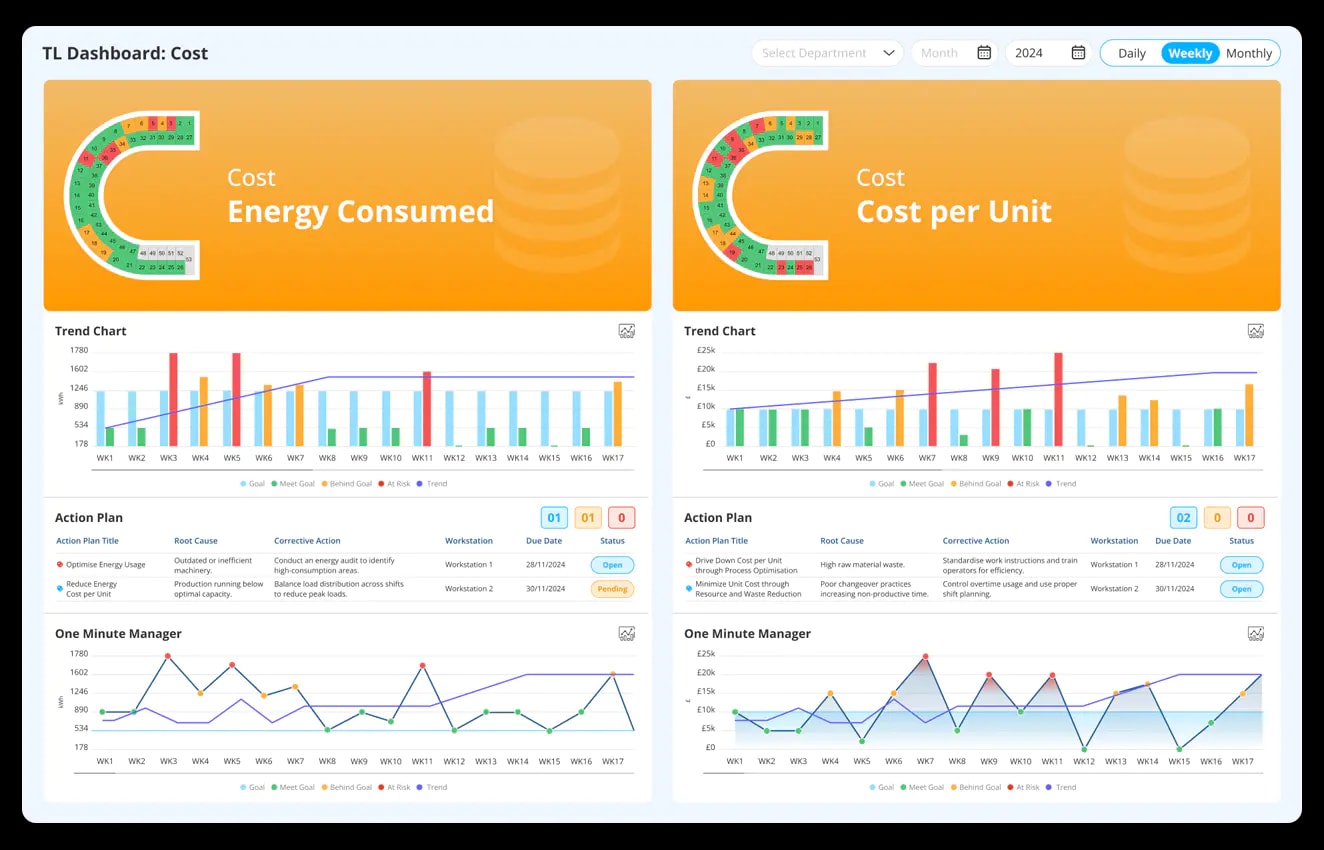
See safety risks before they become incidents.
IncidentNear MissRecordablesStop Cards
Inside the SQCDP Dashboard
From Daily KPIs to Corrective Actions. All in One SQCDP Software.
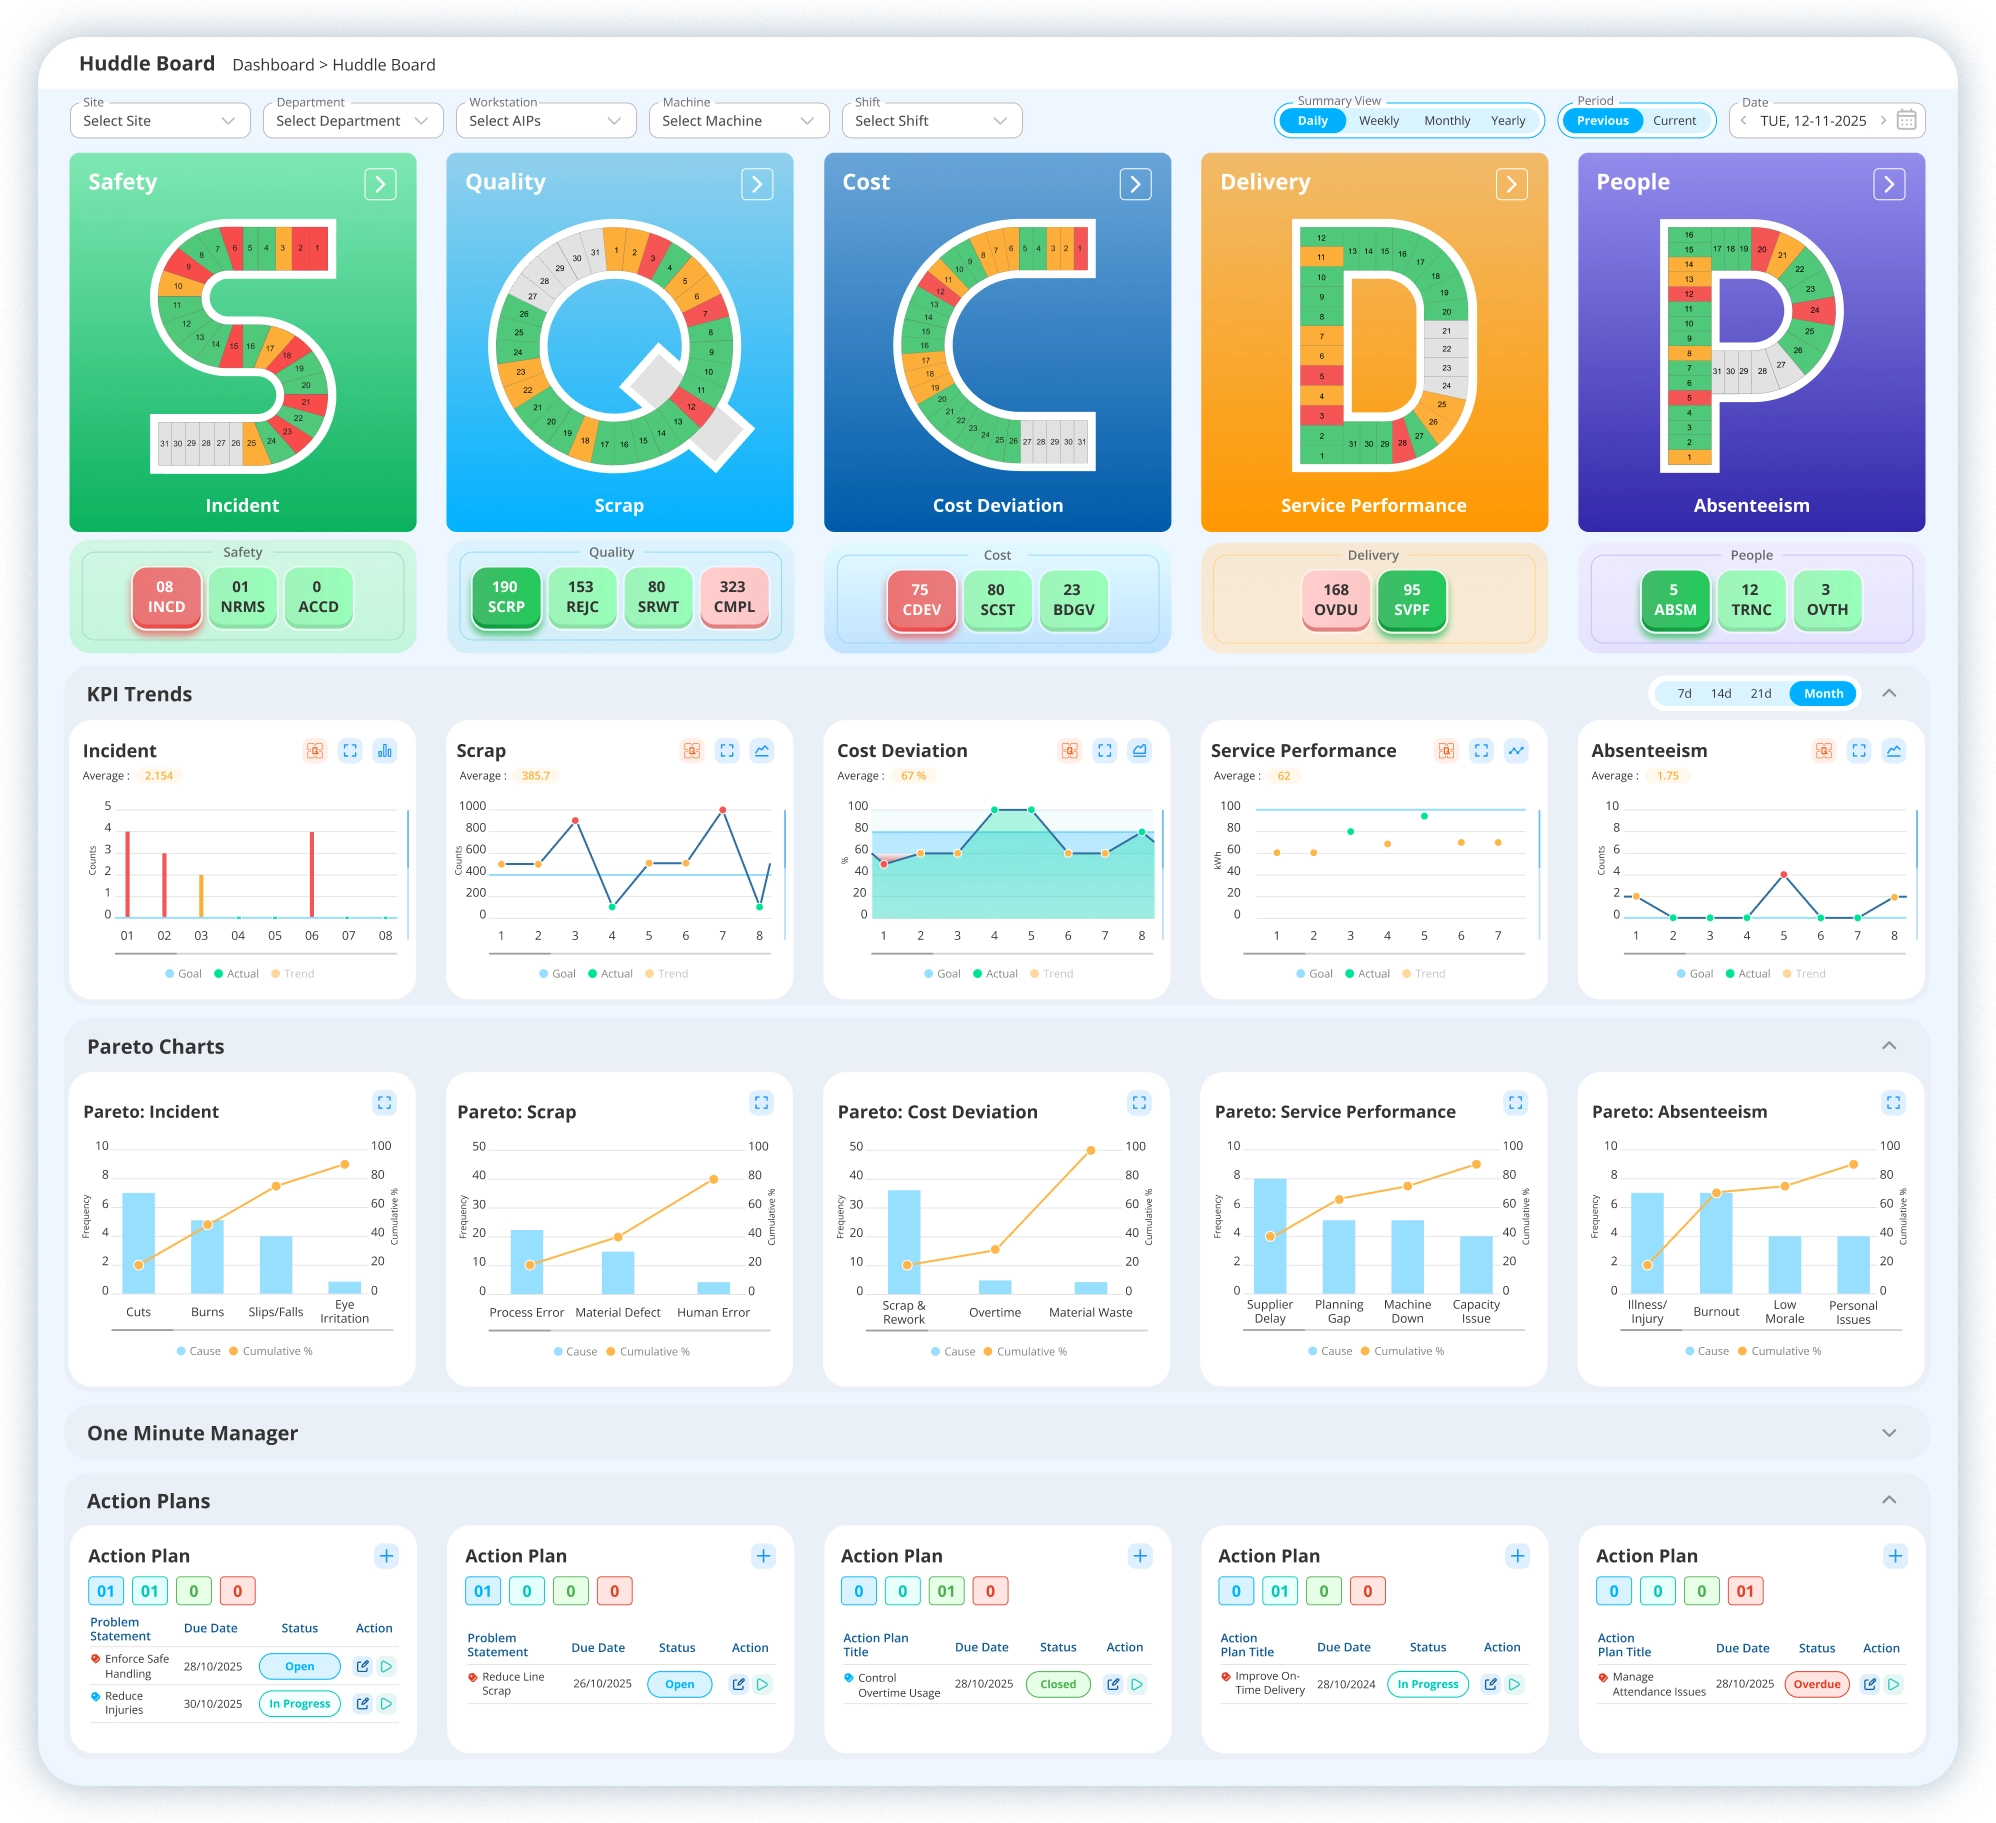
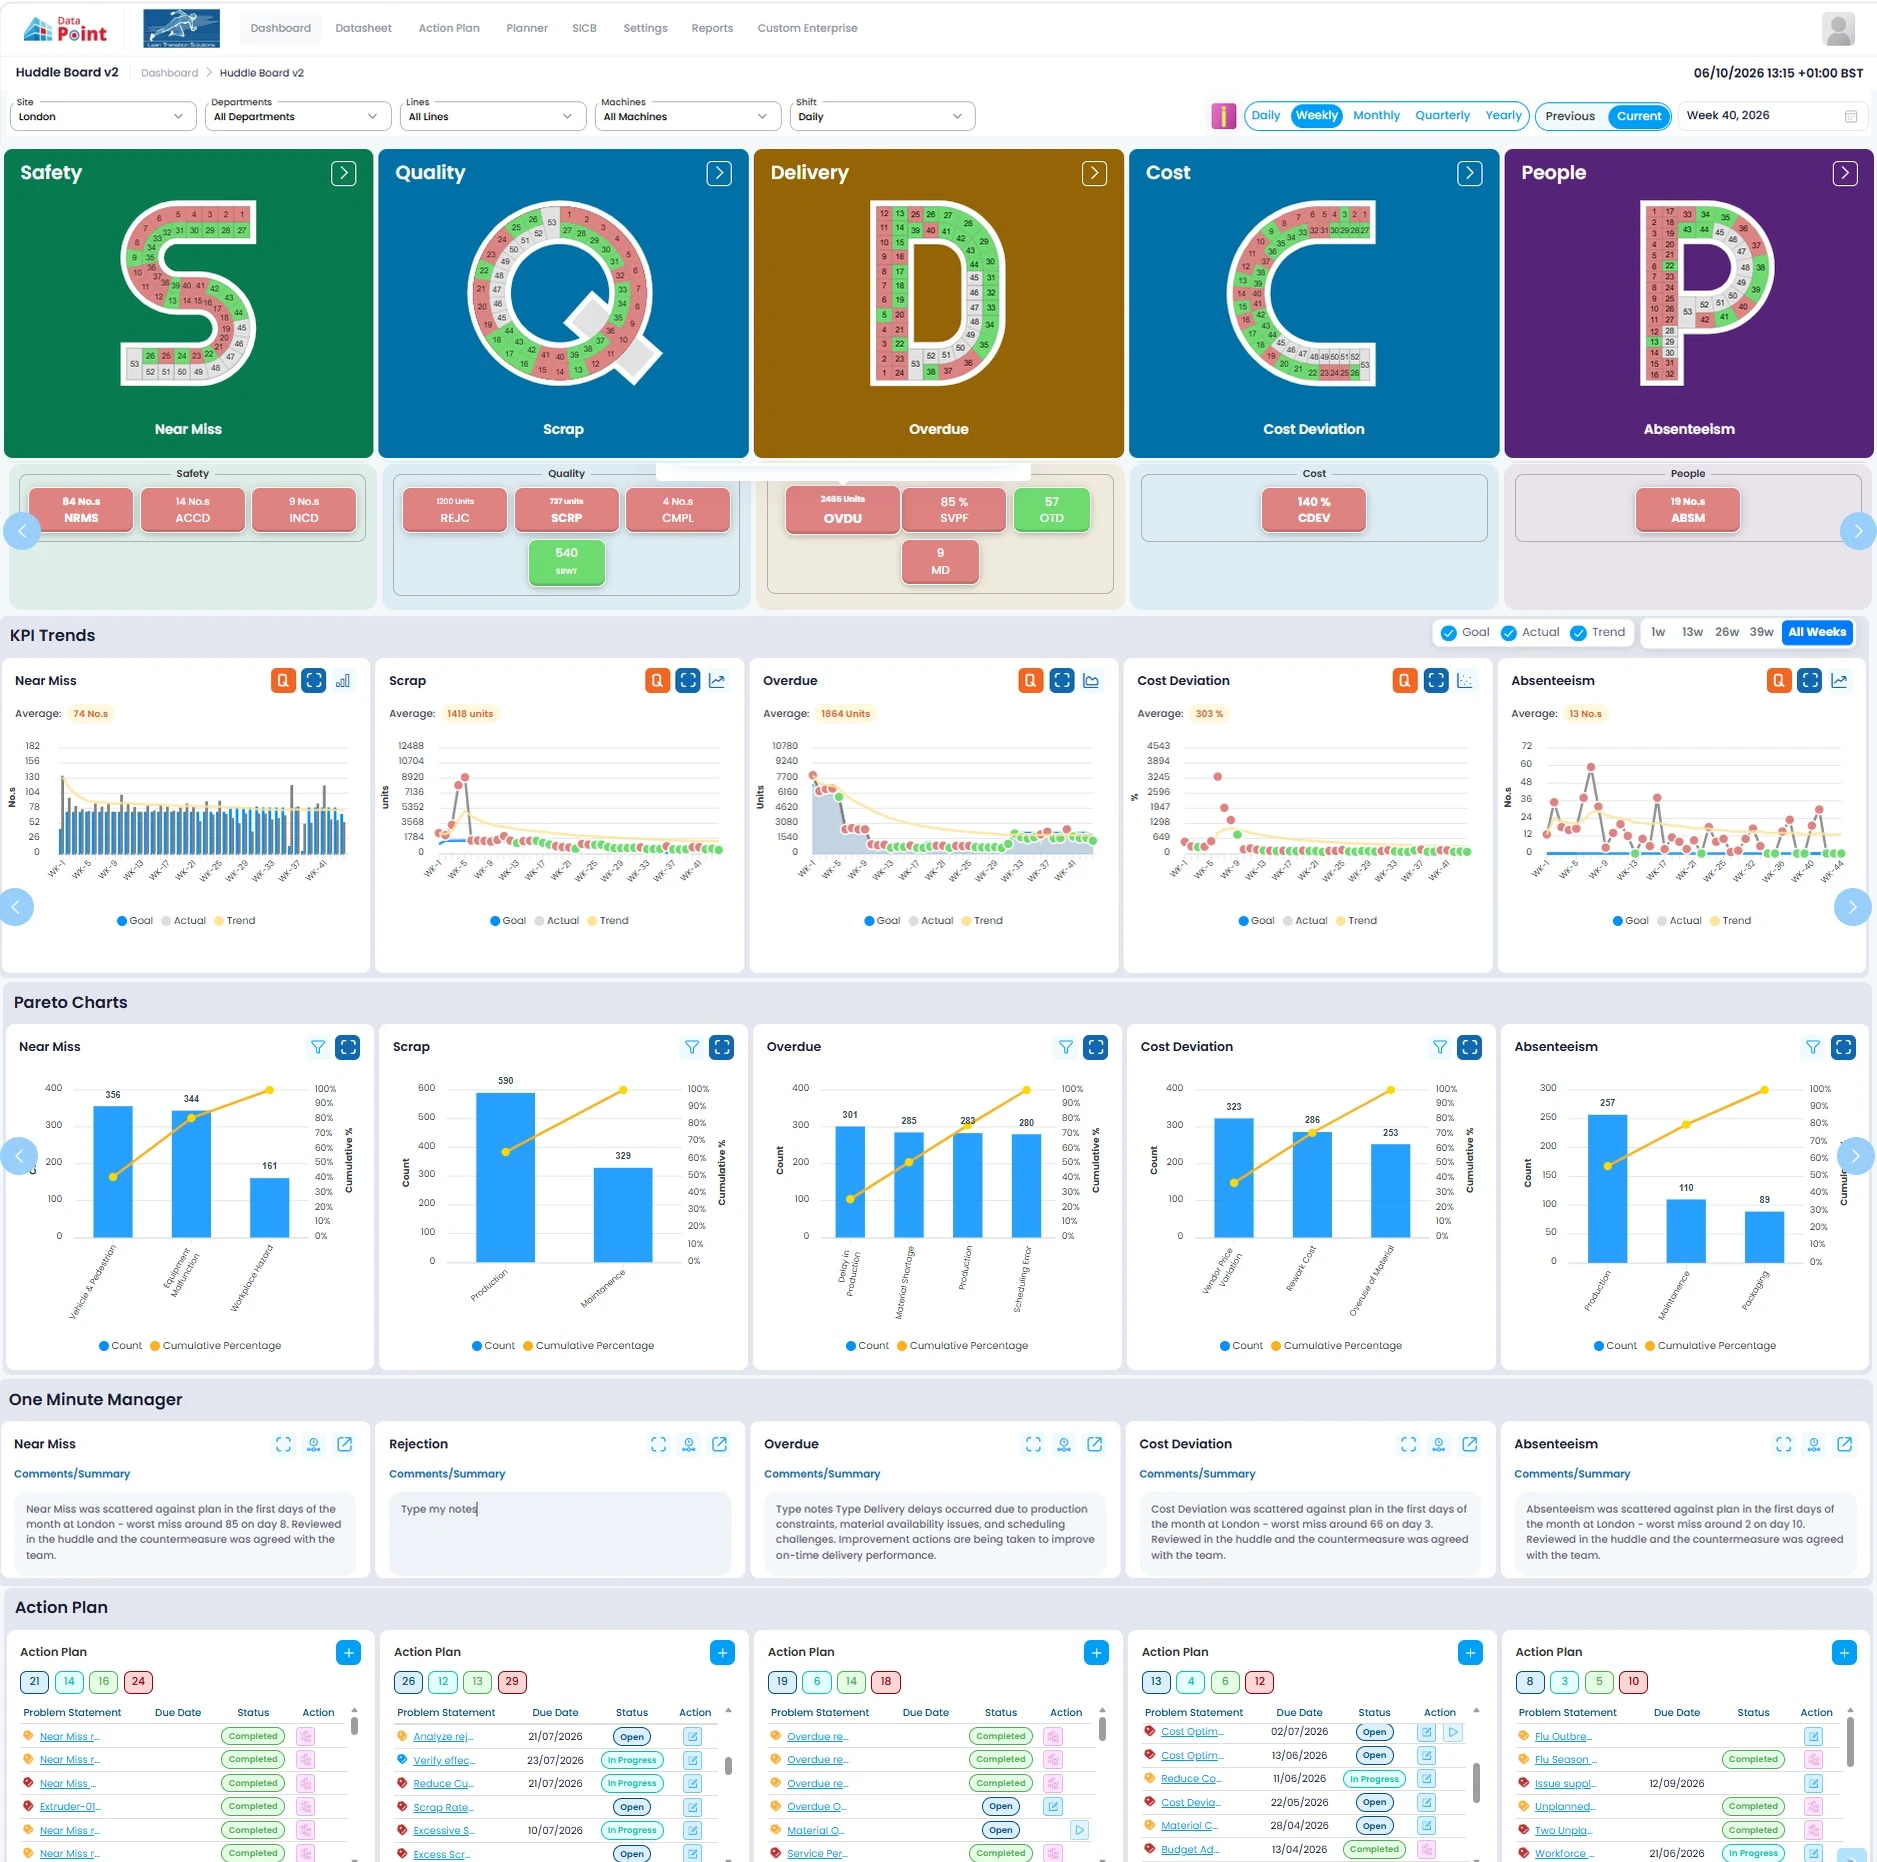
Explore the SQCDP dashboard example in action, with a closer look at how KPI drill-downs, performance trends, manager insights, corrective actions and AI-powered intelligence support smarter Lean Daily Management.
01Start with the operational context
Set exactly what the huddle is reviewing.
Select site, department, line, machine and shift, then switch between Daily, Weekly, Monthly, Quarterly and Yearly views. Compare previous/current periods or jump directly to a date.
Hierarchy · Cadence · Period · Date

02Read the SQCDP status
See the five operational priorities at a glance.
Safety, Quality, Delivery, Cost and People give the team immediate visual status before the huddle moves into individual measures or deeper analysis.
Safety · Quality · Delivery · Cost · People

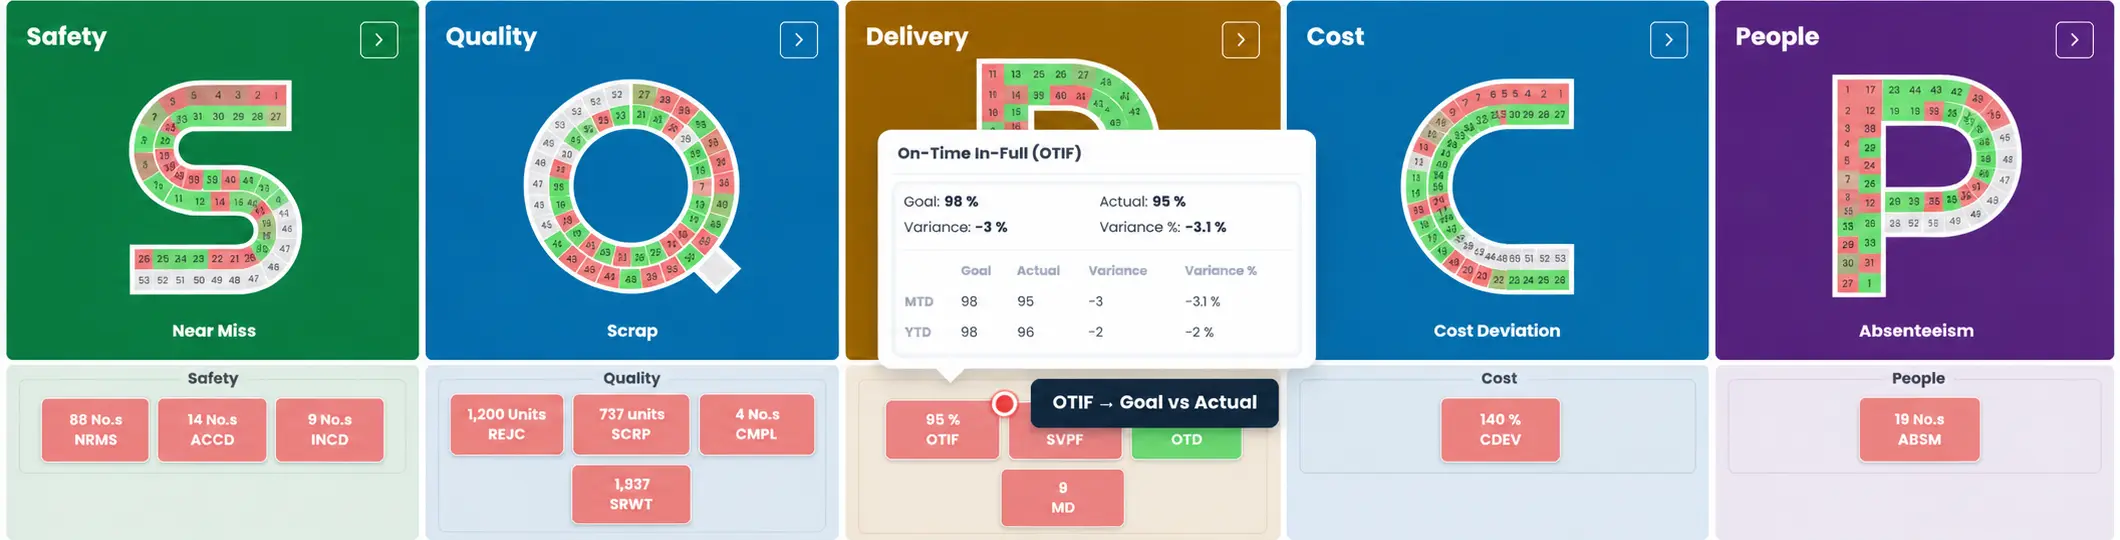
03Check the supporting metrics
Move from the pillar to the measures driving its status.
Each pillar carries its vital metrics underneath. Hover a metric to reveal Goal versus Actual and variance without leaving the board — giving the team immediate context before drilling deeper.
Metric · Goal · Actual · Variance
04Open the KPI drill-down
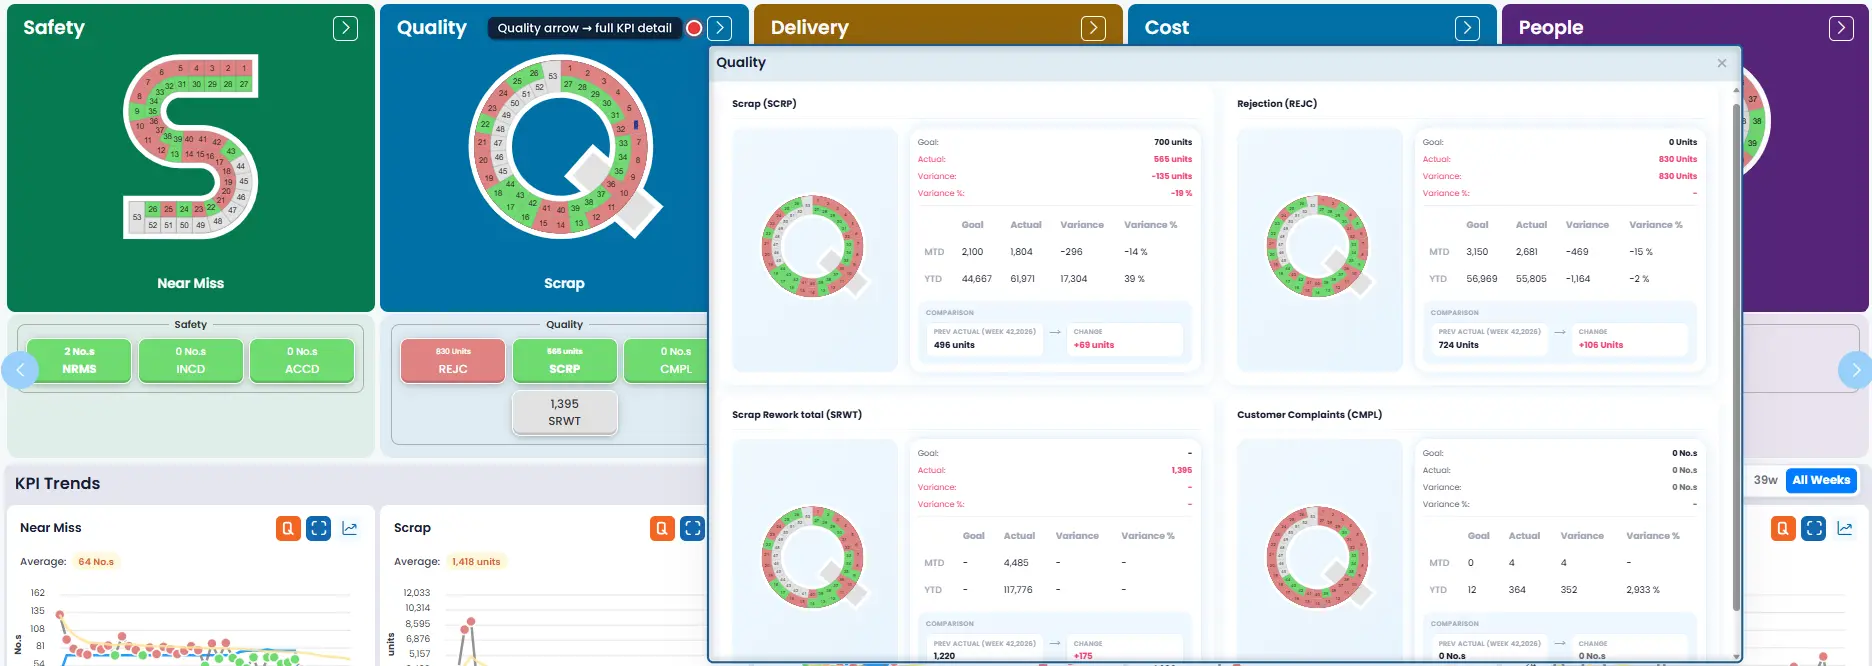
Use the pillar arrow to open the full metric story.
From the Quality or other pillar arrow, open the detailed KPI view for the selected pillar. Goal, actual, variance, MTD/YTD performance and comparison data remain tied to the same SQCDP context.
Pillar drill-down · MTD · YTD · Comparison
05Follow the KPI trend
See whether the problem is isolated or becoming a pattern.
Trend views keep Goal, Actual and Trend visible together, with selectable time windows and multiple chart or graph formats for the metric being reviewed.
Goal · Actual · Trend · Chart views · Time window

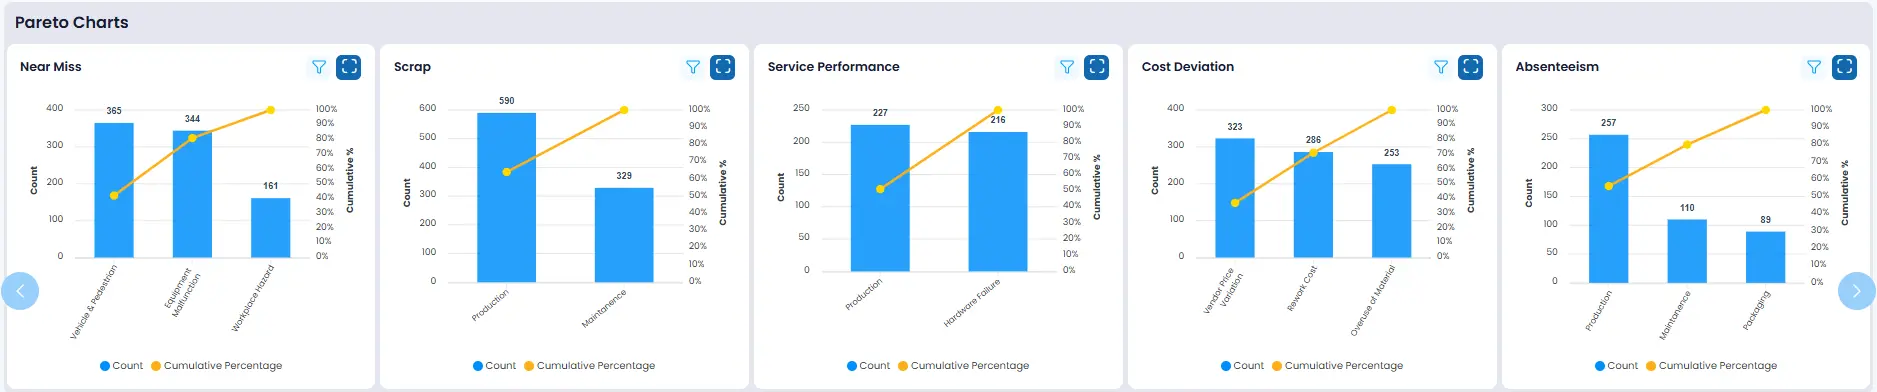
06Prioritise with Pareto
Focus improvement effort on the causes that matter most.
Pareto exposes the dominant contributors behind each metric. Teams can filter the view or expand the chart for a clearer cause-level discussion.
Filter · Full chart · Cause concentration
07Keep the management context
Capture what happened and what the team agreed.
One Minute Manager keeps comments and summaries beside the KPI so the next review starts with operational context, not just a number.
Comments · Summary · Context · Follow-up

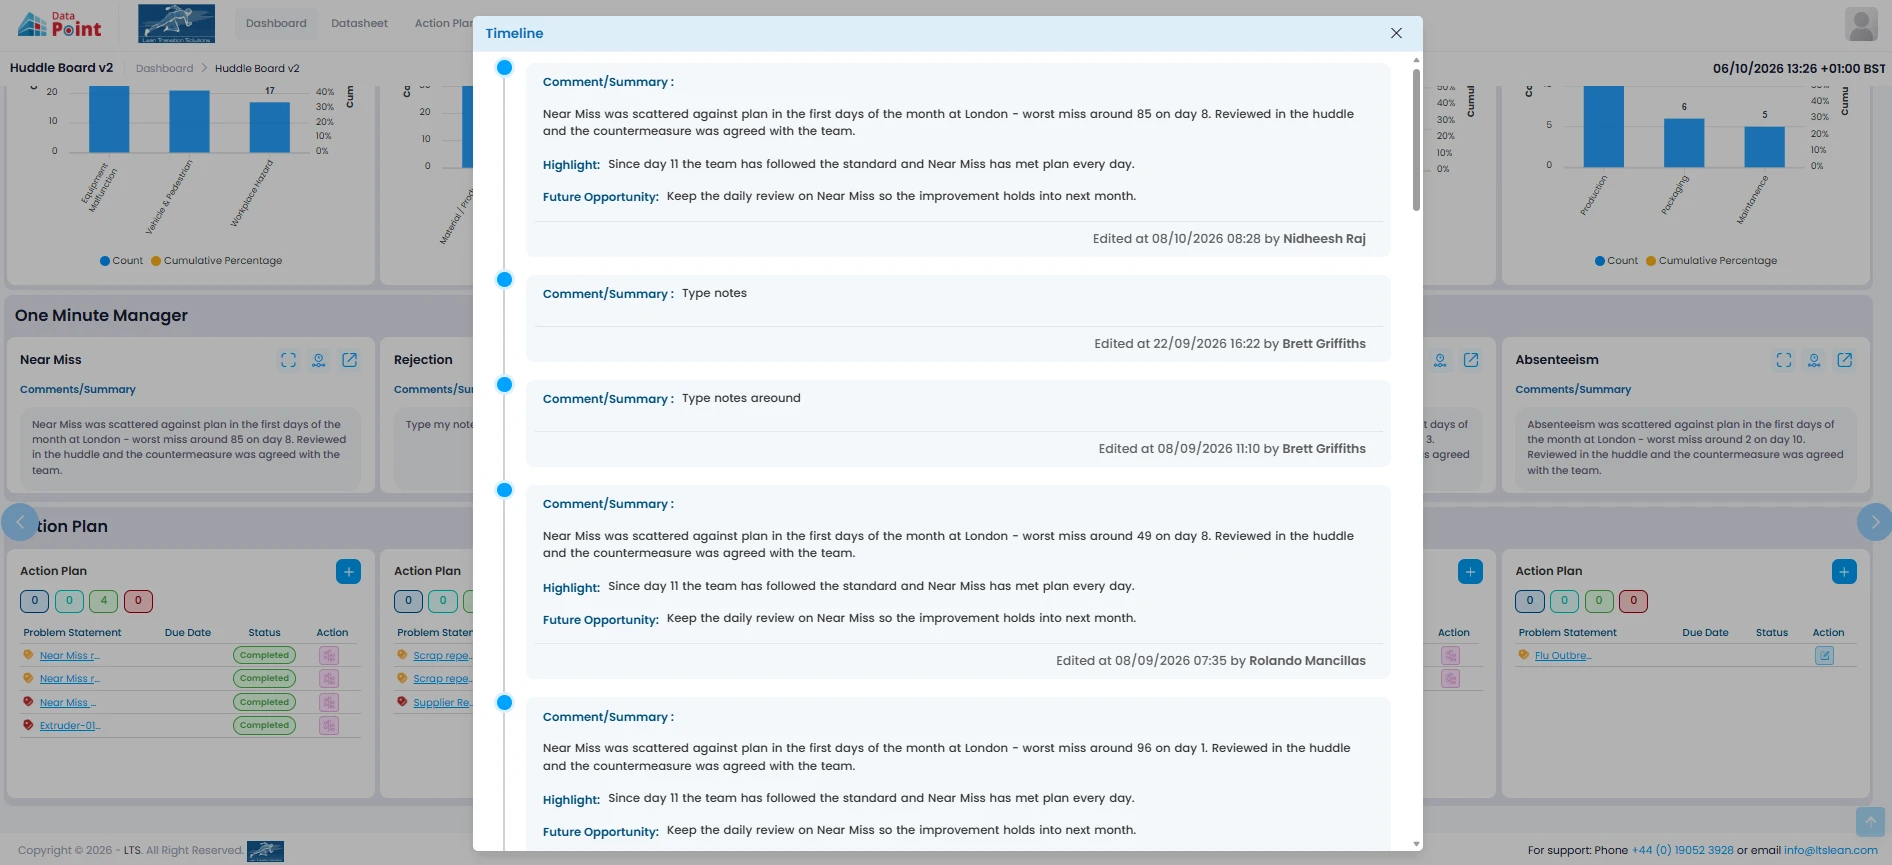
08Open the One-Minute Manager timeline
Trace the conversation across previous reviews.
Use the timeline icon inside One Minute Manager to reveal historical comments, highlights, future opportunities, edit dates and contributors without losing the board context.
Timeline · Highlights · Future opportunity · Audit trail
09Turn the issue into owned action
Keep every countermeasure visible through to closure.
Action Plans connect each problem statement to due date and status. Open, in-progress and completed actions remain visible within the same daily-management rhythm.
Problem statement · Due date · Status · Closure

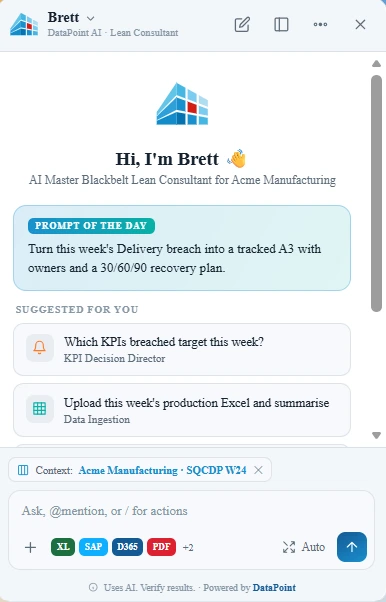
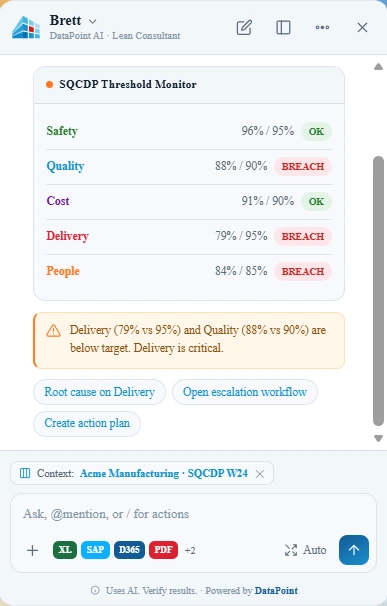
10Ask Data Point AI
Turn live operational context into an intelligent conversation.
Open Data Point AI from the board to work with an AI Master Blackbelt Lean Consultant that understands the current operational context. Chat with the operation, analyse performance, anticipate risk and recommend practical next actions.
Chat · Analyse · Predict · Recommend
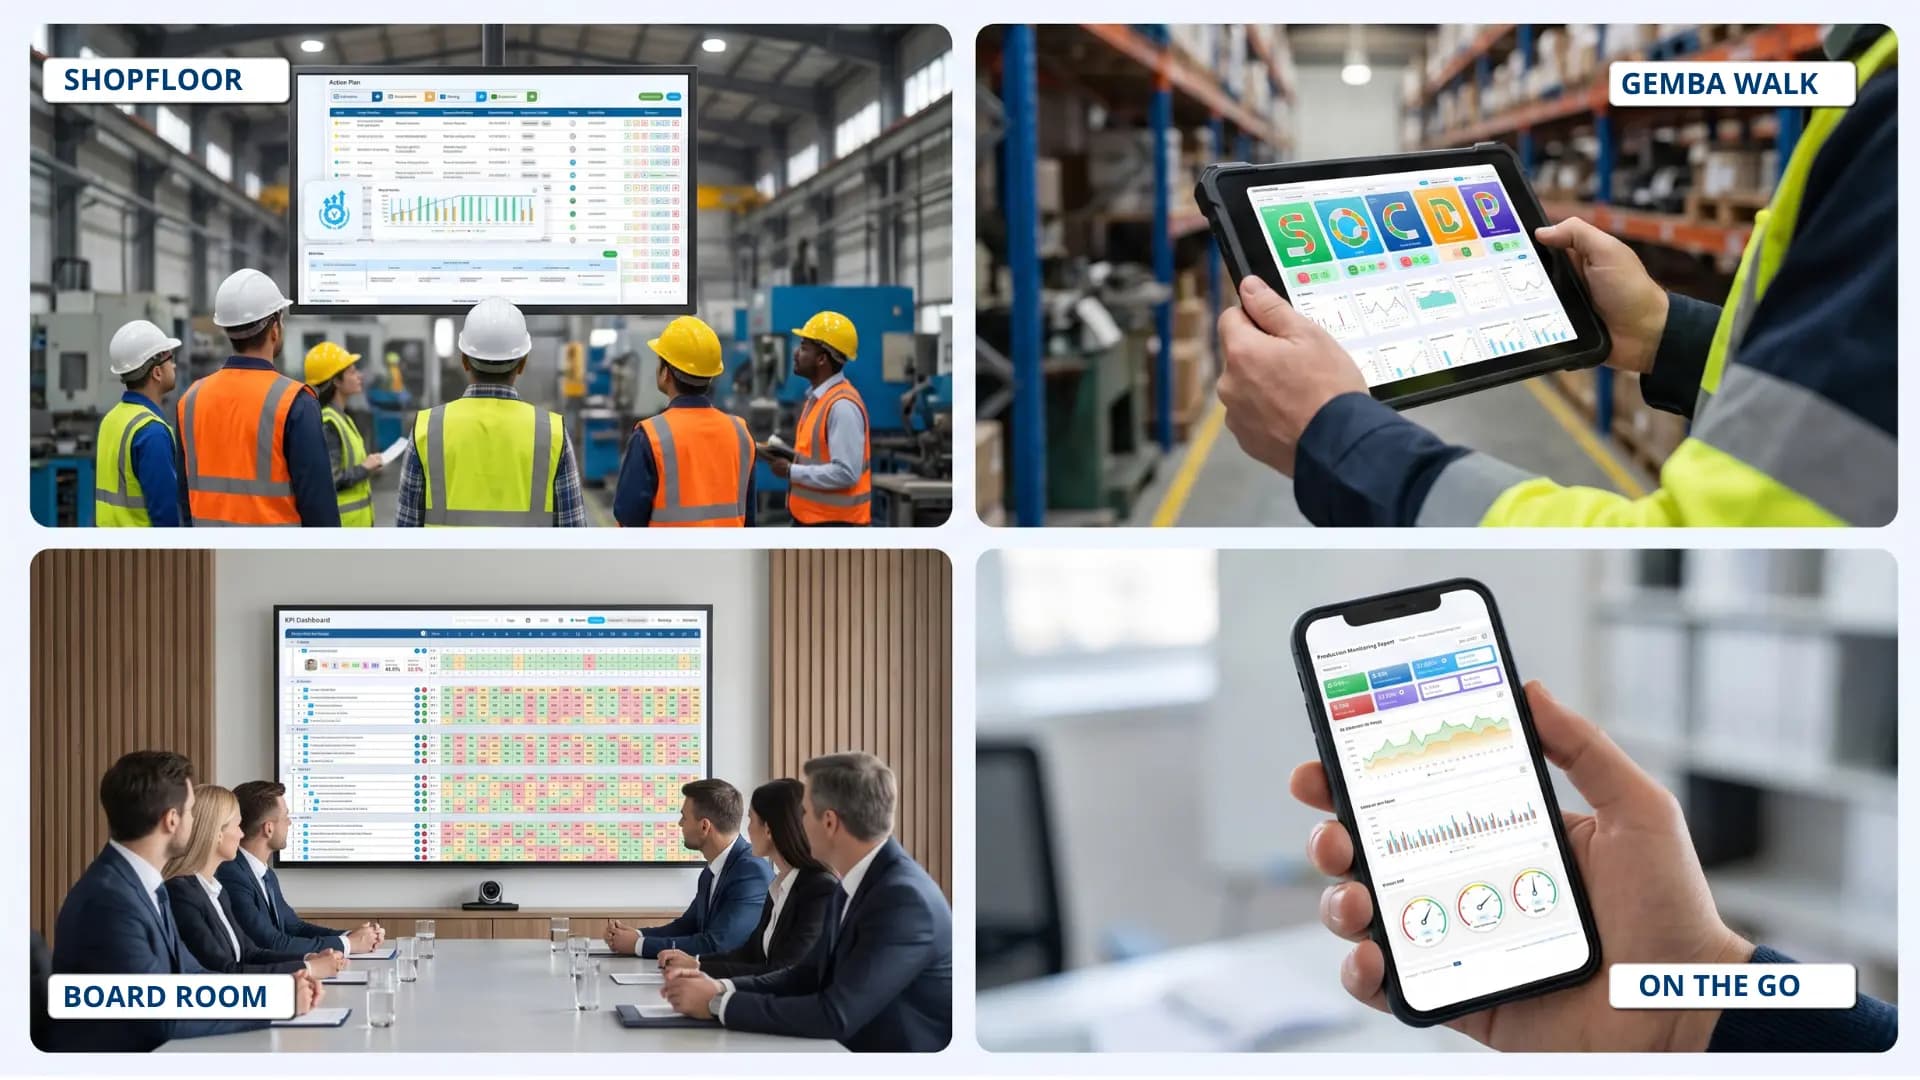
Putting SQCDP into practice
How Do You Get More Value from a Digital SQDCP Board?
A digital SQCDP board should do more than display Safety, Quality, Cost, Delivery and People KPIs on a screen. The real value comes when live operational data, the way teams manage performance and continuous improvement are connected in one daily management environment. See how Data Point brings these elements together.
Connect
Integrate the systems you already use.
Bring operational data into Data Point from ERP, MES, Excel, Power BI, APIs and other production systems. Create one connected view of performance without relying on manual updates or disconnected reporting. Know more
- 90% LessManual Data Entry
- FasterDecision-Making
- OneOperational Truth
Find the ROI of structured lean daily management
Model the financial and operational impact of Data Point SQCDP across your sites and teams.
Calculate Your ROI- ReduceManual Effort
- ImproveProductivity
- UnlockMeasurable Savings
Traditional vs Digital SQDCP: Are Excel, Whiteboards and Disconnected Tools Holding You Back?
Traditional huddle approaches often create gaps between performance visibility and action. Explore the side-by-side comparison to understand where traditional methods fall short and how digital SQCDP software overcomes these limitations with clear accountability and continuous improvement.
Download the Full Comparison Guide| Traditional SQCDP & Disconnected Tools | Digital SQCDP with Data Point |
|---|---|
Data scattered across systemsERP, MES, Power BI and spreadsheets provide separate views. | One connected operational viewBring existing system data into a shared daily management environment. |
Reports without coordinated actionDashboards show performance, but follow-up happens elsewhere. | From insight to actionConnect performance gaps to decisions, owners and corrective actions. |
Hours spent preparing reviewsManagers collect, reconcile and interpret reports before meetings. | More time for problem-solvingFocus daily huddles on deviations, priorities and decisions. |
Multiple files, inconsistent processesDepartments and shifts maintain separate trackers and reporting routines. | Standardised, scalable managementConfigure consistent KPI structures across teams, shifts and sites. |
Limited action traceabilityWhiteboard notes, emails and trackers make ownership and closure difficult to follow. | End-to-end action visibilityTrack issues, responsibilities, deadlines and progress through resolution. |
Improvement disconnected from reportingRoot-cause investigations and countermeasures sit outside the daily performance review. | Connected continuous improvementLink KPI deviations to Lean problem-solving, corrective actions and effectiveness reviews. |
Ready-to-Use SQCDP Excel Template or Digital Demo? Try Both Now
Download the free SQCDP Excel template to try the framework, then book a tailored Data Point demo to explore digital daily management.
SQCDP Explained: A Practical Guide to Lean Daily Management
Explore SQCDP implementation, board examples, daily huddles, KPI management and continuous improvement practices.
What Does SQCDP or SQDCP Mean, and What Is Its Role in Lean Manufacturing?
SQCDP stands for Safety, Quality, Cost, Delivery and People. It is a Lean visual management framework that helps manufacturing teams monitor daily performance, identify operational problems and drive continuous improvement.
Also commonly written as SQDCP (Safety, Quality, Delivery, Cost, People), the framework brings essential operational KPIs into one visual management board.
Its role in Lean manufacturing includes:
- Making performance visible: Track actual results against targets across five operational priorities.
- Identifying deviations early: Highlight safety concerns, quality issues, production delays and other performance gaps.
- Supporting daily huddles: Give teams a shared view of performance for structured daily discussions.
- Strengthening accountability: Assign corrective actions, responsibilities and deadlines.
- Driving continuous improvement: Use performance trends and recurring issues to guide Lean problem-solving.
What does a practical SQCDP board example look like?
A typical SQCDP board example displays five operational categories, their KPIs, performance targets, actual results and visual status indicators.
For example, a manufacturing production line might use:
Teams can use red, amber and green indicators to identify performance gaps. A useful board also includes action owners, deadlines and progress updates.
What Are the Key SQCDP KPIs, examples and what they measure?
The following table shows practical SQCDP KPI examples commonly used on manufacturing visual management boards.
What is a tier board, and how does tiered daily management work?
A tier board is a visual performance management board used at a specific organisational level to review KPIs, track issues and coordinate improvement activities.
Tiered daily management connects operational teams with supervisors and leadership through structured meetings.
What are the most common mistakes when implementing an SQCDP board?
SQCDP implementation often becomes ineffective when teams focus on displaying KPIs without establishing consistent management routines.
Common mistakes include:
- Tracking too many KPIs: Makes it difficult to identify priorities.
- Using outdated information: Prevents timely operational decisions.
- Missing performance targets: Makes deviations difficult to recognise.
- Holding reporting-only meetings: Produces discussions without corrective actions.
- Unclear action ownership: Allows recurring problems to remain unresolved.
- Ignoring historical trends: Limits opportunities for continuous improvement.
To avoid these problems, establish clear KPI definitions, reporting responsibilities, meeting routines and escalation procedures.
How Can AI Improve SQCDP Boards in Manufacturing?
AI can enhance digital SQCDP boards by analysing operational data, identifying performance patterns and helping manufacturing teams make more informed decisions. Instead of relying only on manual KPI reviews, AI-powered SQCDP software can provide additional insights into Safety, Quality, Cost, Delivery and People performance.
Practical applications of AI in SQCDP include:
- Performance analysis: Analyse KPI trends across shifts, production lines and departments to identify recurring performance gaps.
- Anomaly detection: Highlight unusual changes in quality, delivery, cost or other operational metrics that may require investigation.
- Root-cause investigation: Help teams explore possible contributing factors behind recurring issues using available operational data.
- Predictive insights: Use historical performance patterns to identify potential risks before they affect operational targets.
- Natural-language queries: Allow managers to ask questions about operational performance and receive contextual answers without manually analysing multiple reports.
- Continuous improvement recommendations: Support Lean problem-solving by identifying improvement opportunities and suggesting possible next actions.
For example, if a production line repeatedly misses its delivery targets, AI could help analyse historical SQCDP performance, identify recurring patterns and highlight areas that require further investigation.
How do you create and use an SQCDP board in manufacturing?
An SQCDP board streamline manufacturing functions organise daily performance information around Safety, Quality, Cost, Delivery and People. It can be created using a physical board, an Excel template or digital visual management software.
Follow these six steps to know how to use an SQDCP board:
- Define priorities: Identify the operational objectives relevant to your production line or department.
- Select KPIs: Choose measurable indicators with clear targets and responsible owners.
- Structure the board: Organise KPIs under the five SQCDP categories, including target-versus-actual performance.
- Update performance: Record daily or shift-level results using available operational data.
- Conduct daily huddles: Review deviations, discuss problems and assign corrective actions.
- Monitor improvement: Track recurring issues, action completion, SQCDP reports and performance trends.
A successful SQCDP implementation depends on consistent updates, meaningful KPIs and clear accountability.
What are the different SQCDP variations, including SQDCP, SQPDC, SQDCM and SQDCPE?
SQCDP is a flexible Lean visual management framework. Organisations may change the order of the letters or introduce additional dimensions based on their operational priorities. Read SQDCP vs PQVC Metrics to know how it works differently even the objective remains the same.
How do you conduct an effective SQCDP daily huddle meeting?
An SQCDP daily huddle is a short operational meeting where teams review performance, identify problems and agree on corrective actions.
A typical manufacturing huddle takes approximately 10–15 minutes, depending on the team and operational requirements.
A practical daily huddle agenda:
1. Review Safety, Quality, Cost, Delivery and People performance.
2. Identify KPIs that missed their targets.
3. Discuss significant operational problems and constraints.
4. Review outstanding corrective actions.
5. Assign new actions with owners and deadlines.
6. Escalate issues requiring additional support.
The meeting should prioritise exceptions and decisions rather than reviewing every KPI in detail.
An effective huddle ends with clear responsibilities and agreed follow-up actions.
How do you set targets and use RAG indicators on an SQCDP board?
RAG indicators use Red, Amber and Green colours to communicate KPI performance against defined targets.
- Green: Performance meets the agreed target.
- Amber: Performance is approaching an unacceptable threshold or requires attention.
- Red: Performance falls outside the agreed operating limits and requires action.
For example, a production team targeting 98% First Pass Yield might define Green as 98% or above, Amber as 96–97.9%, and Red as below 96%. Effective SQCDP boards for continuous improvement also display actual values and trends, ensuring teams understand the size and direction of a performance gap rather than relying on colours alone.
SQCDP boards help teams identify recurring performance gaps and connect daily monitoring with structured Lean problem-solving.
When a KPI consistently misses its target, teams can investigate the underlying causes using techniques such as:
- 5 Whys: Explore the underlying causes of a problem.
- Fishbone diagrams: Examine potential contributing factors.
- Pareto analysis: Identify the most significant recurring losses.
- PDCA: Plan, implement, evaluate and standardise improvements.
- A3 problem-solving: Document the problem, analysis, countermeasures and results.
For example, recurring quality defects may lead a team to investigate machine settings, materials or operating procedures.
The improvement process should include corrective-action ownership, deadlines and follow-up measurement to verify effectiveness.
How Do You Use an SQCDP Excel Template?
An SQCDP Excel template provides a ready-made format for recording and visualising daily performance across Safety, Quality, Cost, Delivery and People.
Simply download Data Point SQCDP Excel Template and open the template, customise the KPIs and targets for your operation, and enter daily or shift-wise performance data. The information can then be viewed through colour-coded indicators, charts and performance summaries, depending on the template's features. Teams can use these visualisations during daily huddles to identify gaps and plan corrective actions.
You can create your own Excel board or save time by using a professionally designed SQCDP template from Data Point, which provides a structured starting point for Lean Daily Management.
What Is the Difference Between an SQCDP Board and a KPI Dashboard?
A KPI dashboard primarily displays and analyses performance metrics, while an SQCDP board uses those metrics to drive structured daily huddles, problem-solving and corrective actions across Safety, Quality, Cost, Delivery and People.
For example, a KPI dashboard might show that production efficiency has dropped to 85%. An SQCDP board helps the team review the deviation during a daily huddle, investigate the cause, assign corrective actions, and track progress towards resolution.
The key difference: A KPI dashboard makes performance visible; an SQCDP board connects performance visibility with accountability and continuous improvement.

Real Customer Success Stories with Digital SQCDP
“By providing a central location to input, analyse and share our KPIs, 'Data Point' enables site management to more easily focus on the entire business as a team. Its ability to allow automated data entry and trend analysis gives us more time for improvement rather than just reporting numbers. Combined with a disciplined approach within our SQDC meeting process, I believe 'Data Point' will help us continually focus on key issues and drive business excellence in all areas.”

Marc Robinson
Director, Global Operational Excellence


PCI Pharma Streamlined Continuous Improvement with SQCDP Boards
PCI Pharma Services Bridgend site faced significant challenges in managing their daily stand-up meetings and reviewing crucial metrics impacting their production and operations plans. Relying heavily on paper-based systems and spreadsheets during Lean Daily Management Meetings, they struggled to effectively track and analyse their Safety, Quality, Delivery, Cost, and People (SQDCP) key performance indicators (KPIs). To overcome these hurdles and propel their continuous improvement journey, PCI Bridgend ...


How Does a Digital SQCDP Board Work in Lean Manufacturing?
Industry-Specific Solutions
Digital SQCDP, Tailored to Your Industry
Get in Touch with Us for your Customised SQDCP Demo!
Discover how our SQCDP Board Visual Management Software can revolutionise your shop floor performance.

Get Started
Explore other Visual Management Frameworks
Frequently Asked Questions About Data Point SQCDP Software
From implementation and integration to pricing, security and ongoing support, find answers to the questions that matter when evaluating Data Point for your operations.
How much does Data Point SQCDP software cost?
Data Point pricing depends on your operational requirements, including the number of users, sites, required capabilities, customisation and integrations.
Rather than offering a fixed package that may not suit your operation, the Data Point team can assess your requirements and provide a tailored quotation.
How long does it take to implement Data Point SQCDP software?
Implementation timelines depend on your existing KPI structure, board configuration, integration requirements and deployment scope.
A foundational setup may be completed in as little as two weeks, while deployments involving ERP or MES integration typically require additional configuration and validation.
The implementation team works with your stakeholders to establish a realistic rollout plan, including testing, training and go-live support.
Do we need a dedicated IT team to implement and manage Data Point?
No dedicated IT team is typically required for day-to-day SQCDP board management.
Operations and continuous improvement teams can manage routine KPI reviews and board activities. Your IT team may be involved during initial deployment to review security, user access, infrastructure requirements and system integrations.
LTS provides technical implementation support to help coordinate these activities.
Can Data Point integrate with our existing ERP, MES and other business systems?
Yes. Data Point supports integration with existing operational and business systems, including ERP, MES, Excel, Power BI, APIs and other relevant data sources.
Integration requirements are assessed during implementation to determine the appropriate data connections, update frequency and configuration.
This allows teams to bring information from multiple systems into a connected SQCDP management environment without necessarily replacing their existing software.
How secure is Data Point SQCDP software?
Data Point is designed with enterprise security controls to protect operational information and manage access to sensitive data.
Its documented security capabilities include:
- Encryption for data in transit and at rest.
- Role-based access controls and user permissions.
- Secure data storage and integration controls.
- Audit trails for relevant system activities.
- Backup and recovery measures.
Your IT or information security team can review the applicable security requirements and deployment controls with LTS before implementation.
What onboarding and training support does LTS provide?
LTS provides guided onboarding to help teams configure, adopt and use Data Point effectively.
This includes KPI and board configuration, data setup, user acceptance testing, go-live assistance and role-based training for operators, supervisors, managers and leadership.
User guides and documentation are also provided to support adoption after implementation.
What technical support is available after implementation?
LTS provides ongoing technical and programme support to help customers maintain their Data Point environment and address operational requirements.
Support can cover technical issues, configuration assistance, integration-related queries and guidance as teams expand their use of the platform.
Specific support arrangements, response times and service commitments should be confirmed as part of the customer agreement.
Can we customise Data Point SQCDP boards to match our existing KPI framework?
Yes. Data Point supports configurable KPI structures, board layouts, performance indicators and management views.
You can retain your existing SQCDP, SQDCP, SQDCM or customised daily management framework, rather than adopting a completely new reporting structure.
Boards can also be configured for different teams, departments and management levels.
Can we start with one production line or site and expand later?
Yes. Data Point can be introduced within a defined operational scope before expanding to additional production lines, departments or sites.
A phased rollout allows teams to establish KPI definitions, validate workflows, train users and assess adoption before scaling.
This approach is particularly useful for manufacturers planning enterprise-wide standardisation.
Does Data Point support multiple sites, departments and management tiers?
Yes. Data Point supports daily management across production teams, departments, management tiers and multiple manufacturing locations.
Organisations can standardise KPI definitions and reporting structures while configuring relevant views for individual operational teams.
This helps leadership review performance across the organisation without relying on separate reporting processes at every site.
Can our teams access Data Point SQCDP boards remotely or from different devices?
Data Point supports access to operational dashboards and management information for authorised users, subject to the organisation’s access permissions and deployment configuration.
This allows managers and leadership teams to review relevant performance information beyond the physical shopfloor board.
Specific device compatibility and connectivity requirements can be confirmed during implementation planning.
Do we need to replace our existing dashboards, Excel files or reporting systems?
No. Data Point is designed to work alongside existing operational systems rather than requiring organisations to replace their entire technology environment.
Teams can continue using relevant ERP, MES, Excel and reporting tools while bringing selected operational information into Data Point for structured daily management.
This helps connect KPI visibility, daily huddles, action ownership and improvement activities within a shared environment.
How can we evaluate Data Point before committing to a wider rollout?
You can begin with a tailored demonstration to evaluate how Data Point would work with your existing SQCDP framework, KPIs and operational processes.
For organisations considering a phased implementation, LTS can discuss a scoped pilot or initial deployment to validate the proposed solution.
The scope, commercial terms and success criteria would be agreed before proceeding.
How can we measure the ROI of implementing Data Point SQCDP?
The return on investment depends on your existing reporting effort, operational inefficiencies, number of users and improvement objectives.
Potential areas of measurable value include:
- Reduced manual KPI collection and reporting time.
- Faster identification and escalation of performance gaps.
- Improved corrective-action visibility and accountability.
- More consistent daily management across teams and sites.
- Reduced operational losses where improvement actions prove effective.
Data Point’s ROI calculator can help estimate potential financial and operational value using your organisation’s inputs.