How to Create and Set Up Custom KPI Dashboards for Any Team

Last updated on : February 27, 2026
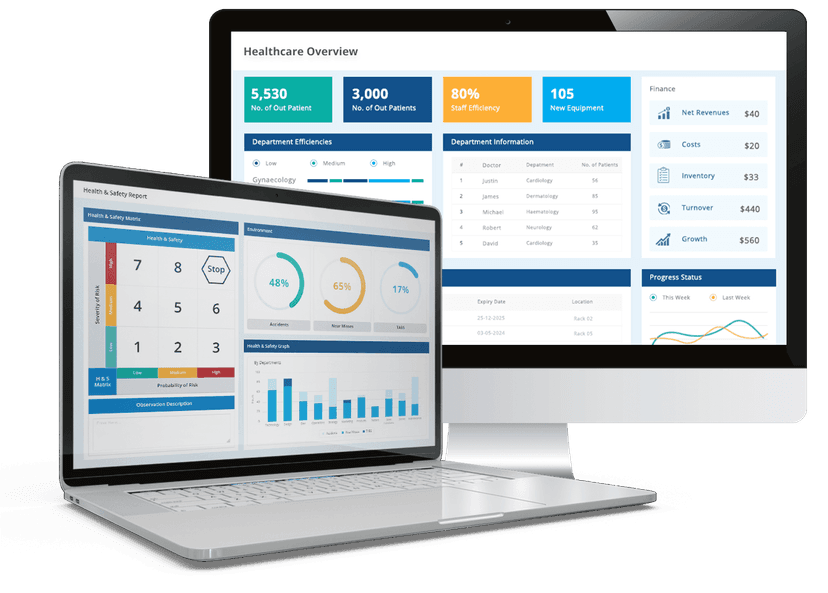
Most organisations track performance, but not all of them see the same results from it. The difference usually comes down to how well their data is organised for the people who use it. Custom KPI dashboards enable each team – from operations and finance to sales and leadership – to view the metrics that actually matter to their role, in a format that supports faster decisions. Instead of forcing everyone into a single, generic view, customised dashboards align performance data to team goals, workflows, and accountability, making KPI tracking far more practical across the business.
See how LTS Data Point builds role-based custom KPI dashboards from one KPI system
What are custom KPI dashboards and how do KPI systems use them?
Custom Key Performance Indicator dashboards are personalised views within a KPI system that show each team only the KPI dashboards and metrics that mirror their specific goals, responsibilities, and decisions. Rather than forcing every department to work from the same generic screen, KPI system software uses these tailored views to assist more accurate, role-based KPI management across the industry.
How KPI systems use custom KPI dashboards in practice
- Role-specific KPI dashboards: Inside a modern KPI system, operations, finance, sales, and leadership each work from different KPI dashboards. This allows teams to focus on the KPIs that matter to their function instead of being distracted by irrelevant data.
- Structured KPI management: A central KPI system defines how metrics are measured and updated, while custom KPI dashboards control how those KPIs are presented to different users. This keeps KPI management consistent without forcing a single reporting format on everyone.
- Configurable views in KPI system software: KPI system software lets companies design layouts, filters, and charts for each team’s KPI dashboards. Production teams might see throughput and downtime, while executives see financial and strategic KPIs – all from the same system.
- One data source, many perspectives: Because all KPI dashboards are powered by one KPI system, teams avoid conflicting numbers. Customisation happens at the dashboard level, not the data level, keeping KPI management precise and aligned.
- Faster, role-driven decisions: By tailoring KPI dashboards to how people actually work, KPI system software ensures every team gets the insights they need to act – without wading through someone else’s metrics.
How to create custom KPI dashboards using KPI software and KPI tracking tools
Custom KPI dashboards are only effective when they are built around how each team works, not around what the software happens to show by default. The right KPI tracking software give you flexibility to customise KPI dashboards that mirror different roles, decisions, and performance goals, all powered by the same underlying data.
Step-by-step guidance on how to create custom KPI dashboards
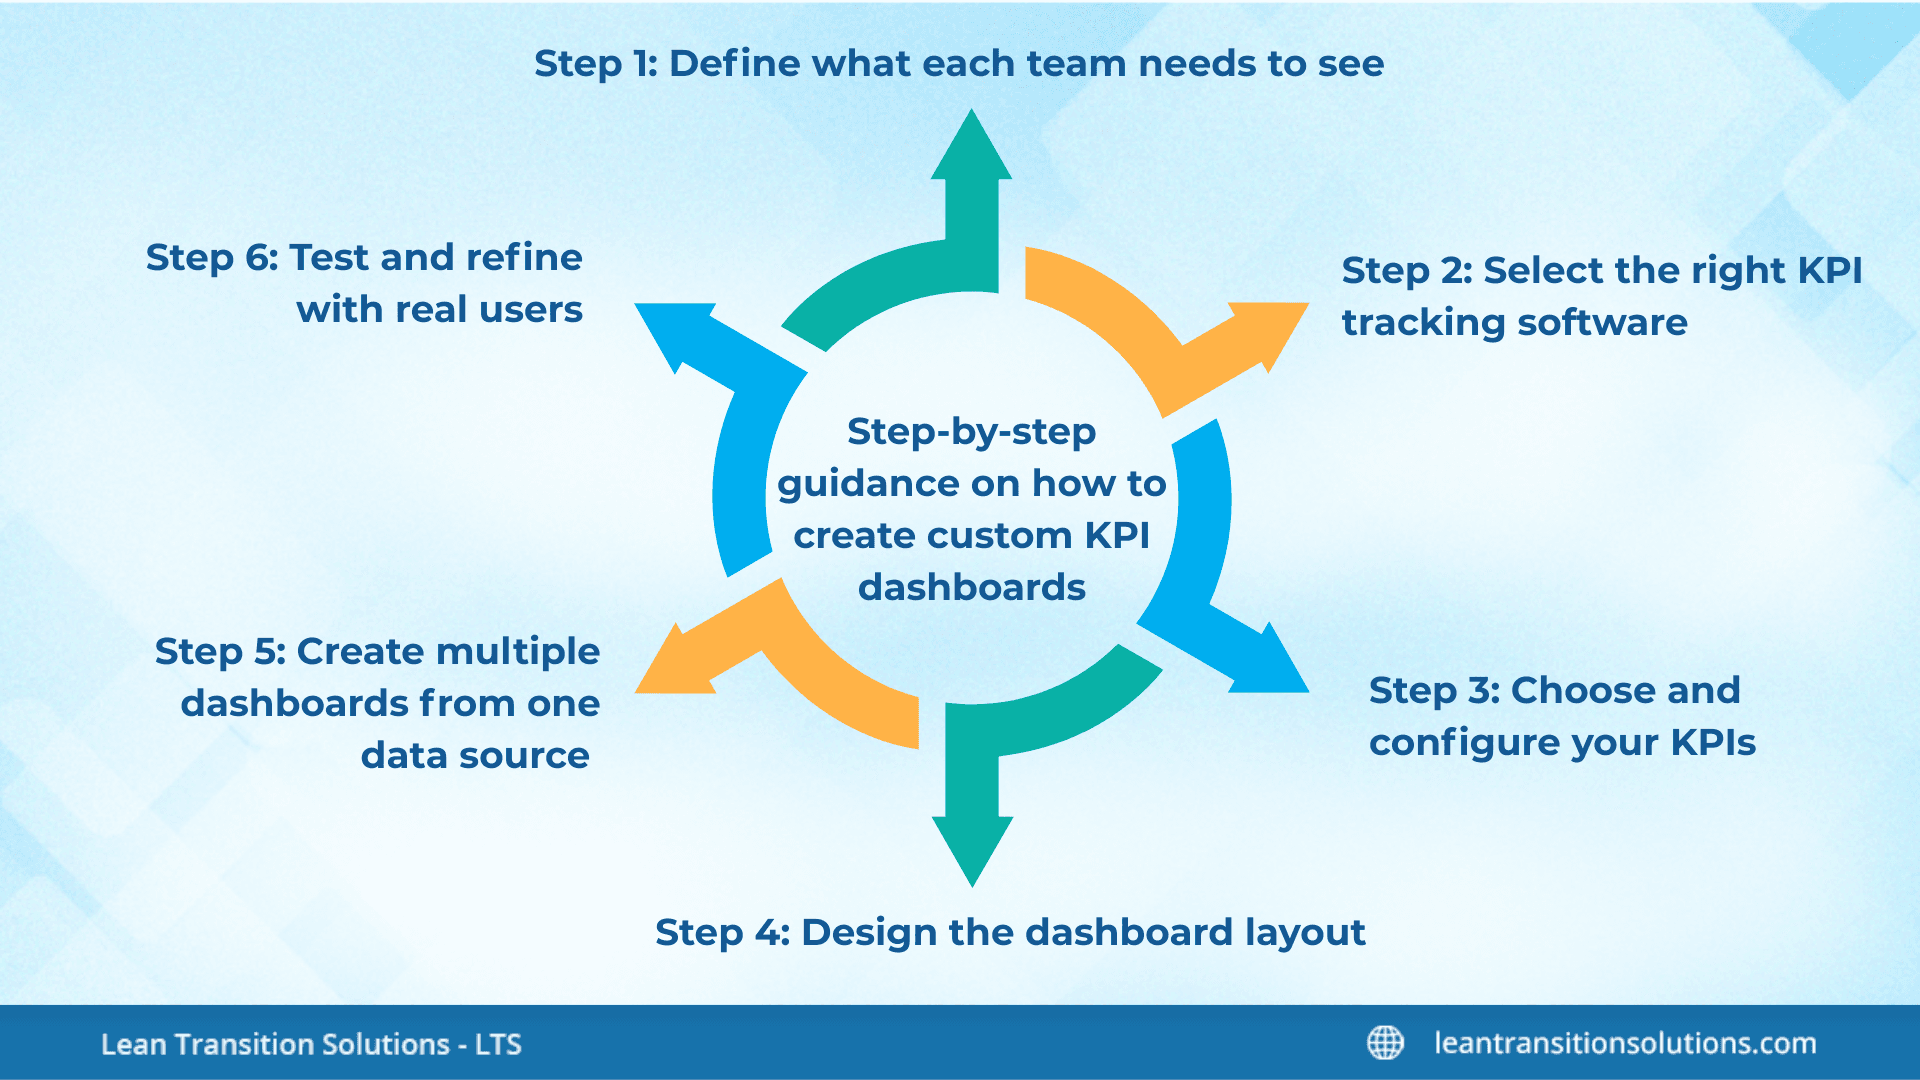
Define what each team needs to see
Before you touch any KPI software, clarify which decisions each team makes, and which metrics support those decisions. This makes sure every custom KPI dashboard is built around purpose, not just available data.
Select the right KPI tracking software
A strong KPI tracking software should enable you to pull data from multiple systems and allot it to various KPI dashboards. This avoids manual reporting and keeps every KPI tracker up to date.
Choose and configure your KPIs
Use your KPI tracker to select the metrics that matter to each role. Operations might monitor cycle time and defects, while leadership keeps an eye on revenue and customer performance – all within the same custom KPI dashboard framework.
Design the dashboard layout
In your KPI software, configure charts, tables, and alerts so that the most important KPIs are immediately visible. A well-designed custom KPI dashboard makes it easy for users to detect issues without digging into data.
Create multiple dashboards from one data source
When you create KPI dashboard views for different teams, they should all connect to the same underlying KPI tracking software. This guarantees consistency while still delivering personalised views.
Test and refine with real users
Allow each team to use their own customised KPI dashboard in day-to-day work. Feedback helps you enhance layouts, adjust KPIs, and ensure your KPI tracker supports how people actually make decisions.
Best custom dashboards for KPI reporting, charts, and live performance
Not all custom KPI dashboards are created equal. The best ones are designed around how teams make decisions, how data flows in real time, and how performance is reported across the industry. Rather than showing every metric at once, they focus on actionable insights and visual clarity, helping teams respond faster and align more effectively.
Key characteristics of the best custom KPI dashboards
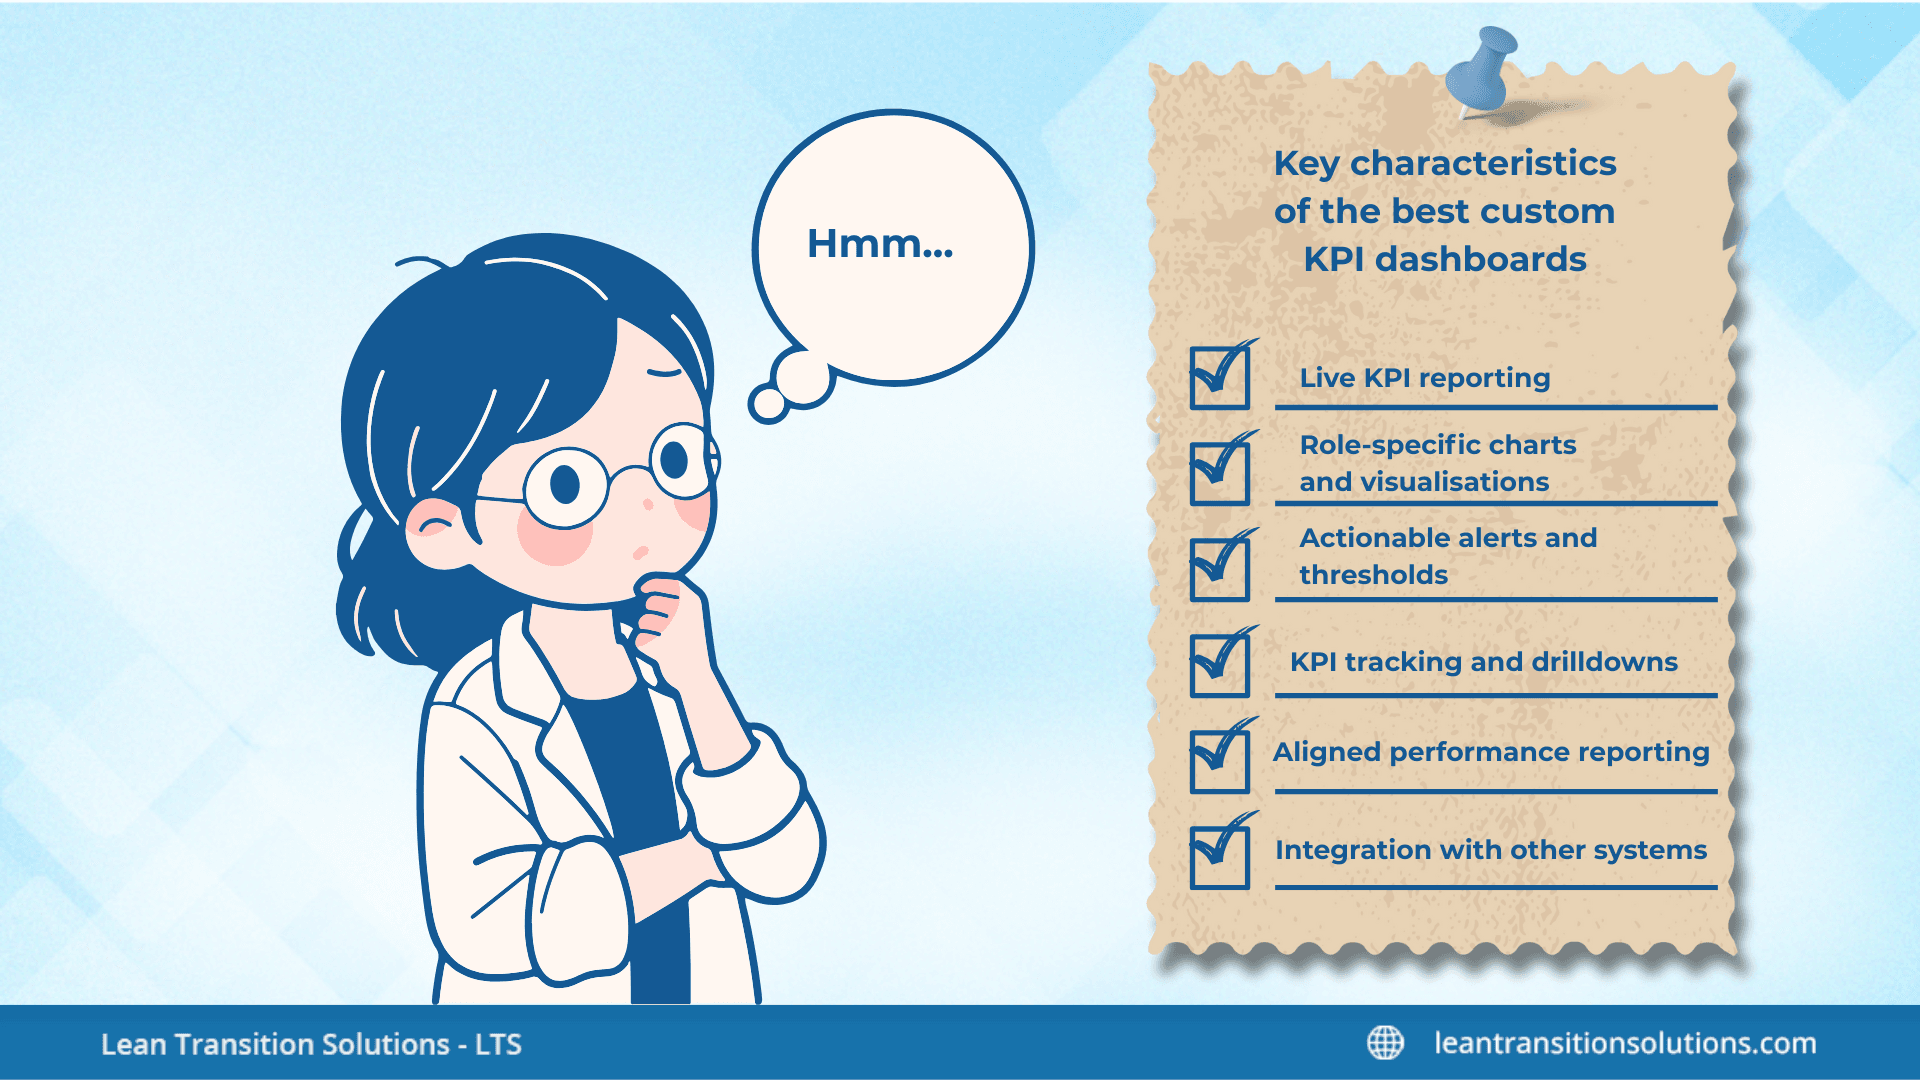
- Live KPI reporting: High-performing dashboards update automatically from linked systems. This verifies that every team sees current performance, not outdated numbers, improving decision-making and accountability.
- Role-specific charts and visualisations: Each custom KPI dashboard uses the right chart type for the metric – line charts for trends, gauges for targets, tables for operational details. Tailoring visuals to the audience makes insights easier to interpret.
- Actionable alerts and thresholds: The best dashboards include alerts when KPIs exceed or fall below thresholds. This enables teams to react immediately, instead of manually scanning reports.
- KPI tracking and drilldowns: Advanced KPI tracking software allows users click on high-level metrics to explore detailed data. This means a single custom KPI dashboard can support both summary views and operational deep dives.
- Aligned performance reporting: By centralising data in a single KPI system, all custom KPI dashboards present consistent metrics. This keeps teams, leadership, and decision-makers aligned, while still letting each team focus on its own priorities.
- Integration with other systems: The best custom KPI dashboards pull data from multiple sources – ERP, CRM, production, HR – so that reporting is comprehensive and reliable across teams.
Custom KPI dashboards vs KPI spreadsheets: Why digital KPI systems win
Depending on spreadsheets forces every team to work from the same static view of performance. Custom KPI dashboards, built inside a digital KPI systems, let each team to see the KPIs, layouts, and timeframes that match how they actually manage their work – without breaking data consistency or control.
Why digital custom KPI dashboards outperform KPI spreadsheets
Custom KPI dashboards with KPI examples for employees and teams
Custom KPI dashboards enable every team and individual to work from the KPIs that match their responsibilities, rather than from a one-size-fits-all views. This makes sure performance data supports daily decisions, not just high-level reporting.
Confused about which KPIs to choose and how to measure them with the right custom KPI dashboard? Check out our blogs for more clear insights on role-based KPIs:
- Mastering KPIs for Operations Managers: What to Track and What to Skip
- Top KPIs for Maintenance Manager to Reduce Downtime and Costs
- Strategic KPIs for Quality Managers: Boosting Performance in Manufacturing
- KPIs for Product Manager: Track Metrics to Drive Success
How custom KPI dashboard software powers KPI reporting and decision-making
Custom KPI dashboards become truly valuable when they are delivered through purpose-built KPI dashboard software rather than static tools or disconnected reports. At the enterprise level, custom KPI dashboard software acts as the operational layer between raw data and decision-makers, turning metrics into role-specific, actionable performance views through a unified KPI reporting tool.
Where LTS Data Point fits into custom KPI dashboards
LTS Data Point – enterprise KPI management and reporting platform is designed for industries that require structured, role-based custom KPI dashboards without sacrificing data consistency or governance.
- One KPI system, many custom dashboards: LTS Data Point KPI dashboard software lets companies to create multiple custom KPI dashboards from the same underlying performance data. Operations, finance, quality, and leadership can each have their own dashboard without creating conflicting KPI definitions.
- Controlled KPI reporting: As a central KPI reporting tool, LTS Data Point verifies that how KPIs are computed, updated, and displayed is governed at the system level. Teams get the views they need, while KPI management remains standardised.
- Role-based performance visibility: Using custom KPI dashboard software LTS Data Point assists different layouts, charts, and KPI sets for different users. This means every team sees only the data that supports their decisions, not a cluttered, generic dashboard.
- Enterprise-grade decision support: LTS Data Point KPI dashboard software links strategic, operational, and financial KPIs into aligned custom KPI dashboards, helping leaders understand how daily performance impacts business outcomes.
- Scalable KPI management across teams: As teams grow, LTS Data Point custom KPI dashboard software scales with them – adding new users, departments, and dashboards without breaking KPI definitions or reporting integrity.
Real-life example of how LTS Data Point custom KPI dashboard solved a recurring trouble
A multi-site manufacturing company was missing production targets because its operations managers were working from different reports pulled from ERP, maintenance logs, and spreadsheets. Shift leaders saw one version of downtime, finance saw another, and quality teams worked from a third set of numbers. Daily meetings turned into debates about which figures were correct instead of focusing on why performance was slipping and what needed to be fixed.
By implementing LTS Data Point – enterprise KPI management and reporting platform, the organisation created custom KPI dashboards that brought OEE, downtime, scrap, and throughput into one shared view. Using this visual platform for operations managers, every site and role worked from the same live KPIs while still seeing the metrics most relevant to their decisions. This enabled teams to spot bottlenecks earlier, align shift actions to real performance data, and move from reactive firefighting to proactive performance control.
Custom KPI dashboards are what turn performance data into something teams can actually use. When KPIs are delivered through role-based, configurable views, each team sees the metrics that match their goals, decisions, and responsibilities – without losing data consistency across the industry. By using organised KPI systems and custom KPI dashboard software, businesses can move beyond static reports and generic dashboards to a performance model where every team is aligned, accountable, and able to act on the right data at the right time.
Learn how LTS Data Point supports enterprise KPI management
FAQs
1. How often should custom KPI dashboards be reviewed and updated?
Custom KPI dashboards should be reviewed at least quarterly, or whenever business priorities change. Teams evolve, targets shift, and KPIs that were once critical can become less relevant. Regular reviews ensure each dashboard continues to reflect how teams actually manage performance.
2. Can different teams use the same KPIs but view them differently?
Yes. One of the key benefits of custom KPI dashboards is that the same KPI can be visualised differently for different roles. For example, leadership may see monthly trends while operations see daily performance, all from the same KPI definition.
3. What is the biggest mistake organisations make when building KPI dashboards?
The most common mistake is creating dashboards based on available data instead of decision needs. Effective custom KPI dashboards start with the questions teams need to answer, then map KPIs and visuals to those decisions.
4. How many KPIs should a custom KPI dashboard include?
Most effective dashboards contain between 6 and 12 KPIs. This gives enough coverage to understand performance without overwhelming users with too much information.
5. Should custom KPI dashboards be the same across all departments?
No. While KPIs should come from the same KPI system, the dashboards should differ by role. Custom KPI dashboards work best when they reflect how each department contributes to overall performance.
6. Can custom KPI dashboards support both daily operations and strategic planning?
Yes. Organisations often create different custom KPI dashboards for short-term operational control and long-term strategic performance, using the same KPI system but different layouts, timeframes, and metrics.