KPIs for Product Manager: Track Metrics to Drive Success

Last updated on : December 31, 2025
Every product tells a story – but as a Product Manager, you know that success isn’t just about vision; it’s about measurable impact. When deadlines loom, stakeholders demand clarity, and resources feel stretched, gut instincts alone won’t cut it. You need hard data to guide decisions, validate strategies, and prove value. That’s when you must track KPIs for Product Manager. In this article, we’ll uncover why product managers require KPIs, common challenges in product management and practical solutions, top twelve KPIs for product manager, tools and techniques to track KPIs effectively, various KPI tracking dashboards, how to set realistic KPI targets, common mistakes while tracking KPIs and how to avoid them, and how to make use of LTS Data Point tools and frameworks to keep track of your product KPIs successfully.
Discover how you can stay ahead in your game with LTS Data Point
Why product managers require KPIs
Product managers need Key Performance Indicators (KPIs) because they convert ambiguity into direction, opinions into evidence, and activity into quantifiable progress. In fast-paced product environments – where priorities shift, customer needs evolve, and resources are finite – KPIs act as the control system that keeps product decisions aligned with business value and user outcomes.
Here's why product managers need KPIs:
- Create clarity and focus: KPIs translate broad product goals (growth, adoption, retention, efficiency) into concrete metrics. This aids product managers decide what to prioritise and what to ignore.
- Align teams around what matters: Engineering, design, marketing, sales, and support all have different perspectives. KPIs provide a shared language – everyone knows what success looks like and can optimise their work toward the same results.
- Allow objective decision-making: Without KPIs, decisions are often driven by intuition, authority, or the loudest voices. KPIs presents product managers the evidence needed to justify trade-offs, eliminate underperforming features, or double down on what works.
- Track progress toward product strategy: KPIs are measurable connection between product vision, roadmap, execution and customer value. They assist product managers visualise whether the product is going in the intended direction.
- Expose issues early: Leading KPIs (like activation rate, feature adoption, cycle time) reveal friction before it becomes a bigger issue. This allows faster interventions and hinders revenue or retention loss.
- Support stakeholder communication: KPIs makes reporting simple to leadership by displaying mainly three things – what is happening, why it is happening, and what you plan to do about it. This creates credibility and trust in the product manager’s decision-making.
- Calculate customer value: Modern product management is result-driven, not feature-driven. KPIs confirm product managers for impact (e.g., increased retention) rather than activity (e.g., number of products shipped).
- Drive continuous improvement: Since KPIs are monitored over time, they assist product managers to experiment, learn, iterate, and upgrade product-market fit. This supports a test-and-learn culture instead of set-it-and-forget-it.
Common challenges in product management and practical solutions
1. Lack of clarity on priorities
- Challenge: Product managers often juggle competing demands such as customer requests, tech debt, sales pressure, and strategic goals.
- Solution: Use digital strategy execution boards and Balanced Scorecard frameworks that clearly translate industrial targets into prioritised product KPIs, initiatives, and backlog items. These tools guide product managers in maintaining alignment and avoiding reactive decision-making.
2. Poor visibility into performance
- Challenge: Records are scattered across spreadsheets, tools, and teams, making it hard for product managers to understand product health.
- Solution: Adopt live KPI dashboards, product performance scorecards, and automated reporting tools that integrate metrics like adoption, usage, cycle time, faults, and delivery predictability in one place.
3. Slow or inefficient execution
- Challenge: Roadmaps stall because teams lack structure, cadence, or real-time insight into work progress.
- Solution: Implement digital daily management boards, agile execution boards, and Kanban visualisation modules that observe workflow, bottlenecks, lead time, and improvement actions – enabling product managers to quicken delivery and maintain execution discipline.
4. Misalignment between strategy and delivery
- Challenge: Teams may ship features that don’t link to strategic goals or customer value.
- Solution: Use cascading strategy tools like the Hoshin Kanri X Matrix, OKR alignment boards, and Hoshin planning templates to bind top-level strategy to squad-level initiatives. This makes sure every feature has a purpose and quantifiable outcome.
5. Weak cross-functional collaboration
- Challenge: Silos between development, design, functions, and leadership cause lags and miscommunication.
- Solution: Leverage combined communication boards, responsibility matrices (RACI), and role-based dashboards that give clarity on ownership, deadlines, and progress across all operations.
6. Difficulty managing customer feedback
- Challenge: Customer insights often sit in emails, spreadsheets, or different tools – making it difficult to prioritise properly.
- Solution: Adopt centralised customer-voice dashboards, NPS tracking modules, and feedback-to-feature mapping tools that aid product managers turn customer insights into practical priorities.
7. Ineffective root cause problem-solving
- Challenge: Problems keep repeating because teams treat symptoms and not the root causes.
- Solution: Use organised problem-solving tools like CAPA workflows, A3 templates, 5 Why, Fishbone diagrams – all digitised to lead product managers through disciplined root cause spotting.
8. Difficulty communicating progress to leadership
- Challenge: Product managers spend too much time preparing updates and data.
- Solution: Automate reporting with strategic performance dashboards, live milestone trackers, and portfolio-level summaries that give leadership instant visibility without manual prep.
9. Feature overload and technical debt
- Challenge: Too many features shipped without calculating effectiveness will result in clutter, bugs, and wasted effort.
- Solution: Use impact vs. effort matrices, value stream dashboards, tech-debt registers that help product managers prioritise based on computable value rather than intuition.
10. Lack of accountability
- Challenge: Teams commit but don’t deliver – or deliver without ownership.
- Solution: Adopt digital accountability systems including RAG status boards, performance review dashboards, and action-tracking modules that make commitments visible and quantifiable.
Know more about challenges and how to solve them with LTS Data Point
Top 12 KPIs for product manager
KPI tracking is never an easy job. It requires a skilled product manager to identify priorities and choose which KPIs are relevant for a particular task to be done quickly.
Let's see which KPIs are important for a product manager.
Feature adoption rate
- Why it matters: Indicates whether newly released features are being used and delivering value.
- How to measure: Feature adoption rate = (Users who used the feature / Total active users) x 100
Monthly Active Users (MAU)
- Why it matters: Shows overall engagement and product adherence.
- How to measure: MAU = Count of unique active users in a 30-day period
User retention rate
- Why it matters: Calculates how well the product keeps users over time.
- How to measure: Retention rate = ((Users at end – New users) / Users at start) x 100
Customer churn rate
- Why it matters: Reveals how many customers are leaving, impacting growth and revenue.
- How to measure: Churn rate = (Customers lost / Customers at start) x 100
Activation rate
- Why it matters: Reflects how many new users reach their first moment of value.
- How to measure: Activation rate = (Users who finished key action / Total new users) x 100
Conversion rate
- Why it matters: Shows how effectively users move through a funnel step (signup, purchase, upgrade).
- How to measure: Conversion rate = (Users who completed target action / Users who started it) x 100
Customer Lifetime Value (CLV)
- Why it matters: Aids compute long-term revenue potential from each customer.
- How to measure: CLV = Average revenue per user x Gross margin x Customer lifespan
Customer Acquisition Cost (CAC)
- Why it matters: Mirrors how much it costs to acquire each new customer, critical for profitability.
- How to measure: CAC = Total sales + marketing spend / New customers acquired
Net Promoter Score (NPS)
- Why it matters: Calculates customer satisfaction and likelihood of recommending the product.
- How to measure: NPS = % Promoters - % Detractors
Cycle time
- Why it matters: Shows how fast the team can turn ideas into shipped value.
- How to measure: Cycle time = Time from beginning of the work -> To delivery
Defect density
- Why it matters: Computes product quality by showing how many defects happen per release or feature.
- How to measure: Defect density = Number of defects / Total story points (or features) delivered
Customer support ticket volume
- Why it matters: Spotlights usability issues, product quality gaps, and customer friction.
- How to measure: Ticket volume: Count of support tickets recorded in a period
Tools and techniques to track KPIs effectively
- Software integration: Use systems like MES, ERP, and Balanced Scorecard (BSC) platforms to centralise data, automate tracking, and align KPIs with operational and strategic goals.
- Dashboards and visualisation tools: Interactive dashboards simplify data interpretation through charts, colour-coded indicators, and trend analysis, allowing faster decision-making.
- Real-time data and alerts: Continuous monitoring with live updates and automated alerts assures quick responses to deviations, helping teams maintain performance and prevent issues before they escalate.
Experience the live KPI tracking features with LTS Data Point
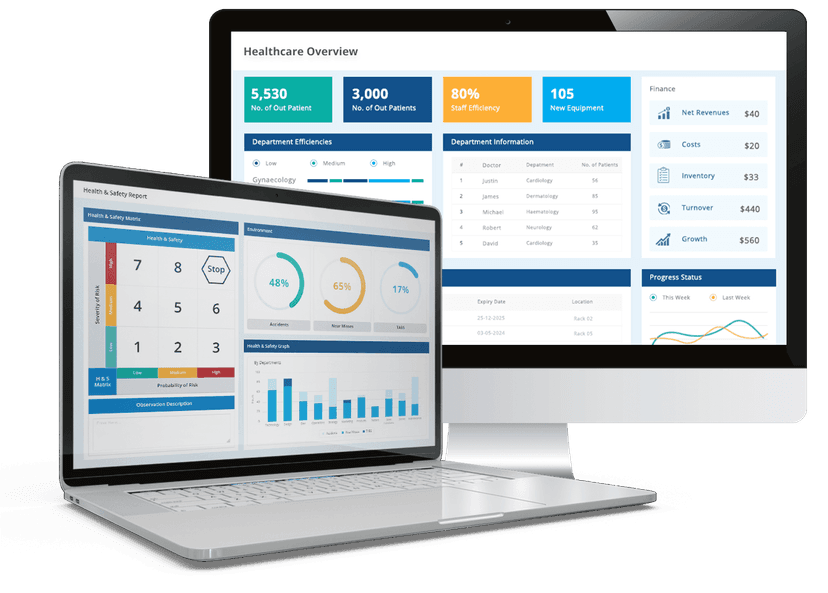
KPI tracking dashboard for product managers
A powerful KPI tracking dashboard helps product managers move from raw data to daily decision-making. The following components show how certain software tools and frameworks come together to deliver full visibility and continuous improvement.
1. Live KPI visualisation
- Real-time dashboards showing MAU, retention, activation, churn, adoption, and ticket volume.
- Drill-down charts to analyse performance by customer segment, product area, or time period.
- Automatic trend detection to highlight rising or falling KPIs instantly.
2. Balanced Scorecard integration
- KPIs mapped directly to strategic themes such as growth, quality, engagement, and efficiency.
- Clear visibility of how each metric links to product goals and initiatives.
- Traffic-light indicators showing KPI health at a glance.
3. Strategy execution and roadmap boards
- KPIs directly connected to initiatives, epics, and roadmap items.
- Ability to see which features are influencing which KPIs.
- Automatic updates to initiative status based on KPI performance.
4. Digital daily management dashboard
- Daily stand-up display showing WIP limits, cycle time, blocking issues, and defect trends.
- KPI deviations highlighted for immediate team action.
- Data pulled automatically from ongoing sprint or Kanban boards.
5. Customer voice and feedback dashboard
- Real-time view of NPS, customer satisfaction, and support ticket trends.
- Feedback themes grouped into categories linked to specific KPIs (retention, usability, reliability).
- Prioritisation engine that suggests which issues most impact KPI performance.
6. CAPA triggered KPI alerts
- When a KPI falls below threshold, an automated CAPA workflow begins.
- Built-in A3, root cause, and 5 Why templates guide teams through structured problem-solving.
- Dashboard view shows open CAPAs, root causes, and corrective actions.
7. Feature adoption and usage dashboard
- Adoption heatmaps showing which features drive engagement and which remain underused.
- Funnels showing user behaviour from activation to repeat usage.
- Correlation analysis to link features with retention improvements.
8. Value stream and flow efficiency analytics
- Visualisation of cycle time, lead time, and bottlenecks across the delivery workflow.
- Efficiency ratios showing how much time work spends actively progressing vs. waiting.
- Recommendations generated from data trends to improve speed-to-value.
9. Automated reporting and leadership summaries
- Weekly or monthly summaries auto generated from live KPI data.
- Executive-friendly snapshots with trend lines, commentary fields, and RAG status.
- Eliminates manual report creation entirely.
10. Prioritisation and impact scoring dashboard
- Impact vs. effort scoring powered by KPI data.
- Initiatives ranked based on expected KPI improvements.
- Clear justification for roadmap decisions based on measurable value.
KPIs for product manager: How to set realistic KPI targets
Before you set KPI targets, ask yourself this: are they driving progress or creating pressure without purpose? For product managers, the art of setting realistic KPIs lies in balancing ambition with practicality. Targets that are too aggressive can demoralise teams, while those that are too easy fail to inspire improvement.
Let's see how to set realistic KPI targets:
1. Start with the baseline
You can’t set a target without knowing your current performance. Use historical data like:
- Current conversion rate
- Last quarter’s retention
- Average cycle time
- Defect trends
Baseline -> tells you what is normal
Target -> defines what “better” looks like
2. Link KPIs to business and product strategy
Targets must support what the industry is trying to achieve, such as:
- Growth revenue
- Minimise churns
- Improve activation
- Expand into a new market
Example: If the strategy is customer retention, your targets should focus on:
- Increasing retention
- Decreasing churn
- Enhancing feature adoption
3. Consider capacity, resources, and constraints
Targets should match the team’s actual capability.
Ask:
- Do we have enough developers?
- Are there major dependencies?
- Is this a maintenance-heavy quarters?
- Are there key hires pending?
If capacity drops, targets should adjust accordingly.
4. Use benchmarks for guidance
Look at:
- Industry benchmarks
- Competitor data
- Market standards
- Previous product performance
But don’t copy them blindly – choose according to the context.
5. Choose leading KPIs, not just lagging ones
Lagging indicators show results (e.g., revenue), while leading indicators show progress (e.g., activation, feature adoption).
Setting targets for leading KPIs assists product managers:
- Predict outcomes
- Intervene earlier
- Stay on track
6. Make targets ambitious, but achievable
Use the “70%” rule – A good target is the one you can hit 70% of the time focused effort – not 100% easily, not 20% with luck.
Steer clear from too easy targets and unrealistic aims.
7. Break big targets into small milestones
Instead of setting target like – increase retention rate from 60%-80%, break it into quarterly targets:
- Q1: 65%
- Q2: 68%
- Q3: 72%
- Q4: 80%
This ensures momentum and early wins.
8. Validate targets with cross-functional teams
Product managers do not own targets alone. Discuss with:
- Engineering (can we deliver?)
- Design (is the experience practical?)
- Marketing (can we drive activation?)
- Support (can we reduce ticket volume?)
Alignment -> eliminates surprises later.
9. Use historical improvement rates
Inspect how fast you have improved in the past. For example, if your activation rate grew 3% per quarter, a jump of 12% next quarter is unrealistic. Analysis of historical enhancement stops overestimation.
10. Document assumptions behind each target
This is usually ignored but necessary. Assumptions help you understand:
- Why the aim was chosen
- What conditions it depends on
- Why it may succeed or fail
If assumptions change, targets can be recalibrated without blame.
Example of a realistic KPI target process
KPI: Feature adoption rate
- Baseline: 25%
- Historical growth: ~5% per quarter
- Team capacity: Stable
- Strategic goal: Improve customer engagement
- Target: Increase feature adoption from 25% -> 35% in the next quarter
- (Based on realistic 10% improvement with new onboarding flow).
Get expert guidance on how to set realistic KPI targets from LTS Data Point
Common mistakes while tracking production KPIs and how to avoid them
It would have been perfect if you are fully faultless, right? But that’s not how reality works. Mistakes happen, which if gone unnoticed would lead to expensive losses. A wise product manager is the one who takes measures to prevent these mistakes from happening by seeing it ahead. If you’re looking forward to being the wise one, this section is definitely meant for you.
Let's look into those common pitfalls and how to avoid them:
1. Tracking too many KPIs at once
- Mistake: Product managers monitor 20-30 metrics, causing confusion instead of clarity.
- Why it’s harmful: Reduces focus and makes prioritisation impossible.
- What to do instead: Pick 3-6 KPIs that actually drive product results.
2. Choosing vanity metrics
- Mistake: Using metrics that appear good but don’t influence business results (e.g., page views, downloads).
- Why it’s harmful: Gives a false sense of progress.
- What to do instead: Concentrate on KPIs linked to activation, retention, revenue, and value creation.
3. Setting goals without baseline
- Mistake: Setting goals like “Increase retention to 90%” without knowing current retention.
- Why it’s harmful: Results in unrealistic or meaningless targets.
- What to do instead: Always set aims based on historical performance and capacity.
4. Using KPIs that don’t align with strategy
- Mistake: Calculating what’s easy, not what’s relevant.
- Why it’s harmful: Teams ship features that don’t support strategic goals. What to do instead: Make sure every KPI binds to strategic priority.
5. Ignoring leading indicators
- Mistake: Zeroing in only on lagging KPIs like revenue or churn.
- Why it’s harmful: You will notice the issue only after it has done the damage.
- What to do instead: Keep an eye on leading KPIs like activation, onboarding completion, feature usage.
6. Not assessing KPIs frequently
- Mistake: Reviewing KPIs monthly or quarterly.
- Why it’s harmful: Slows action, letting small problems grow into huge failures.
- What to do instead: Evaluate KPIs weekly or integrate them into daily management boards.
7. Not defining clear measurement rules
- Mistake: Ambiguous definition (e.g., active user).
- Why it’s harmful: Teams interpret metrics differently, causing doubts.
- What to do instead: Design a KPI glossary that defines how each KPI is calculated.
8. Concentrating on numbers instead of insights
- Mistake: Reporting KPIs without comprehending why they changed.
- Why it’s harmful: Leads to reactive decisions and guesswork.
- What to do instead: Always connect KPIs with root cause analysis.
9. Changing KPIs too often
- Mistake: Switching KPIs every time priorities shift.
- Why it’s harmful: Teams lose consistency and can’t observe improvement trends.
- What to do instead: Keep KPIs stable; change them only when strategy changes.
10. Using KPIs as a performance weapon
- Mistake: Holding individuals accountable for KPIs outside their control.
- Why it’s harmful: Creates fear, manipulation and bad data practices.
- What to do instead: Use KPIs to improve the system, not punish people.
11. Ignoring the context behind numbers
- Mistake: Assuming all KPI changes mirror performance.
- Why it’s harmful: External factors (market, product launches, seasonality) may create an impact on metrics.
- What to do instead: Tie KPIs with contextual notes and assumptions.
12. Not visualising KPIs clearly
- Mistake: Using raw tables or long records that teams don’t engage with.
- Why it’s harmful: KPIs become invisible and useless.
- What to do instead: Use dashboard visualisation with trend lines, status indicators, and thresholds.
For more details, pay a visit: How to Measure KPIs: All you need to know
Avoid mistakes now with LTS Data Point tools and templates
KPIs for product manager: Turning data into continuous improvement with LTS Data Point

As an efficient product manager, you learn about all the basics but is still not sure which software to approach considering the budget you have in your hands and the requirements of your firm in your mind. This is where you need to do some research in detail.
Not to worry. We've got you covered in that department as well.
Let's investigate why LTS Data Point fits your company requirements perfectly:
1. Live KPI dashboards
- Monitor adoption, retention, activation, churn, cycle time
- Use drilldown views to spot root causes
- Track leading and lagging indicators in one place
2. Balanced Scorecard framework
- Connect product goals to KPIs
- Visualise how features support strategic themes
- Secure quantifiable outcomes, not just outputs
3. Strategy execution boards
- Align product initiatives with KPI aims
- Observe progress across teams
- Bridge the gap between strategic planning and strategic execution
4. Digital lean daily management boards
- See work-in-progress, blockers, defects
- Introduce KPIs into daily decision-making
- Make sure teams respond quickly to performance changes
5. Hoshin Kanri X Matrix for cascading KPIs
- Bind goals -> KPIs -> initiatives -> actions
- Ensure every team understands what success looks like
- Keep everyone aligned on computable outcomes
6. CAPA (Corrective and Preventive Actions) workflow
- Turn KPI drops into practical CAPAs
- Use A3 problem-solving, 5 Why, Fishbone diagram
- Close repeating problems faster with digital workflows
7. Root cause analysis boards
- Use organised templates to assess trends
- Prevent jumping between symptoms and solutions
- Cultivate continuous improvement habits across teams
8. Automated reporting and performance summaries
- Auto-generate weekly or monthly product reports
- Share KPI-driven insights with leaders immediately
- Spend less time documenting, more time upgrading
9. Customer voice dashboards
- Monitor NPS, feedback themes, ticket trends
- Chart customer insights to product KPIs
- Concentrate on improvements that create measurable value
10. Value stream and flow efficiency tools
- Calculate time spent in each workflow stage
- Detect bottlenecks affecting KPI performance
- Enhance speed-to-market with fact-based insights
11. Impact vs effort prioritisation tools
- Score initiatives based on KPI influence
- Eliminate low-value or high-waste work
- Take roadmap decisions with evidence, not opinion
12. Accountability and RAG status tracking
- RAG indicators for KPI health
- Action tracking for KPI gaps
- Clear ownership and visibility across teams
The truth is, product management will always have its challenges – tight deadlines, shifting priorities, and pressure from every direction. But you don’t need to tackle it blind. KPIs give you the clarity to cut through the noise, spot problems early, and keep your strategy moving forward. Forget chasing vanity metrics or setting targets that no one can hit. Prioritise the numbers that matter, set goals your team can believe in, and use data to guide every decision. That’s how you turn stress into success.
Track product KPIs efficiently with LTS Data Point and be the expert
FAQs
1. What's the difference between KPIs and OKRs for product managers?
KPIs measure ongoing performance against specific metrics, while OKRs define broader objectives and key results. KPIs tell you how you’re doing, OKRs tell you where you’re going.
2. Can KPIs for product managers vary by product lifecycle stage?
Yes. Early-stage products focus on activation and adoption KPIs, while mature products emphasise retention, revenue, and efficiency metrics.
3. How do KPIs support stakeholder communication?
KPIs provide clear, quantifiable data that makes reporting simple and credible – showing what’s happening, why, and what’s next.
4. How often should a product manager review KPIs?
Weekly reviews are ideal for fast-moving teams, while monthly reviews work for strategic metrics. Real-time dashboards help spot issues early.
5. Should KPIs include customer feedback metrics?
Absolutely. Metrics like NPS, CSAT, and support ticket trends help link product decisions to customer satisfaction and loyalty.
6. How do KPIs help prioritise product features?
KPIs reveal which features drive adoption, retention, or revenue, helping product managers focus on high-impact work instead of guesswork.
7. How can KPIs improve cross-functional collaboration?
Shared KPIs align teams around common goals, reducing silos and ensuring engineering, design, and marketing work toward the same outcomes.
8. Why do project managers need a KPI dashboard?
A dashboard provides instant visibility into product health, reduces manual reporting, and helps identify trends or issues before they escalate.
9. What features should a KPI dashboard include?
Real-time data updates, drill-down analytics, customisable views, automated alerts, and integration with tools like Jira, CRM, and analytics platforms.

Abel Jiménez, Lean Consultant
Abel is a Lean Consultant with over 30 years of expertise in operational analysis, process improvement, and organisational change across Mexican industries. Currently serving as Director of Insurance Promotions at CESCEMEX, he helps organisations leverage technology and lean practices to improve efficiency and manage change with continuity.