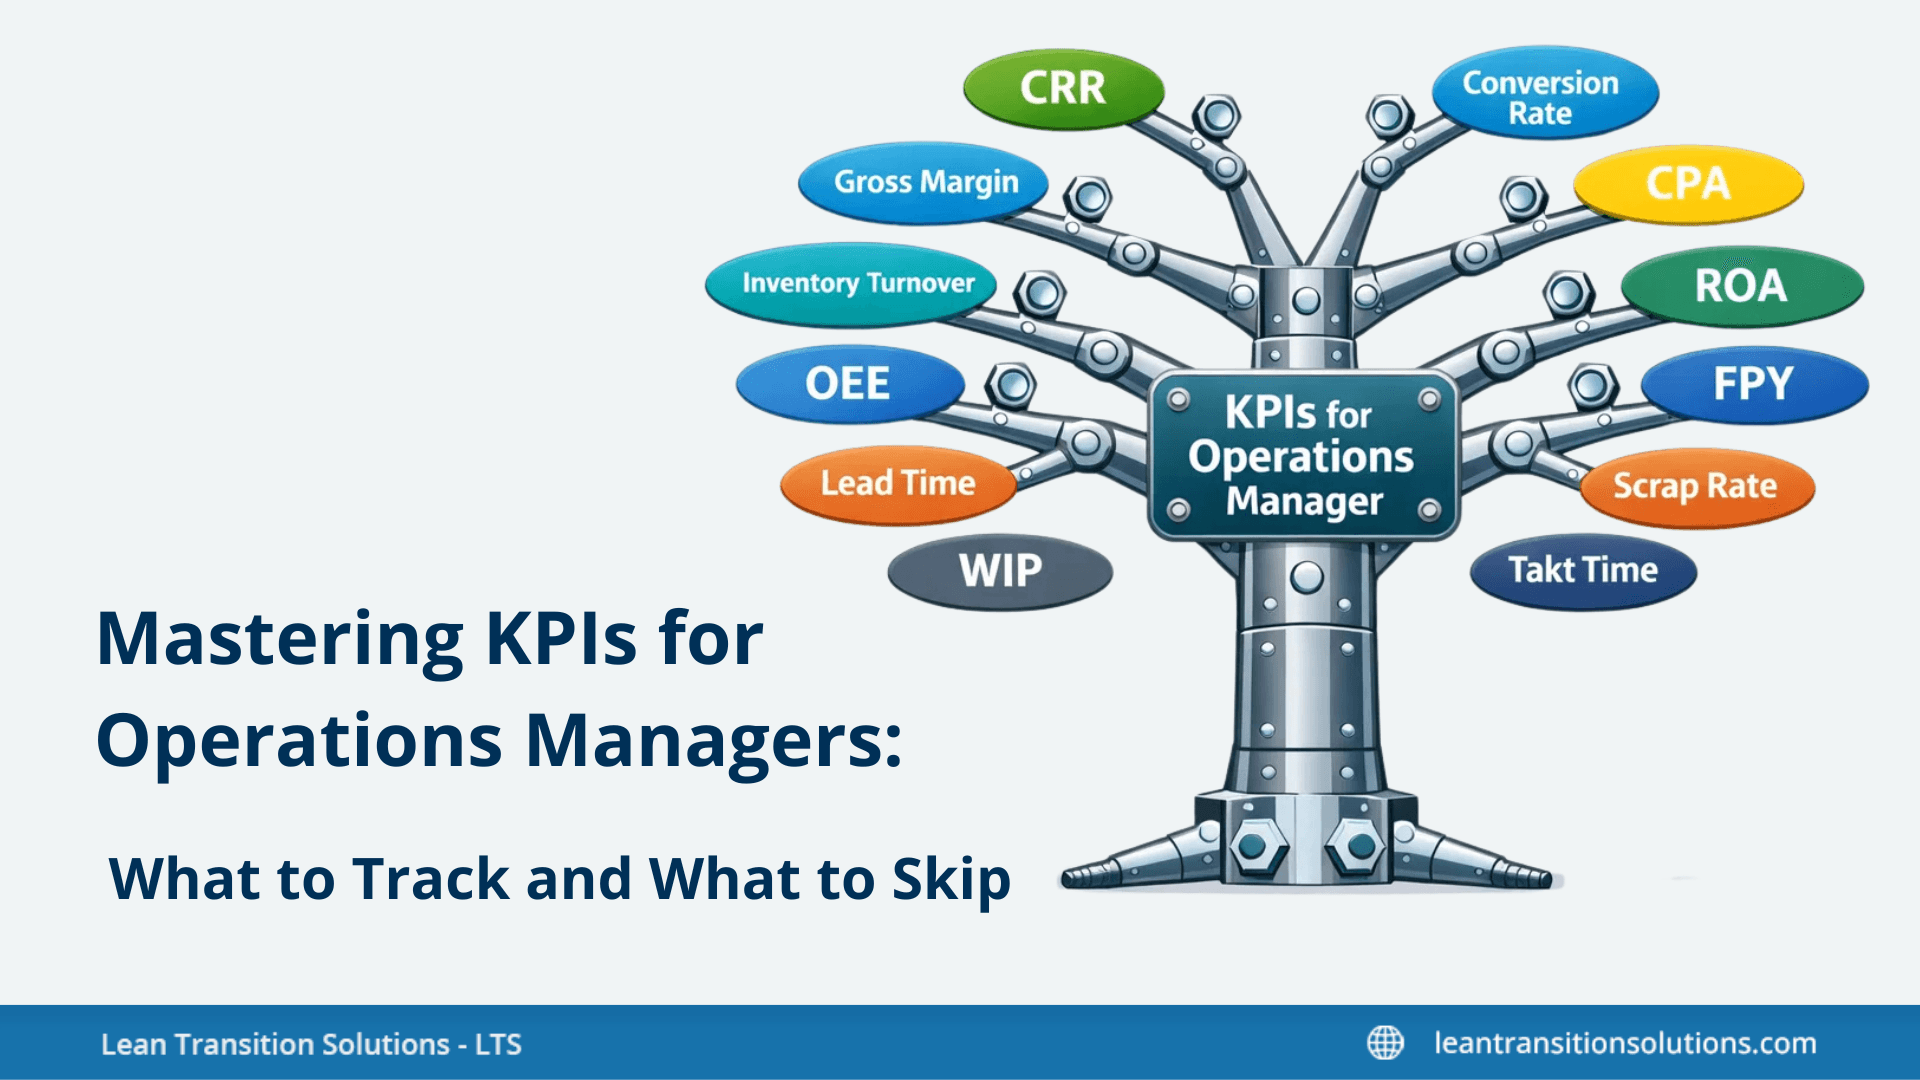
Mastering KPIs for Operations Managers: What to Track and What to Skip
Last updated on : January 6, 2026
Let’s face it — being an operations manager isn’t easy. You’re expected to keep everything running smoothly, cut costs, boost efficiency, and still hit your targets. With so much data flying around, it’s hard to know what to focus on. That’s where smart KPIs come in but only if you’re tracking the right ones. LTS Data Point makes this easier by giving you a clear, digital scorecard that helps you monitor what matters, spot issues early, and keep your team aligned with business goals. In this blog, we’ll look at the KPIs that really count and how to avoid the common mistakes that can hold your operations back.
Track KPIs for operations manager with LTS Data Point
The role of KPIs: Why do they matter?
Key Performance Indicators (KPIs) are metrics that can be calculated in numerical terms which reflect how effectively an organisation is achieving its strategic and operational goals.
KPIs play a major role in the success and growth of an industry by aiding managers in making well-informed decisions rather than simply assuming, tracking performance by monitoring progress against set targets, and securing strategic alignment by linking daily activities to overall business objectives.
By making use of KPIs, organisations can avoid guesswork, spot trends or inefficiencies early, and enhance operational efficiency through timely, detail-oriented actions.
Characteristics that make effective KPIs
So, what makes a KPI effective from the eye of an operations manager?
There's a simple rule that makes this question easy to crack. Every Key Performance Indicator (KPI) is a metrics but not every metrics can be considered a KPI. This is because KPIs are mostly quantifiable metrics that are chosen according to the critical needs of the industry. Just because RFT rate is an excellent KPI for pharmaceutical manufacturing companies or biopharmaceutical manufacturing companies does not mean it is the right choice for your organisation. Your company should choose KPIs according to your company’s needs and not on what other industries have chosen.
Let's see what makes a KPI effective.
Characteristics of an effective KPI
- Measurable: Can be calculated numerically or monitored objectively.
- Actionable: Offers insights that urge data-driven decision-making or corrective action.
- Relevant: Directly connected to business goals and preferences.
- Time-bound: Tracked over a defined period to monitor progress effectively.
Lagging vs leading indicators
KPIs are categorised mainly into four – strategic, operational, lagging, and leading. Every operations manager should be aware of these main categories, especially the difference between lagging and leading KPIs.
- Lagging indicators: Compute outcomes after they occur (e.g., revenue, defect rate).
- Leading indicators: Forecasts the future performance (e.g., number of sales calls, production cycle time). They assist in predicting results and take proactive actions.
For more details on these subcategories of KPIs and how to track them, pay a visit to our latest blog: How to Measure KPIs: All you need to know
Randomly choosing measurable metrics to be your KPI is not a clever strategy. A good KPI should align with your business goals. This aligning of KPIs with your business objectives makes sure that every metrics monitored drives meaningful results, helps teams aim on priorities, supports strategic goals, and avoids wasting resources on irrelevant measures.
Need guidance on customising KPIs?
Smart KPIs for operations manager: What makes your company unstoppable?
Measuring the right KPIs keeps your company afloat in an ocean of challenges. KPIs that are aligned with your company’s goals aid you manage the operations and detect issues before it escalates.
Let's see some of the top KPIs for operations manager in you.
Customer retention rate
Customer retention rate (CRR) calculates the percentage of customers a firm keeps over a specific period, representing loyalty and satisfaction.
- Why it matters: High retention shows strong customer relationships, lowers marketing costs for acquiring customers, and drives long-term income growth.
- How to measure: Customer Retention Rate = (Number of Customers at End of Period - Number of New Customers Acquired During Period) / Numbers of Customers at Start of Period
Gross margin
Gross margin is the difference between income and the cost of goods sold (COGS), shown as a percentage of revenue. It displays how much profit a company makes from its core operations before accounting for other expenses.
- Why it matters: Gross margin reflects pricing efficiency and production cost control, assisting businesses understand profitability, make data-driven pricing decisions, and spot areas to lower costs without compromising product quality.
- How to measure: Gross Margin % = [(Total Revenue−COGS) / Total Revenue] ×100.
Conversion rate
Conversion rate is the percentage of users or candidates who take a desired action like making a purchase, signing up for a newsletter, or completing a form.
- Why it matters: Shows how effectively a business converts interests into outcomes, helping examine marketing effectiveness, sales performance, and overall customer engagement.
- How to measure: Conversion Rate = (Amount of Conversion / Number of Website Visitors or Potential Customers) ×100
Inventory turnover
Inventory turnover calculates how many times a company sells and replaces its inventory over a fixed period, showing how efficiently it is managed.
- Why it matters: It shows operational efficiency, aids in avoiding overstocking or stockouts, and ties up less capital in unsold goods, enhancing cash flow and profitability.
- How to measure: Inventory Turnover = COGS / Average Inventory
Cost per acquisition
Cost per acquisition (CPA) is the average cost a business spends to gain a new customer through marketing or sales efforts.
- Why it matters: CPA examines the efficiency of marketing campaigns, regulate spending, and assure that customer acquisition is profitable.
- How to measure: CPA = Total Cost of Acquisition / Number of New Customers Acquired
Overall equipment effectiveness
Overall equipment effectiveness (OEE) calculates how efficiently a manufacturing process uses its equipment, combining availability, performance, and quality into a single metric.
- Why it matters: OEE underlines production bottlenecks, equipment downtime, and inefficiencies, assisting enhance productivity, minimise waste, and maximise asset utilisation.
- How to measure: OEE % = Availability % x Quality % x Performance %
➜ Availability = (Operating time / Planned production time) x 100
➜ Performance = (Ideal cycle time x Total units produced / Operating time) x 100
➜ Quality = (Good units / Total units produced) x 100
Need customised and efficient KPIs for operations manager in you?
Return on assets
Return on assets (ROA) calculates how skilfully a firm utilises its assets to generate profit, reflecting the effectiveness of asset management.
- Why it matters: It shows how well a business turns investments in assets into earnings, assisting analyse operational efficiency and compare performance across companies or periods.
- How to measure: ROA % = (Net income / Total assets) x 100
First pass yield
First pass yield (FPY) calculates the percentage of products or units that pass through a process correctly the first time without any rework or defects.
- Why it matters: FPY reflects operational efficiency and quality performance, helping minimise waste, reduce costs, and enhance customer satisfaction.
- How to measure: FPY % = (Number of units produced correctly the first time / Total units started in the process) x 100
Lead time
Lead time (LT) is the total time taken from the initiation of a function or order to its completion or delivery.
- Why it matters: Affects customer satisfaction, inventory management, and operational efficiency, assisting business identify delays and optimise processes.
- How to measure: LT = Order delivery date – Order placement date
Work in process
Work-in-Process (WIP) refers to the materials or products that are in the manufacturing process but are not yet finished goods.
- Why it matters: Managing WIP is necessary for maintaining smooth production flow, lowering inventory costs, and detecting bottlenecks in manufacturing.
- How to measure: WIP = Beginning inventory + Units started – units finished
Scrap rate
Scrap rate is the percentage of materials or products discarded during production due to defects or non-conformance.
- Why it matters: It shows production quality and efficiency, assisting in spotting waste, lower costs, and enhance overall functional performance.
- How to measure: Scrap rate % = (Scrap units / Total units produced) x 100
Takt time
It is the maximum amount of time available to manufacture one unit to fulfil customer demand. Takt time aligns production speed with customer requirements.
- Why it matters: Takt time aids in balancing workloads, remove bottlenecks, and make sure that production satisfied demand without overproduction or delays.
- How to measure: Takt time = Available production time / Customer demand
Smart KPIs enable operations managers to focus on what truly drives performance. When aligned with strategic goals, they support informed decisions, improve efficiency, and help teams stay ahead of challenges — making the business resilient and results-driven.
Be wise. Choose those KPIs that are only necessary or meaningful and are aligned to your business goals. It is also important to revise your already set KPIs as your company evolves to avoid monitoring KPIs that doesn’t make sense to your current objectives.
Common mistakes in KPI tracking and how to avoid them
Going through the former sections provided you with information on smart KPIs for operations manager of a company. But what if you end up making mistakes and your mistakes lead to huge losses? Not to worry. Let's discover some common mistakes that an operations manager might commit and how to avoid them for smooth running of your company.
- Tracking too many KPIs: Monitoring excessive metrics takes away focus and makes it difficult to recognise what truly drives performance.
- Focusing on vanity metrics: Giving importance to numbers that look impressive but don’t reflect real business impact (e.g., social media likes instead of conversions).
- Ignoring context or root causes: Viewing KPI results in isolation without analysing the factors behind them can lead to misleading conclusions.
- Not updating KPIs as processes evolve: Continuing to track outdated KPIs can result in irrelevant insights that no longer support current goals.
- Misalignment with strategic goals: KPIs that don’t tie back to the organisation’s objectives can waste resources and restrict effective decision-making.
Mistakes are fine and it happens but not detecting them and correcting them is not fine. These mistakes may not seem huge but will cost your company a great deal if not noticed and prevented quickly.
Tools and techniques to track KPIs effectively
- Software integration: Use systems like MES (Manufacturing Execution Systems), ERP (Enterprise Resource Planning), and Balanced Scorecard platforms to centralise data, automate tracking, and align KPIs with operational and strategic goals.
- Dashboards and visualisation tools: Interactive dashboards simplify data interpretation through charts, colour-coded indicators, and trend analysis, allowing faster decision-making.
- Real-time data and alerts: Continuous monitoring with live updates and automated alerts assures quick responses to deviations, helping teams maintain performance and prevent issues before they escalate.
Choose the best KPI tracking tools from LTS Data Point
Tips: How to avoid KPI overload and data fatigue?
- Prioritise critical KPIs: Focus on a small set of high-impact metrics that directly influence business outcomes, rather than tracking every possible indicator.
- Use KPI hierarchies: Organise KPIs into strategic, tactical, and operational levels to maintain clarity—strategic for long-term goals, tactical for departmental performance, and operational for daily execution.
- Review and refine regularly: Periodically assess whether each KPI remains relevant and actionable, removing or updating those that no longer align with business priorities or changing processes.
How often should an operations manager track KPIs?
Monitoring KPIs regularly is another thing. Even if you set the right KPIs and align them with your business goals and then forget to keep an eye on them, you can forget about growing your business. KPIs should be tracked regularly, and this can be done easily with KPI tracking software and tools.
1. Daily, weekly, monthly review cycles:
- Daily: Monitor real-time operational KPIs such as production output, downtime, and safety incidents.
- Weekly: Review short-term performance trends, team productivity, and process issues.
- Monthly: Evaluate strategic KPIs like cost efficiency, customer satisfaction, and overall business performance.
2. Importance of consistent reporting: Regular and structured reviews ensure accountability, allow for early issue detection, and maintain alignment across teams.
3. Adjusting frequency based on KPI type: Time-sensitive KPIs (like equipment performance or quality metrics) need frequent tracking, while long-term indicators (such as ROI or employee engagement) can be reviewed less often but in greater depth.
LTS Data Point: Efficiently and easily tracking KPIs for operations manager
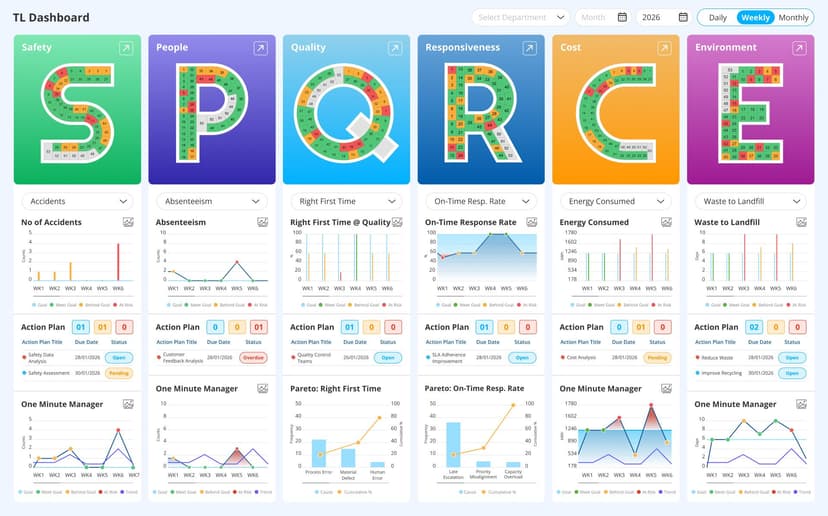
LTS Data Point allows operations managers to track, analyse, and act on KPIs seamlessly through its integrated digital performance management platform. With real-time dashboards, automated data capture from MES/ERP systems, and colour-coded indicators, it simplifies performance tracking across key areas like safety, quality, delivery, cost, and people.
The platform’s customisable Balanced Scorecards and SQCDP dashboards give managers instant visibility into trends, deviations, and improvement opportunities. Automated alerts and action-tracking tools ensure timely responses, helping teams move from monitoring performance to driving continuous improvement.
By replacing manual reports with interactive visual tools, LTS Data Point empowers operations managers to make data-driven decisions faster, align teams with strategic goals, and sustain operational excellence.
So, what are you waiting for? Give wings to your business
FAQs
1. What are KPIs and why are they important for operations manager?
KPIs (Key Performance Indicators) help operations managers measure performance, identify issues early, and make informed decisions to improve efficiency.
2. How can you choose the right KPIs for your operations?
Focus on KPIs that align with your business goals, are measurable, and provide actionable insights. Avoid tracking too many or irrelevant metrics.
3. What's the risk of too many KPIs?
Monitoring too many KPIs can lead to data overload, confusion, and a lack of focus on what truly drives performance.
4. How often should KPIs be reviewed?
It depends on the KPI. Operational metrics may need daily or weekly reviews, while strategic KPIs can be assessed monthly or quarterly.
5. What's the difference between leading and lagging KPIs?
Leading KPIs predict future performance (e.g. production cycle time), while lagging KPIs reflect past outcomes (e.g. defect rate).
6. Can KPIs be customised for different industries?
Absolutely. KPIs should be tailored to your industry, processes, and strategic objectives to ensure they’re relevant and effective.
7. What makes LTS Data Point different from spreadsheets or manual tracking?
Unlike spreadsheets, LTS Data Point integrates with systems like MES and ERP, automates data collection, and offers visual dashboards for faster insights.
8. How does LTS Data Point help with KPI tracking?
LTS Data Point provides a digital scorecard, real-time dashboards, and automated alerts to simplify KPI tracking and support better decision-making.
9. Is it necessary to update KPIs regularly?
As your business evolves, your KPIs should be reviewed and adjusted to stay aligned with current goals and challenges.