Building and automating a Digital KPI Tree for business growth

Last updated on : July 21, 2025
Only a small percentage of companies successfully cascade their goals to individual teams, leaving the remaining ones struggling with misalignment, conflicting priorities, and missed targets. What if a leadership team sets ambitious annual growth targets, but by the time these objectives trickle down to different departments, they lose clarity? The result is wasted resources, frustration, and a strategy that never fully translates into measurable success.
Yes, every team needs a structured, clear and connected way to track performance and that’s where the KPI Tree comes in. Tracking the Key Performance Indicators (KPIs) ensures every effort within an organisation directly contributes to overarching business goals. But what is a KPI Tree, and how does it connect high-level objectives to actionable metrics? Let’s discuss more about this powerful framework of performance metrics hierarchy.
Before diving into the traditional process of building KPI Trees manually, imagine if you could streamline the entire process with a digital KPI Tree-making tool. Instead of struggling with spreadsheets and disconnected data sources, the Data Point Balanced Scorecard software provide an intelligent, automated framework that aligns your KPIs seamlessly with strategic goals.
Experience the power of a Digital KPI Tree with Data Point Balanced Scorecard
Let's explore how a KPI Tree is essential for business success.
What is a KPI Tree?
A KPI Tree is a structured, hierarchical framework that visually connects high-level strategic objectives to actionable, measurable performance indicators. It helps organisations break down broad business goals into clear, trackable KPIs that cascade across departments, ensuring alignment at every level. Want to ensure you’re using the right metrics? Read our blog on OKRs vs KPIs to understand their roles in business success.
The structure of a KPI Tree
A KPI Tree is structured like an actual tree, where:
- The trunk depicts the main business goal
- The branches break this goal into key performance areas
- The Leaves represent the specific KPIs that measure success
A typical KPI Tree format consists of three levels. They are: Strategic level, Tactical level, and KPI level. Each layer answers the question: What drives the next level up?
If you’re wondering how to create a KPI Tree template specifically for your business, it’s easy! You can systematically break down your primary business objectives into detailed tactics, strategies, and measurable KPIs.
Look at the top-down flow of the KPI Tree.
- Business goal: The high-level strategic target (Strategic level)
- Primary KPIs: Key metrics that measure success (Tactical level)
- Supporting metrics: More specific indicators that impact primary (KPI level)
How to create a KPI Tree: Step-by-step process
Define top-level goals
Establish the overarching strategic objectives that align with your organisation’s mission and vision. Identify high-level business goals that reflect priorities and ensure they are specific and measurable.
Map supporting metrics
Break down top-level goals into a hierarchy of measurable, actionable metrics or KPIs. Use a performance metrics hierarchy to cascade goals into sub-objectives.
Assign ownership
Ensure accountability by designating teams or individuals responsible for each KPI by identifying which departments, or roles are best positioned to influence each metric.
Choose tools
Select software or platforms to track, visualise, and manage KPIs efficiently. Select KPI Tree software tools that offer centralised dashboards, integration capabilities and collaboration features.
Automate
Eliminate manual data entry and ensure KPIs are updated dynamically. Integrate tools to automatically pull data from source systems and to make action plans if a failure occurs.
Example of a KPI Tree format
Let's take the KPI tree example of a lean manufacturing company that wants to increase production efficiency while maintaining quality and reducing costs. Learn how we can break down this goal into actionable targets for better performance and continuous improvement.
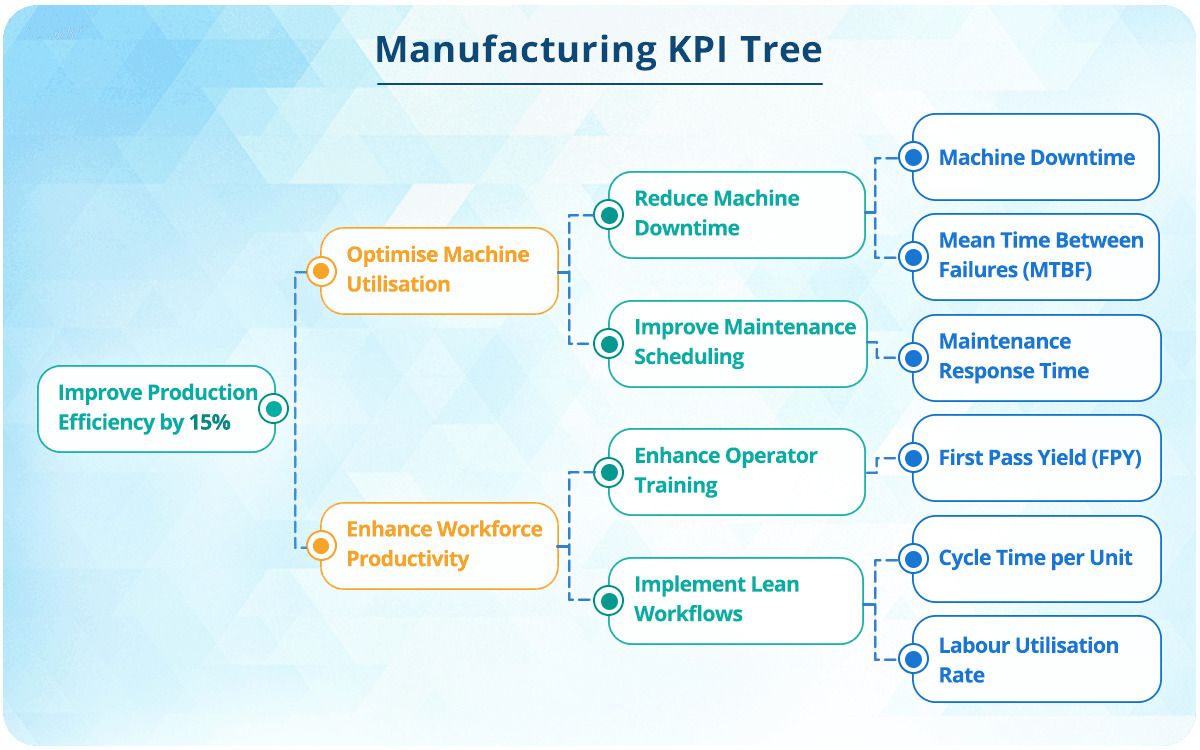
This KPI Tree diagram for a manufacturing company, structured correctly to represent the objective → strategies → tactics → measurable KPIs, making it easier to track progress and drive continuous improvement in manufacturing efficiency. Once you've built your KPI Tree, the next step is tracking KPI effectively. Learn how Manufacturing KPI Dashboards helps visualise performance in real-time.
Challenges of building a KPI Tree
While a KPI Tree is a powerful tool for aligning goals with measurable outcomes, businesses often encounter several challenges when implementing one effectively. Here are the key challenges, along with how to solve them.
• Misalignment between KPIs and business goals
A poorly structured KPI Tree may include metrics that do not align with actual business objectives.
How can you improve alignment between KPIs and business targets? Select only relevant KPIs that are connected to the intended result.
• Overcomplication: Too many KPIs dilute focus
Many organisations include too many KPIs in their tracking Tree, which makes it difficult to focus on what truly drives performance.
How can you simplify your KPI Tree? Keep it concise by limiting each goal to 3-5 meaningful KPIs.
• Resistance to change: Clinging to old tracking habits
Resistance to change: Clinging to old tracking habits
How can you encourage employees to embrace KPI Trees? Leadership must emphasise their significance and provide training on how to use them.
• Static KPI Trees that fail to adapt
Many organisations set up a KPI Tree once and fail to update it as business conditions evolve.
How can you keep your organisational KPI Tree relevant? It should be regularly reviewed and adjusted to ensure it remains up-to-date and actionable.
• Manual KPI creation is time-consuming and error-prone
Building a KPI Tree manually in Excel or paper-based systems is not only tedious but also highly prone to errors.
How can you overcome the challenges of manual KPI Tree creation? Start using digital KPI tools that automate calculations and provide real-time updates, reducing errors and improving efficiency.
• Data silos: Lack of real-time integration
Many organisations rely on disconnected tracking systems, where different departments maintain separate, isolated data.
How can you connect every department with the KPI Tree? Enter a centralised KPI system that provides a comprehensive, real-time view of business performance.
Breaking free from manual chaos: Why automating your KPI Tree is essential
In many organisations, KPI tracking still relies on outdated methods. Manually creating your KPI Tree in Excel has numerous drawbacks. Building a KPI Tree manually is not just time-consuming but also prone to errors, making it difficult to align strategies with real-time performance insights.
Teams often struggle to consolidate data from various sources, leading to delays in decision-making and a lack of visibility into critical trends. Without automation, businesses risk working with outdated metrics, missing key opportunities for improvement, and reacting too late to operational challenges.
By transitioning to an automated KPI Tree, organisations can centralise performance tracking, generate real-time insights, and create action plans based on accurate, up-to-date data—turning chaos into clarity and strategy into execution.
Benefits of Digital KPI Tree in modern business
Switching from a traditional, manual KPI Tree to a digital one brings numerous advantages. Here’s how a digital KPI Tree can transform performance management:
- Automatically updates KPIs with live data
- Integrate Data seamlessly
- Triggers corrective actions based on KPI trends
- Automatically cascades goals across departments and teams
- Proactively address issues before they escalate
- Bring a centralised platform to track business goals
- Uses AI and data analytics to identify areas for improvement
What’s the best way to track KPIs? Data Point has you covered
Are you looking for the best KPI Tree Tool to overcome challenges in strategic misalignment? We have got you covered. Data Point Balanced Scorecard software changes the game.
Designed for seamless KPI management, Data Point is more than just a digital KPI Tree tool—it is a comprehensive performance management solution. From strategic planning to real-time tracking, it enables organisations to visualise goals, monitor progress, and drive continuous improvement. Unlike traditional methods, Data Point doesn’t just display numbers; it creates a structured and action-driven ecosystem for KPIs.
For better KPI tracking and measurement, Data Point provides:
- Customised reporting & dashboards: Tailor reports and visual dashboards to focus on the KPIs that matter most to your business.
- Strategic map creation: Clearly define and communicate your strategy with interactive maps that align objectives across teams.
- Objective flow chart: Ensure clear goal alignment.
- Automated action plan generation: Proactively address performance gaps before they escalate.
- Pareto analysis: Helps prioritise critical issues.
- Bowling charts, SQCDP, and FCIL boards: For advanced visual insights.
Let's take a look at the difference between the traditional KPI creation and tracking process and the digital process. In this comparison, the traditional KPI Tree represents manual creation using spreadsheets and outdated tools, while a digital KPI Tree showcases the capabilities of Data Point and how the software outperforms traditional methods by automating the process.
Traditional vs. Digital KPI tracking: Key differences
Digital KPI Trees: The future of performance management
Building a KPI Tree is essential for aligning strategic goals with actionable metrics, ensuring every team’s efforts contribute to overall success. A Digital KPI Tree, which replaces the manual KPI creation and tracking process, streamlines organisational performance through real-time tracking, automated insights, and seamless integration.
Yes, now is the time to level up your KPI management. With Data Point Balanced Scorecard, you get a smarter, more connected way to manage KPIs and execute your strategy with confidence. Ditch the complexity and make achieving operational excellence effortless.
Take control of your KPIs—Start tracking Ssmarter with Data Point!
FAQs
1. How does the KPI Tree enhance performance?
A KPI Tree enhances organisational performance by breaking down high-level goals into measurable metrics, ensuring clear alignment across teams.
2. What is the use of the KPI Tree?
KPI Trees provide a structured approach to achieving organisational goals. They help visually map out targets and associated metrics.
3. How do you Analyse a tree diagram?
To analyse a KPI Tree diagram, start from the top-level objective and break it down into strategies, tactics, and measurable KPIs. Evaluate each KPI’s contribution to the overall goal, identify trends, spot bottlenecks, and compare real-time data against targets.
4. What is the purpose of the KPI scorecard?
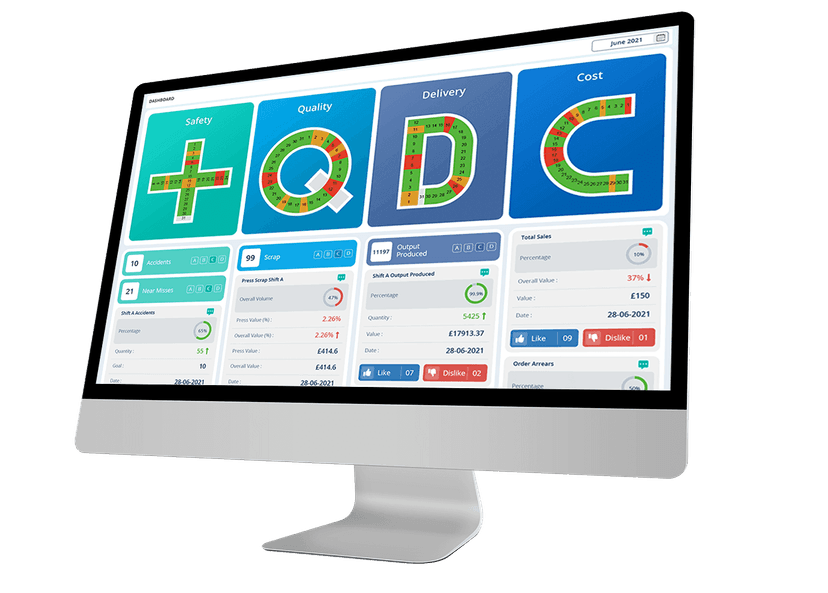
The purpose of a KPI scorecard is to track, measure, and visualise Key Performance Indicators (KPIs) in alignment with business objectives.
5. What is a Digital KPI Tree?
A Digital KPI Tree is a smart, interactive way to connect big business goals with the day-to-day metrics that drive success. Instead of manually tracking data, it updates in real-time, giving a clear picture of performance and helping teams stay aligned and take action faster.

Geandra Queiroz, Operations Management Consultant
Geandra is an Operations Management Consultant at Lean Transition Solutions, specialising in Lean philosophy, Lean Six Sigma, and strategic planning across manufacturing and healthcare. She is currently completing her PhD in Industrial Engineering at the Federal University of São Carlos, researching the integration of Operations Strategy, Lean, and Green Manufacturing.