What is KPI tracking: A comprehensive guide
Understand KPI tracking to drive performance, align teams, and fuel organisational growth.
Contents
- An Introduction to KPI tracking: What is KPI Tracking?
- Why is KPI tracking critical? Importance of KPI tracking for business success
- Benefits of KPI tracking
- Problems of KPI tracking
- Common challenges in
- Why KPI tracking often fails (And how to avoid it)
- Step-by-Step guide to setting up a KPI tracking system
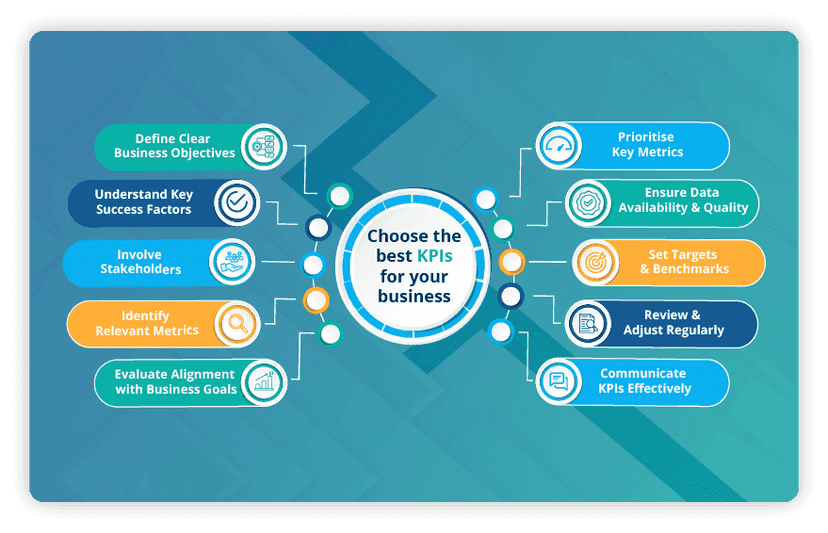
- Building your KPI library: Choosing the KPIs that actually matter for tracking
- How to track KPIs effectively?
- Daily, weekly, and real-time KPI tracking: What works best?
- & methods
- Must-have features in
- & Dashboards for 2025
- Established KPI tracking methods (Still widely used in 2025)
- Real-world KPI examples and case studies from leading industries
- Getting started with KPI tracking: How to do it right
- Best practices for long-term KPI tracking success
- Data Point Balanced Scorecard software – Your perfect KPI tracking solution
Last updated on : July 16, 2026
An Introduction to KPI tracking: What is KPI Tracking?

KPI tracking is the ongoing process of monitoring, measuring, and evaluating Key Performance Indicators (KPIs) to assess how effectively a business is achieving its objectives.
Why is KPI tracking critical? Importance of KPI tracking for business success
Tracking KPIs ensures that teams stay aligned with strategic goals and can make data-driven decisions to continuously improve performance.
The idea echoed by the business leader Thomas Monson, is the heart of key performance monitoring. KPI tracking helps to set the right process to steer the business in right direction.
The process of KPI tracking
Every successful business starts by setting clear goals -what it wants to achieve. These goals are then broken down into smaller, specific targets for different teams or departments. That’s where KPIs come in. They are the measurable numbers that show whether the teams are on the right path. Once KPIs are defined, the business tracks them on a regular basis—daily, weekly, or monthly. This is KPI tracking.
Tracking KPIs regularly is inevitable because:
- It shows how well you’re progressing towards your goals.
- It helps spot what’s working and what’s not.
- It identifies bottlenecks - where things slow down or go wrong.
- It guides decision-making by providing real data, not just guesses.
- It encourages accountability and improvement across the organisation.
More than just charts and dashboards, KPI tracking builds a performance culture - one where actions are tied to outcomes and continuous improvement becomes second nature.
Benefits of KPI tracking
Effective metric tracking helps businesses:
- Measure progress against objectives in real-time
- Improve decision-making with accurate, up-to-date insights
- Align teams with common business KPIs and priorities
- Identify performance gaps before they become bigger problems
- Drive accountability across departments and roles
- Stay agile in a competitive, data-driven marketplace
- Ensure continuous improvement
Problems of KPI tracking
KPI tracking isn’t difficult because numbers are hard. It is difficult because what you track, how you track it, and what you do with the KPI insights requires clarity, discipline, and consistency.
Even organisations with the right tools sometimes struggle to get meaningful value from their KPI monitoring efforts. Let’s explore the common roadblocks and why even the best KPI strategies fail without the right support.
Common challenges in KPI tracking
Despite its potential, measuring business KPIs often runs into predictable problems:
- Too many KPIs, not enough focus
Teams try to track everything, leading to cluttered dashboards and lack of clarity on what truly matters.
- Poorly defined KPIs
Vague or misaligned metrics can’t tell you if you’re succeeding or drifting off course.
- Manual tracking processes
Relying on spreadsheets or disconnected data makes performance monitoring slow, error-prone, and outdated.
- Lack of ownership
If no one owns the metric, it gets ignored. Without accountability, improvement stalls.
- Siloed data
When each department tracks their own numbers independently, it’s hard to align business performance tracking across the company.
Why KPI tracking often fails (And how to avoid it)

KPI measurement fails not because it’s a flawed concept — but because it’s often treated as a one-time setup, rather than a living process.
Here’s why it breaks down:
- Misalignment with strategy
KPIs must reflect the actual goals of the business. If they don’t map directly to strategy, they’re just numbers on a screen.
How to avoid it: Always start with strategic intent. Use a KPI tracking framework that ties each indicator to a clear business objective. If a KPI doesn’t answer “why these matters,” it doesn’t belong.
- Lack of action
Tracking performance indicators is only valuable if there’s a culture of acting on them. Without a feedback loop, nothing changes.
How to avoid it: Create actionable plans for underperforming KPIs. Involve teams in brainstorming corrective measures, assign owners, and review progress regularly to close the feedback loop.
- No regular review
Metrics need consistent attention. Sporadic reviews lead to missed trends, delayed corrections, and wasted data.
How to avoid it: Set a review rhythm. Whether it’s daily KPI tracking for operations or monthly reports for strategic goals, consistency keeps the system alive and effective.
- Over-reliance on lagging indicators
Many companies track only results (like sales or output), not the activities that drive them (like response time, machine uptime, or customer engagement).
How to avoid it: Balance lagging KPIs with leading indicators. This gives you time to course-correct before results are impacted.
- Poor data quality or inconsistency
Outdated, incomplete, or conflicting data makes even the best-designed KPI dashboard meaningless.
How to avoid it: Standardise data entry, automate data collection where possible, and validate sources regularly. A reliable KPI tracking system starts with clean, real-time data.
- Lack of KPI ownership
When no one is accountable for a KPI, it loses relevance. It becomes “someone else’s job,” and performance slips through the cracks.
How to avoid it: Assign clear ownership to each KPI. Someone should be responsible for monitoring it, explaining fluctuations, and driving improvements.
Struggling with KPI tracking gaps?
Try real-time KPI tracking with visual dashboards of Data Point Balanced Scorecard.Step-by-Step guide to setting up a KPI tracking system

Creating an effective KPI tracking system isn’t just about selecting metrics—it’s about building a performance measurement culture that drives progress. Here’s a proven step-by-step approach to help you get started the right way:
Define strategic goals clearly
Every KPI must link directly to a business objective. Whether it's improving customer satisfaction, increasing productivity, or reducing downtime, clarity is key.
Identify meaningful KPIs
Avoid vanity metrics. Choose KPIs that are specific, measurable, and action-oriented—like production cycle time, customer resolution rate, or cost per unit.
Assign ownership
Each KPI needs a responsible owner. When someone is accountable, the chances of ongoing monitoring and action dramatically improve.
Choose the right tracking method
Select tools that fit your needs—manual spreadsheets, visual management boards, or automated KPI tracking software. The more real-time the insight, the faster the response.
Set realistic targets
Base your targets on current performance, industry benchmarks, or continuous improvement goals. Unreachable KPIs can demotivate teams.
Create a visual dashboard
Use simple visuals like charts, heatmaps, or digital dashboards to make performance insights accessible and actionable at a glance.
Establish tracking frequency
Decide how often KPIs will be monitored—daily, weekly, monthly, or real-time—based on their importance and nature.
Build review routines
Integrate KPI reviews into daily stand-ups, weekly team meetings, or monthly strategic check-ins to ensure they're part of ongoing conversations.
Analyse trends and take action
KPI tracking is useless without action. Focus on trends, not just snapshots, and use them to spot issues, trigger improvements, or realign strategies.
Ensure data integrity
Make sure your data sources are accurate, consistent, and secure. Poor data quality will mislead decisions and damage trust in the system.Welcome to Online Text Editor (formerly EditPad.org) - your online plain text editor. Enter or paste your text here. To download and save it, click on the button below.
In 2025, business success needs effective KPI tracking
Build a future-ready system with real-time insights and aligned goals using Data Point Balanced Scorecard.Building your KPI library: Choosing the KPIs that actually matter for tracking
In many organisations, tracking performance indicators falls short not because of a lack of effort—but because people are tracking too many things, or the wrong things altogether. That’s where a KPI library becomes essential.
What is a KPI library?
A KPI library is a centralised, curated collection of Key Performance Indicators used across your organisation. It acts as your performance measurement toolkit—categorised by department, function, or business objective.
Rather than reinventing KPIs every time a new goal is set, teams can refer to the library to:
- Find predefined KPIs relevant to their role or process
- Understand what each KPI measures, why it matters, and how to interpret it
- Align tracking methods and ownership across departments for consistency with a solid KPI library:
- Everyone speaks the same performance language
- Cross-departmental comparisons become meaningful
- KPIs can be linked back to strategic goals more clearly
- Data tracking is repeatable, standardised, and scalable
Yes, you can make a traditional KPI libraries on Excel and Google Sheets. But are you curious to go beyond it? Discover how modern organisations in 2025 are creating dynamic, centralised KPI libraries.
How to track KPIs effectively?
How often should you monitor KPI performance?
Effective KPI tracking doesn’t end with the right tool - it also requires the right review frequency. The timing of performance reviews must be carefully planned, as it varies across industries, processes, and the types of KPIs being monitored. Reviewing KPIs too frequently or too early can lead to incomplete conclusions and inaccurate assumptions.
Daily, weekly, and real-time KPI tracking: What works best?
The right frequency of monitoring depends on the nature of the KPI and the speed at which the process changes. Here's how to think about it:
- Daily KPI tracking
Best for frontline operations, production, and customer service metrics.
Use when: Quick reaction is needed, such as monitoring defects, downtime, or ticket resolution.
- Weekly KPI measurement
Ideal for team-level performance reviews and short-term tactical tracking.
Use when: You're managing sprints, weekly output, or sales activities.
- Real-Time KPI tracking
Suited for fast-moving environments like manufacturing, logistics, or IT support.
Use when: Immediate visibility is critical — for safety, quality, or equipment health.
- Monthly or quarterly KPI reviews
Best for strategic KPIs — revenue, profitability, market share, or project milestones.
Use when: High-level trends matter more than daily fluctuations.
KPI tracking tools & methods
The limits of Excel in effective KPI tracking: Why it can’t keep up with KPI measurement in 2025
Spreadsheets like Excel have long been the go-to tool for monitoring key metrics due to their flexibility and low cost. However, in 2025, they fall short for most mid- to large-sized organisations and data-driven teams.
Here’s why Excel alone no longer meets business demands:
- Lack of real-time data: Excel doesn’t support live data connections unless heavily customised. That means performance is always reviewed after the fact, not as it happens.
- Error-prone: Manual data entry increases the risk of formula errors, duplication, and broken links—jeopardising decision-making.
- Version control issues: With multiple team members updating local copies, it's easy to lose track of the “single source of truth.”
- No automation: Excel can’t auto-alert users when KPIs breach thresholds or automatically generate reports unless heavily scripted.
- Poor integration: Integrating ERP, MES, CRM, or other operational tools with Excel requires manual data transfers or third-party plugins.
- Limited scalability: As data volume and complexity grow, Excel becomes harder to maintain and slower to process.
- Weak collaboration: It lacks the collaborative environment modern teams need for assigning actions, commenting, and tracking resolutions.
In short, Excel still has a place for simple reports and standalone teams—but it’s not designed for agile, cross-functional KPI measurement in today’s connected business environments.
Must-have features in modern KPI tracking software

To truly support strategy and operational excellence, KPI tracking tools in 2025 must go beyond static reporting or Excel sheets. The most effective systems offer:
- Live dashboards – Real-time visualisation of KPIs via charts, graphs, gauges
- Threshold alerts – Auto-notifications when KPIs cross set limits
- Role-based views – Customised dashboards for executives, managers, and frontline teams
- Data integration – Connects to ERP, CRM, MES, HRMS, etc.
- AI-Powered Insights – Automatically detect anomalies, patterns, and improvement opportunities with machine learning.
- Drill-down capability – Explore from high-level metrics into root causes
- Mobile access – Enables decision-making on the go.
- Collaborative tools – Commenting, task assigning, or action linking
- Custom KPI templates – Pre-built or user-defined structures
- Automated reporting – Scheduled and exportable reports
- Security & access control – Protects sensitive business data
- Forecasting & trend analysis – Predict future performance based on current data
Best KPI tracking tools & Dashboards for 2025
In 2025, KPI tracking has become real-time, cloud-enabled, and role-specific. Businesses are embracing tools that automate data capture, visually display insights, and integrate with daily operations to support faster, data-driven decisions. Below are the latest tools and methods shaping KPI tracking in 2025.
➤ Digital KPI tools & Software
These tools focus on automation, real-time visibility, and integration with various systems like ERP, MES, CRM, and HRM. They're used to centralise KPI data, provide alerts, and visualise progress.
Look at the different types of digital KPI tracking tools:
- Real-time tracking dashboards – Provide instant visibility of KPIs through charts and colour-coded signals. Ideal for operational and tactical KPIs where fast decisions are needed.
- Automated monitoring systems – Reduce manual work by pulling live data from various sources and trigger alerts when KPIs fall outside of thresholds.
- Balanced Scorecard (BSC) Software The balanced Scorecard software is built on the Balanced Scorecard framework approach which is a strategic tool that links KPIs to four key business areas: Financial, Customer, Internal Processes, and Learning & Growth.
- AI-powered KPI analytics – Advanced systems now use AI to detect patterns, predict risks, and suggest corrective actions based on KPI behaviour. This supports proactive management rather than reactive fixes.
- Role-based portals – Dashboards tailored to user roles (e.g. managers, team leads, executives), helping each level of the organisation focus on relevant KPIs tied to their goals.
- Mobile-enabled trackers –These allow users to view live KPI updates, receive push notifications, and participate in performance reviews from remote locations—supporting hybrid and field-based teams.
- Cloud-Based KPI Dashboards (Real-time & Interactive) Visual, always-on dashboards using charts, gauges, and trends to display performance metrics. Ideal for operational teams and daily management.
- Specialised KPI Tracking Software Focused tools for departments like sales, finance, production, or customer service. Features include alert triggers, reporting templates, and benchmark comparisons.
- Integrated Performance Platforms Pull performance data from multiple software tools into one dashboard. Enables company-wide visibility, cross-functional analysis, and strategic forecasting.
Established KPI tracking methods (Still widely used in 2025)
Not all KPI tracking relies on large-scale digital platforms. Many teams in 2025 continue to use flexible, often hybrid methods. Here are some proven KPI tracking methods for organisations:
➤ Visual tracking & Operational methods
Real-time visibility enhances team awareness, accountability, and ownership of results. These tools make KPIs more tangible and actionable:
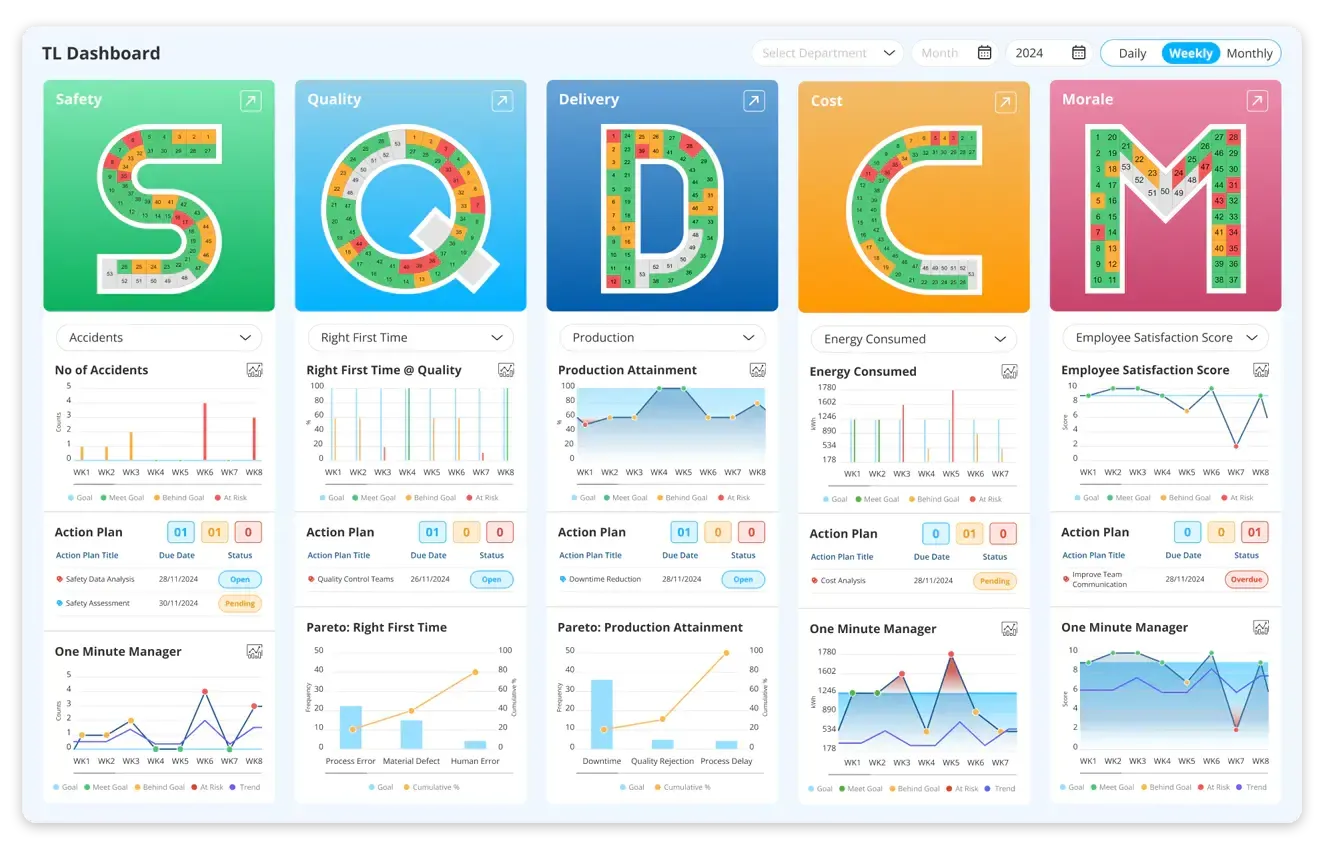
- Short Interval Management (SIM): Using Short Interval Control Boards (SICB), teams monitor KPIs at high frequency (hourly, per shift, or daily). Issues are identified and resolved within the interval—ideal for manufacturing and operations.
- Visual Management Boards: Boards like SQCDP, Gemba Boards, Digital TCards, or Hoshin Kanri X Matrix boards display KPIs, status updates, and actions. This foster team engagement and improve floor-level responsiveness.
- Andon systems: Used in manufacturing and service industries, Andon systems visually alert teams to quality or process issues via lights, sounds, or display panels. This real-time feedback loop supports immediate action when KPIs fall below target.
- Obeya rooms: A central space (physical or digital) where project or strategic KPI data is displayed for cross-functional teams to review progress, issues, and actions collaboratively. Commonly used in Lean and Agile environments.
- Wall-mounted KPI displays & TV dashboards: Large displays in departments or production areas show live performance data (like productivity, downtime, or sales numbers), keeping teams aligned and promoting real-time awareness.
➤ Strategic analysis & Improvement methods
These methods help teams not just track KPI performance but understand why results deviate, identify root causes, and define strategic responses to drive continuous improvement.
- Benchmarking: Comparing internal KPIs with industry standards or competitors helps identify performance gaps and opportunities for improvement.
- Root Cause Analysis (RCA): When KPIs drop, tools like the 5 Whys, Fishbone Diagram, or Pareto Analysis help uncover root causes and ensure long-term fixes—not just short-term patches.
- Strategic review workshops: Scheduled (often quarterly) reviews with cross-functional leaders to assess strategy-KPI alignment, progress against objectives, and whether current actions are producing results. These meetings often spark realignment or priority shifts.
- Leading vs Lagging indicator reviews: Analysing how leading indicators (like training hours or pipeline leads) are affecting lagging indicators (like revenue or productivity). This helps organisations shift from reactive to proactive decision-making.
- Scenario planning & Forecasting: Using KPI trends and business intelligence tools to model different future outcomes. This is especially useful for planning around external uncertainties or large strategic shifts.
Real-world KPI examples and case studies from leading industries
Are you from Manufacturing, Automotive, Healthcare, Energy, Electronics, Banking or from any other sector? And wondering how a KPI tracking system could improve your operations?
No matter the sector, measuring business KPIs are the backbone of progress. But theory alone doesn’t spark action, but examples do.
Below, we’ve highlighted three real-world scenarios across different industries to show how organisations turn raw data into smarter decisions through KPI tracking. These aren’t just about tools — they’re about outcomes.
Let’s explore how KPI tracking plays out in real life:
KPI Tracking in the manufacturing sector: How real-time visibility transformed a UK automotive company
In the heart of the UK’s industrial corridor, a fast-growing automotive components manufacturer was struggling to meet rising customer demand. Despite solid workforce effort, they faced delayed deliveries, growing quality issues, and no reliable way to understand what was going wrong — or when. While machines were running and reports were available, the company lacked a real-time KPI tracking system that could bring clarity to performance.
➤ Challenge
Production leaders relied on manual spreadsheets updated at the end of each shift. By the time data was reviewed, problems had already compounded. Key decisions were reactive — and not based on live insights from the shop floor.
➤ The KPI tracking solution
The company deployed a shop floor KPI tracking system to track manufacturing KPIs and integrated with their MES (Manufacturing Execution System). Their focus was on real-time visibility and root cause identification.
➤ KPIs tracked:
- Cycle time (per product type)
- OEE (Overall equipment effectiveness)
- First pass yield (FPY)
- Downtime by cause code
➤ What they did:
- Installed IoT sensors on machines to automatically capture run time, downtime, and production count.
- Used a digital KPI dashboard to display metrics on large shopfloor monitors — updated every 15 minutes.
- Incorporated daily tier meetings where supervisors reviewed KPIs, identified abnormalities, and escalated issues via a visual problem board.
- Created a KPI ownership system — each production line had a leader responsible for reporting and investigating performance deviations.
➤ Impact:
- Throughput improved by 20% within two months.
- Downtime reduced by 27% after root causes were consistently logged and addressed
- Quality rework dropped, as real-time FPY tracking led to early detection of errors.
Ready to boost manufacturing efficiency with real-time KPI tracking?
KPI tracking in the Banking Sector: How data-driven monitoring improved customer retention and service efficiency
A mid-sized retail bank in the USA was seeing a steady decline in customer satisfaction scores, especially across its digital services. The management had access to numerous reports, but they lacked a focused, timely method to track the right performance indicators that actually impacted service delivery and customer loyalty.
While the data existed, it was fragmented across departments — making it difficult to respond quickly or spot emerging issues.
➤ Challenge
Customer complaints were increasing, NPS (Net Promoter Score) was falling, and the team couldn’t pinpoint what was causing service bottlenecks. Most KPIs were lagging, reviewed monthly, and not tied directly to customer journey touchpoints — a missed opportunity in a competitive market.
➤ The KPI tracking solution
To regain control, the bank launched a daily KPI tracking initiative focused on aligning operations with customer experience metrics. They identified banking KPIs and executed the plan.
➤ KPIs tracked:
- Customer retention rate
- Net Promoter Score (NPS)
- Loan Processing Turnaround Time (TAT)
- Compliance violation rate
- Account opening drop-off rate
➤ What they did:
- Created a centralised KPI monitoring dashboard for department heads, refreshed weekly.
- Set up daily email digests for frontline teams showing real-time data on customer interactions and pending tasks.
- Connected CRM, KYC systems, and internal ticketing platforms to the KPI engine to provide full journey visibility.
- Used a monthly performance review with heatmaps to identify weak-performing branches and define localised action plans.
➤ Impact:
- Loan approval time dropped, increasing application volume
- Customer satisfaction rose by 18 points, driven by quicker resolutions
- A new compliance alert system helped reduce violations by 40% in 6 months
Experience KPI tracking designed specifically for banking and finance
KPI tracking in Healthcare: How real-time monitoring reduced patient wait times and improved clinical outcomes
n a busy urban NHS hospital trust in the UK, patient satisfaction was steadily declining. Staff were overburdened, emergency wait times were increasing, and clinical delays were becoming more common. The organisation had no shortage of health data—but lacked a cohesive KPI monitoring system to make sense of it in real time.
Most of their performance measures were reviewed retrospectively during quarterly audits. By then, it was too late to act on root causes or fix systemic inefficiencies.
➤ Challenge
Long patient waits times, rising readmission rates, and inconsistent care coordination were major concerns. The hospital leadership team knew these were symptoms of deeper inefficiencies, but without day-to-day visibility of health care KPIs including clinical and operational metrics, targeted interventions were difficult.
➤ The KPI tracking solution
The hospital deployed a digital KPI tracking solution that enabled real-time visibility across departments. Rather than rely solely on clinical audit cycles or lagging indicators, they embedded a daily monitoring system focused on operational flow, patient experience, and staff efficiency.
➤ KPIs tracked:
- Emergency room wait time
- Treatment adherence score (based on protocol checklists)
- Average Length of Stay (ALOS)
- Patient satisfaction index
- Readmission rate
➤ What they did:
- Created a real-time KPI board in every critical unit, with clear red-yellow-green indicators for key metrics.
- Empowered nurse leads to record compliance with standard operating procedures during rounds using tablets.
- Used a hospital-wide dashboard with weekly summary reports for executive review and quarterly performance mapping.
- Introduced cross-department huddles to resolve bottlenecks collaboratively — e.g., delays in patient discharge or lab reporting.
➤ Impact:
- ER wait times reduced by 26%, with staffing adjusted based on KPI trends
- Checklist adherence improved, boosting treatment consistency
- Patient satisfaction scores rose, particularly in post-op and discharge feedback
Transform your healthcare performance with real-time KPI insights
Getting started with KPI tracking: How to do it right
Still relying on spreadsheets or gut feeling to measure performance? Many businesses hesitate to implement KPI tracking systems due to fears around complexity, unclear ROI, or even data security concerns. No worries with the right structure and safeguards in place, even a small team can establish a robust, secure, and scalable KPI monitoring framework that aligns with strategic goals.
Below, we’ll walk you through practical steps to build your KPI tracking system and share best practices that ensure long-term success.
Best practices for long-term KPI tracking success
Launching a KPI tracking system is just the beginning—maintaining its effectiveness over time is what leads to real operational improvement. Here are essential best practices to sustain performance tracking and maximise strategic value:
- Keep KPIs relevant as business evolves Your business isn’t static—your KPIs shouldn’t be either. Regularly re-evaluate your performance indicators to ensure they reflect current goals, market conditions, and internal changes.
- Focus on a balanced set of KPIs Don’t overemphasise one area. Use a mix of leading and lagging indicators across financial, operational, customer, and process performance. This creates a more holistic view and prevents tunnel vision.
- Invest in secure, scalable KPI tracking tools As your business grows, spreadsheets and manual tracking may fall short. Leverage secure KPI tracking software that supports data integration, real-time dashboards, role-based access, and audit trails to reduce risk and scale confidently.
- Make KPI tracking a team habit, not a report Don’t let KPIs become “management-only.” Encourage team involvement in reviews, improvement suggestions, and problem-solving. This builds ownership and drives frontline accountability.
- Set a rhythm and stick to it Whether it’s daily stand-ups, weekly reviews, or monthly strategic sessions, consistency builds momentum. Sporadic tracking leads to reactive—not proactive—management.
- Learn from patterns, not just numbers Trends tell the real story. Encourage teams to go beyond surface-level results and ask “why?” when metrics shift. This turns data into insight—and insight into action.
- Celebrate wins and recognise efforts Use KPIs to not only flag problems but also highlight achievements. Recognising team success based on measurable results fosters a high-performance culture.
- Protect data privacy and governance As KPI tracking tools become more advanced, ensure you follow data security protocols. Especially in industries like healthcare or finance, compliance and trust are non-negotiable.
Data Point Balanced Scorecard software – Your perfect KPI tracking solution
All the best practices before truly deliver results when supported by the right solution Here is where the Data Point Balanced Scorecard comes in.
Data Point Balanced Scorecard is more than a KPI tracker — it’s a comprehensive operational excellence system designed to help organisations monitor, manage, and continuously improve performance at all levels with lean integrated solutions.
Data Point provides tools and features to help you:
➤ KPI management
- Centralised KPI library
- Role-based ownership and accountability
- Target vs. actual trend analysis
➤ Real-time KPI tracking
- Live dashboards to monitor metrics as they happen
- Instant visibility into performance gaps
- Custom alerts for underperforming KPIs
➤ Strategic alignment with KPI bowling dashboards
- View KPIs by strategic objectives
- Use colour-coded bowling charts for easy status updates
- Link actions and owners to each KPI
➤ Action plans & Root cause tools
- Assign actions directly from underperforming KPIs
- Add notes, due dates, and progress updates
- Built-in tools: Root Cause Analysis, 5 Whys, Pareto Analysis, Hoshin Kanri X matrix, Fishbone Diagrams.
➤ Continuous improvement frameworks
- Embed frameworks like SQCDP, SQDCM, SDDC, or SQDIP directly into your huddle boards
- Enable daily reviews, visual targets, and corrective actions
- Adapt templates to your operations — manufacturing, service, healthcare, logistics and more
➤ Project management integration
- Link KPI gaps to improvement projects
- Track project timelines, milestones, and ROI
- Prioritise based on impact and urgency
➤ Visual management boards
- Digital Huddle Boards for team updates
- Highlight wins, bottlenecks, and critical metrics
- Enable transparent team communication and accountability
➤ Data security & Access control
- Role-based access ensures sensitive KPI data is secure
- Built-in audit trails and version control
Ready to Turn Metrics into Momentum? Start your journey with Data Point—your complete Balanced Scorecard and KPI tracking solution.