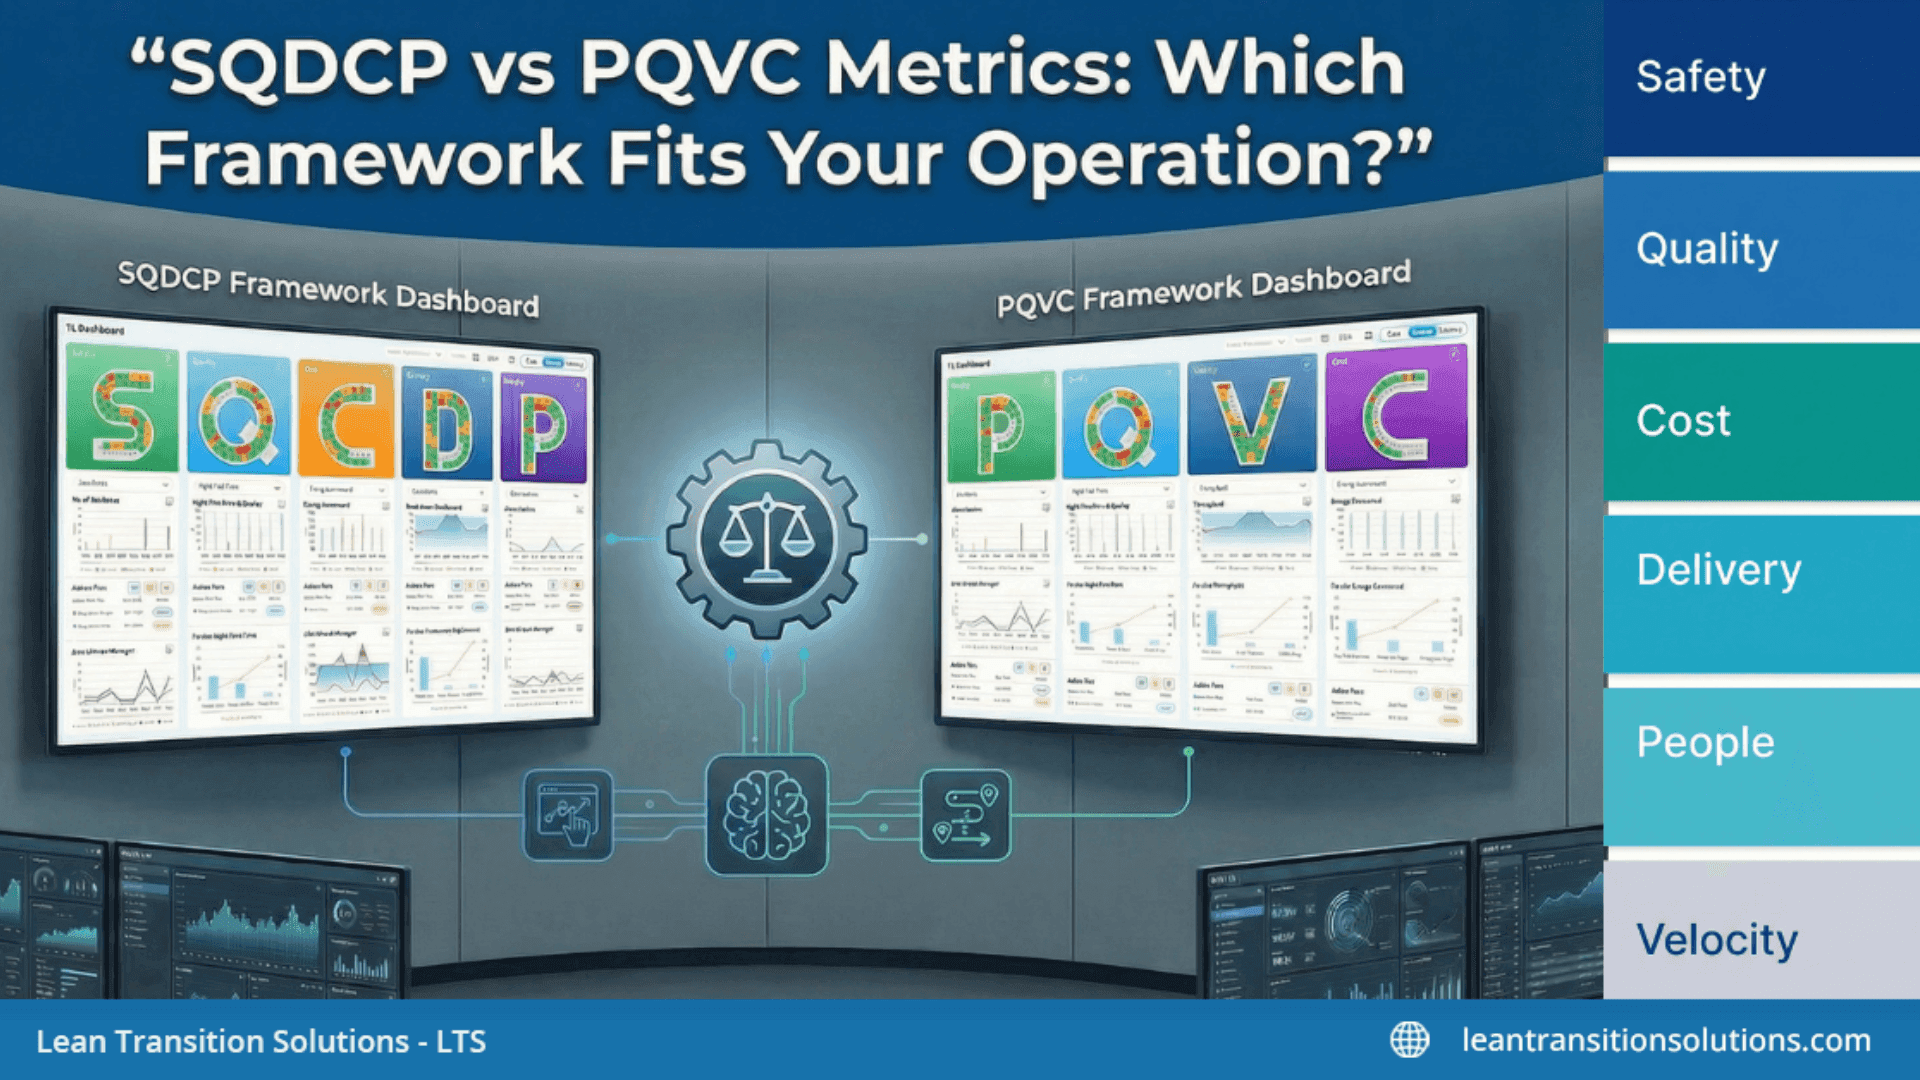
SQDCP vs PQVC Metrics: Which Framework Fits Your Operation?
Last updated on : February 4, 2026
What is the difference between SQDCP and PQVC?
PQVC (People, Quality, Velocity, Cost) and SQDCP also called SQCDP (Safety, Quality, Delivery, Cost, People) are operational performance frameworks or lean daily management frameworks that track multiple dimensions simultaneously to maintain balanced production and service delivery.
The primary differences:
Both frameworks achieve the same goal: preventing trade-offs where improving one metric degrades another (e.g., cutting costs but harming quality).
Why does SQDCP or SQCDP put Safety first?
SQDCP frameworks place Safety as the first metric to signal organisational priority and non-negotiability.
The philosophy behind Safety-first ordering
In high-risk industries like automotive manufacturing, chemical processing, and construction, safety incidents can:
- Result in fatalities or permanent injuries
- Halt entire production lines
- Create regulatory penalties
- Damage brand reputation irreparably
By making Safety a standalone category at the top of every dashboard, SQDCP reinforces that:
- Production never justifies unsafe conditions
- Safety metrics get reviewed before any other performance discussion
- Safety ownership is clear and separated from general workforce management
How PQVC handles safety differently
PQVC embeds safety within the People category alongside attendance, training, and engagement. This approach assumes:
- Workforce health includes physical safety
- Safety and people management are interconnected
- Organisations with mature safety cultures don't need explicit separation
Neither approach is superior, the choice reflects cultural maturity and risk profile.
Track Both PQVC and SQDCP in One Platform
LTS Data Point lets you configure dashboards for PQVC, SQDCP, or hybrid frameworks.How do velocity and delivery metrics differ?
The V in PQVC and the D in SQDCP measure related but distinct aspects of operational performance.
Velocity (PQVC focus)
Velocity measures internal speed and flow efficiency:
- Cycle time: How long it takes to complete one unit from start to finish
- Throughput rate: Units produced per hour/shift
- Process velocity: Speed of work moving through production stages
- Takt time adherence: Keeping pace with customer demand rate
- Lead time reduction: Shortening total elapsed time
Velocity is internally focused, it asks "how efficiently are we producing?"
Delivery (SQDCP focus)
Delivery measures customer-facing timeliness and commitments:
- On-time delivery percentage: Orders shipped by promised date
- Schedule attainment: Production hitting customer-committed dates
- Order fulfilment rate: Complete orders vs partial shipments
- Delivery reliability: Consistency of meeting commitments
- Backlog management: Aging of unfulfilled customer orders
Delivery is externally focused, it asks "are we meeting customer expectations?"
Practical difference in operations
A factory could have:
- High Velocity (making products quickly) but Poor Delivery (wrong products prioritised, customer orders late)
- Good Delivery (meeting customer dates) but Low Velocity (inefficient processes requiring overtime to catch up)
Organisations with direct customer commitments (contract manufacturing, build-to-order) often prefer SQDCP's Delivery focus. Operations focused on continuous flow and waste reduction (lean manufacturing, high-volume production) typically prefer PQVC's Velocity focus.
Can you use both SQDCP and PQVC metrics together?
Yes, many organisations run hybrid frameworks that combine elements of both.
Common hybrid configurations
Five-pillar model (S-Q-V-C-P):
- SQVCP framework separates Safety from People (SQDCP approach)
- Tracks Velocity instead of Delivery (PQVC approach)
- Useful for high-risk industries that also prioritise internal efficiency
Six-pillar model (S-Q-V-D-C-P):
- SQVDCP framework tracks both Velocity and Delivery
- Used in complex operations where internal flow and customer commitments both matter
- Requires more dashboard space but provides comprehensive visibility
Tiered approach:
- L1 executive dashboards: Use SQDCP to emphasise safety and customer delivery
- L2/L3 operational dashboards: Add Velocity metrics for supervisors managing internal flow
- Different stakeholders see the metrics most relevant to their decisions
When hybrid models make sense
Consider hybrid frameworks when:
- Transitioning from one framework to another (gradual adoption period)
- Operating in multiple industries with different customer expectations
- Managing both high-risk work (requiring explicit safety) and lean operations (requiring velocity tracking)
- Regulatory requirements mandate safety reporting separate from people metrics
Which industries prefer SQDCP over PQVC?
Industries predominantly using SQDCP
Automotive manufacturing:
- SQDCP originated in automotive supply chains
- Safety incidents can halt multi-billion-dollar assembly lines
- Just-in-time delivery requirements make on-time performance critical
- Tier 1 suppliers often contractually required to report SQDCP
Read how an Automobile manufacturer boosts operations with SQDCP
Aerospace and defence:
- Safety and quality are non-negotiable in aviation
- Delivery schedules tied to government contracts and aircraft production slots
- Regulatory oversight requires explicit safety metric tracking
Heavy industry (steel, mining, energy):
- High-consequence work environments with fatality risk
- Safety culture maturity demands visible prioritisation
- Delivery commitments often tied to long-term contracts
Chemical and pharmaceutical manufacturing:
- Process safety management regulations require separated safety metrics
- Product delivery tied to regulatory approval timelines
- Quality and safety directly linked to public health
Read the real case study of how PCI Pharma Streamlined continuous improvement with SQCDP boards
Industries predominantly using PQVC
Electronics and consumer goods manufacturing:
- Lower inherent safety risk compared to heavy industry
- Velocity and throughput critical for high-volume production
- Market responsiveness matters more than contractual delivery dates
Service operations (call centres, back-office):
- Velocity measures throughput (calls handled, cases processed)
- People metrics include attendance and capability
- Safety typically not a primary concern
Software development and tech operations:
- Velocity tracks deployment frequency and development speed
- People include team capacity and burnout prevention
- Delivery handled separately in product management metrics
Food and beverage production:
- Safety embedded in people and quality metrics (food safety)
- Velocity critical for perishable goods throughput
- Cost optimisation crucial for thin profit margins
Unsure Which Framework Fits Your Operation?
Explore LTS Data Point all in one platform and build your tailored frameworkHow do you choose between SQDCP and PQVC?
Decision framework
Ask these questions to determine the best fit:
1. What does your industry standard require?
- If you're an automotive supplier, your customer likely mandates SQDCP reporting
- If industry peers use one framework, alignment simplifies benchmarking
2. How mature is your safety culture?
- Developing safety culture: SQDCP's explicit safety category reinforces priority
- Mature safety culture: PQVC's embedded approach may suffice
3. What matters more: internal efficiency or customer commitments?
- Customer delivery criticality: Choose SQDCP's Delivery focus
- Internal flow optimisation: Choose PQVC's Velocity focus
4. What does your leadership team want to see first?
- If executives always ask "any safety incidents?" before other metrics → SQDCP
- If daily reviews focus on throughput and flow → PQVC
5. What tracking systems do you already have?
- Existing safety management systems may naturally support SQDCP
- ERP systems focused on production throughput may align better with PQVC
Still confused, where to start? Take this free SQCDP quiz and see if your teams meet SCDP standards before taking next moves.
Transition considerations
If switching frameworks:
- PQVC to SQDCP: Extract safety metrics from People category, replace Velocity with Delivery
- SQDCP to PQVC: Combine Safety back into People, replace Delivery with Velocity
- Maintain historical data: Map old metrics to new categories for trend continuity
What metrics go in each SQDCP vs PQVC category?
Side-by-side metric comparison
Note: Quality and Cost metrics are nearly identical across both frameworks.
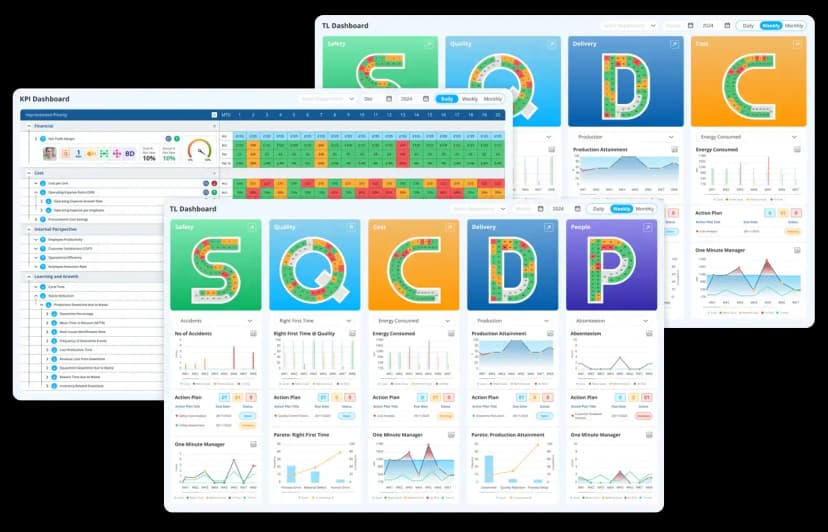
How do SQDCP and PQVC dashboards differ visually?
PQVC dashboard example

(Sample: LTS Data Point PQVC dashboard)
Key characteristics of a PQVC visual board
- Balanced performance view across People, Quality, Velocity, and Cost
- Instant status visibility using colour-coded gauges
- Trend awareness through time-based performance charts
- Root-cause focus via Pareto analysis
- Action-linked KPIs with ownership and status
- Supports daily to monthly reviews
SQDCP dashboard example

Key characteristics of an SQCDP visual board
(Sample: LTS Data Point SQCDP dashboard)
- Safety-first structure, keeping risk visible at all times
- Clear delivery and quality tracking for operational reliability
- Cost and people metrics aligned to daily management
- Problem-driven visuals highlighting deviations early
- Cause-and-countermeasure flow using Pareto and action plans
- Designed for shopfloor huddles and leadership reviews
For more insights, read How to use SQCDP board.
Digital board configurations
Modern PQVC software and SQDCP digital boards support both layouts with:
- Drag-and-drop metric positioning
- Configurable colour coding (green/yellow/red thresholds)
- Real-time data feeds from ERP, MES, and safety systems
- Role-based views (executives see L1, supervisors see L3)
Configure PQVC or SQDCP in Under 10 Minutes
LTS Data Point includes pre-built templates for both frameworks. Choose your structure, map your data sources, and go live with tiered dashboards.Do SQDCP and PQVC work with lean manufacturing?
Both frameworks complement lean methodologies but emphasise different aspects.
PQVC alignment with lean principles
PQVC's Velocity focus naturally supports lean manufacturing:
- Tracks flow efficiency and waste reduction
- Measures cycle time and takt time adherence
- Highlights bottlenecks through throughput metrics
- Supports continuous improvement by exposing process delays
Lean practitioners often add PQVC to visual management boards alongside:
- Kanban systems
- 5S audit scores
- Kaisen event tracking
- Value stream mapping updates
SQDCP alignment with lean principles
SQDCP's Delivery focus supports lean's customer value emphasis:
- Ensures production aligns with customer demand
- Tracks on-time delivery as ultimate lean outcome
- Balances internal efficiency with external commitments
- Prevents over-production through delivery metric constraints
Integration approach
Many lean operations run SQDCP at executive levels (customer-facing view) and add Velocity metrics at shop floor levels (internal efficiency view). This tiered approach satisfies both:
- Leadership's need to see customer delivery performance
- Operators' need to track internal flow and identify waste
What are the implementation differences between PQVC and SQDCP?
Data collection requirements
SQDCP requires:
- Separate safety incident tracking system (OSHA logs, near-miss reports, safety audits)
- Customer delivery data from ERP or order management systems
- Safety ownership assignment (typically EHS manager or safety coordinator)
PQVC requires:
- Integrated people and safety data (HR systems, attendance tracking, safety logs combined)
- Production velocity data from MES or manual production logs
- Process flow monitoring (cycle time tracking, WIP inventory counts)
Training and culture change
SQDCP implementation emphasises:
- Safety leadership commitment and visible prioritisation
- Customer delivery accountability across departments
- Daily safety briefings before production discussions
PQVC implementation emphasises:
- Holistic people management (safety + capability + engagement)
- Internal process efficiency and waste elimination
- Flow optimisation and throughput improvement
Technology platform requirements
Modern performance management software should support:
- Flexible metric structures (swap between PQVC and SQDCP configurations)
- Safety module integration (incident reporting, corrective actions, safety observations)
- ERP and MES connectivity (pull delivery schedules and production velocity automatically)
- Role-based dashboards (safety managers see incident trends, production managers see flow metrics)
Can small manufacturers use SQCDP or PQVC?
Yes, both frameworks scale to operation size.
Small-scale implementation (1-20 employees)
Start with manual tracking:
- Whiteboard with four (PQVC) or five (SQDCP) sections
- Daily updates by shift lead or owner
- Weekly review meetings (15 minutes)
- 1-2 metrics per category maximum
Minimal PQVC setup:
- People: Attendance %, safety incidents
- Quality: Defect count
- Velocity: Units produced vs target
- Cost: Scrap value
Minimal SQDCP setup:
- Safety: Days since injury
- Quality: Defect count
- Delivery: On-time orders
- Cost: Scrap value
- People: Attendance %
Medium-scale implementation (20-200 employees)
Transition to digital boards or software when:
- Multiple shifts make manual handoffs unreliable
- Data entry consumes 30+ minutes per shift
- Management needs remote visibility
- Trend analysis requires historical data beyond 90 days
Enterprise-scale implementation (200+ employees)
Requires integrated performance management platforms with:
- Multi-site dashboard consolidation
- Automated data feeds from production equipment
- Mobile access for traveling managers
- Advanced analytics and predictive alerts
From Startup to Enterprise: PQVC Software That Scales
Whether you're tracking 10 employees on one whiteboard or 10,000 across multiple countries, LTS Data Point grows with your operation.What are common mistakes when switching from PQVC to SQDCP?
Mistake 1: Treating it as just a relabeling exercise
What happens: Teams rename "People" to "Safety" without actually separating metrics or changing review processes.
Solution: Fully extract safety metrics from workforce management. Assign dedicated safety ownership. Conduct safety reviews before production discussions.
Mistake 2: Losing historical trend data
What happens: New SQDCP dashboards start from sero, breaking trend lines that existed in old PQVC system.
Solution: Map historical PQVC data to new SQDCP categories. Maintain parallel views during transition period. Archive old data in accessible format.
Mistake 3: Ignoring velocity when switching to delivery
What happens: Focus shifts entirely to customer delivery dates, but internal process efficiency metrics disappear.
Solution: Track Delivery at L1/L2 levels for customer-facing performance, add Velocity at L3/L4 for operational improvement work.
Mistake 4: Assuming SQDCP requires more metrics
What happens: Teams add 20+ new metrics thinking SQDCP's five categories demand more tracking.
Solution: SQDCP has one additional category (Safety) but doesn't require more total metrics. Keep 8-12 metrics total across all five categories.
Mistake 5: Not training on framework philosophy differences
What happens: Teams use SQDCP format but maintain PQVC mindset (safety embedded, velocity prioritised).
Solution: Explain why Safety is separated and Delivery replaces Velocity. Connect framework choice to industry standards and customer expectations.
How do automotive suppliers use SQDCP differently than other manufacturers?
Automotive-specific SQDCP characteristics
Contractual requirements:
- Tier 1 suppliers often have SQDCP reporting mandated in supply agreements
- OEMs (Ford, GM, Toyota) may specify exact metrics and reporting frequency
- Failure to meet SQDCP targets can trigger supplier audits or contract penalties
Safety emphasis:
- Automotive plants track ergonomic injuries separately (repetitive motion from assembly work)
- Near-miss reporting systems are sophisticated (digital submission, categorisation, trend analysis)
- Safety metrics often include contractor safety when temporary labor is used
Delivery criticality:
- Just-in-time delivery means every hour counts (late delivery stops assembly lines costing $1M+ per hour)
- Delivery metrics include sequence accuracy (parts arriving in exact build order)
- Premium freight costs tracked when expedited shipping needed to recover delivery failures
Quality standards:
- PPAP (Production Part Approval Process) compliance tracked in Quality metrics
- PPM (parts per million) defect rates rather than percentage defects
- Customer quality notifications (CQN) from OEMs tracked and responded to with 8D reports
Track PQVC, SQDCP, or Both—Your Choice
LTS Data Point supports any operational performance framework you need. Configure once, reconfigure anytime. No vendor lock-in to specific acronyms or metric structures.FAQs
1. Is PQVC or SQDCP better for manufacturing?
Neither framework is universally "better"—the choice depends on industry, safety risk level, and customer delivery criticality. Automotive and aerospace prefer SQDCP for explicit safety emphasis and delivery focus. General manufacturing and services prefer PQVC for velocity tracking and simpler four-category structure.
2. Can you convert PQVC metrics to SQDCP metrics?
Yes. Extract safety metrics from the People category, replace Velocity metrics with Delivery metrics, and reorganise dashboards into five categories instead of four. Most metrics (Quality, Cost, and non-safety People metrics) transfer directly.
3. What does SQDCP stand for in lean manufacturing?
SQDCP stands for Safety, Quality, Delivery, Cost, and People. It's a performance tracking framework used in lean manufacturing to maintain balanced operations and prevent optimising one metric at the expense of others.
4. Do PQVC and SQDCP require different software?
No. Modern digital performance management platforms support both PQVC and SQDCP configurations. The software difference is in dashboard layout and metric categorisation, not underlying functionality.
5. Which framework is easier to implement first?
PQVC is typically simpler to start with (four categories vs five, safety embedded rather than separated). Organisations can begin with PQVC and transition to SQDCP later if industry requirements or safety culture maturity demands explicit safety separation.
6. Can you track PQVC and SQDCP for different departments?
Yes. Some organisations use SQDCP for high-risk production areas (welding, assembly) and PQVC for service departments (quality lab, planning). Modern software platforms support multiple framework configurations within one system.
7. How long does it take to switch from PQVC to SQDCP?
Manual tracking: 1-2 weeks to redesign boards and train teams
Spreadsheet systems: 2-4 weeks to rebuild templates and migrate data
Digital platforms: 1-3 days if software supports both frameworks
8. Should startup manufacturers use PQVC or SQDCP?
Start with PQVC unless you're in automotive supply chain or high-risk industry. The simpler four-category structure is easier to implement with limited resources. Transition to SQDCP later if customer contracts or safety maturity require it.
9. What's the difference between PQVC velocity and SQDCP delivery?
Velocity measures internal speed and flow (cycle time, throughput). Delivery measures customer-facing timeliness (on-time shipments, schedule adherence). Velocity is internally focused; Delivery is externally focused.
10. Can PQVC or SQDCP work without digital boards?
Yes. Both frameworks work with manual whiteboards, Excel spreadsheets, or paper forms. Digital boards improve speed, accuracy, and multi-location visibility but aren't required for small operations.