PQVC Metrics Explained: People, Quality, Velocity, and Cost Tracking
Learn how PQVC metrics—People, Quality, Velocity, and Cost—help operations teams monitor shop-floor performance. This guide explains what each metric means, how teams track them daily, and when digital boards replace manual tracking for better visibility and control.
Contents
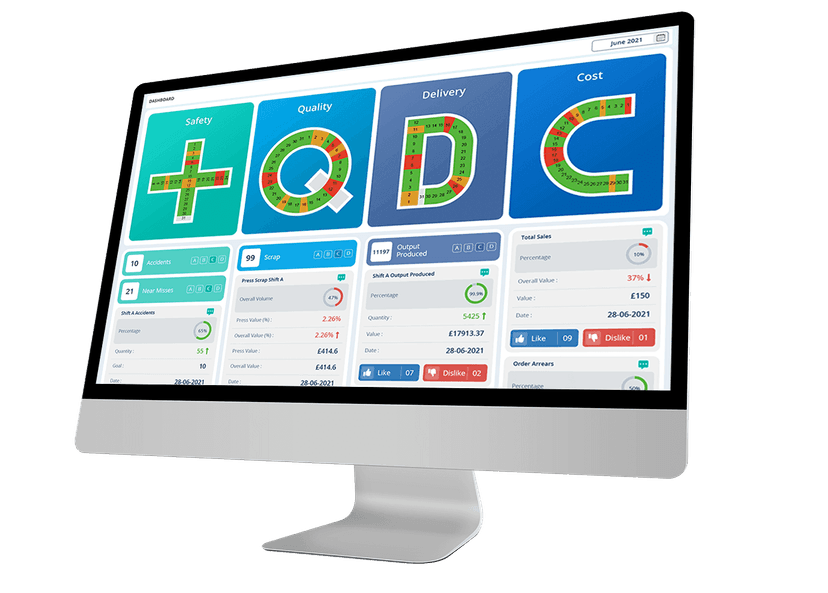
- An example of PQVC dashboard
- What does PQVC stand for?
- PQVC metrics explained in detail
- PQVC metrics Vs PQVC software?
- When teams move from manual to digital PQVC tracking
- PQVC vs traditional KPI tracking
- Why PQVC metrics exist (and why teams use them)
- How do PQVC metrics work in real operations?
- How does PQVC connect strategy, execution, and daily management?
- Common mistakes when using PQVC metrics
- How do you implement PQVC metrics in an organisation?
- What industries use PQVC metrics?
- How is PQVC different from other performance frameworks?
- Key takeaways for PQVC implementation
Last updated on : July 9, 2026
PQVC metrics are an operational performance structure used by organisations to track People, Quality, Velocity, and Cost together providing a balanced, real-time view of how work is performed, delivered, and sustained. In some contexts, the "V" may represent Volume instead of Velocity, depending on whether an organisation prioritises tracking total output quantity over speed of delivery. Instead of reviewing disconnected KPIs, PQVC metrics help leaders see operational health at a glance and drill down to root causes when performance turns red.
An example of PQVC dashboard

What does PQVC stand for?
PQVC represents four critical dimensions of operational performance:
Together, People, Quality, Velocity (or volume), and Cost form a practical lens for understanding whether operations are stable, capable, and improving, not just whether numbers look good at month end.
PQVC metrics explained in detail
People metrics (P)
People metrics focus on whether the organisation has the capacity and capability to execute work safely and consistently.
Examples of people metrics include:
- Attendance and staffing vs plan
- Safety observations, near misses, hazards
- Skill coverage and training gaps
- Overtime and fatigue indicators
- Engagement
- Workforce availability and absenteeism
Why People come first:
Without the right people in place, quality slips, velocity slows, and costs rise.
Quality metrics (Q)
Quality metrics show whether work is done right the first time.
Examples of quality metrics:
- Defect counts and rates
- Rework hours
- First-pass yield
- Audit or compliance failures
- Customer complaints
- Scrap percentages
Quality in PQVC is reviewed daily, not only after customer impact occurs, so teams can contain issues early.
Velocity metrics (V)
Velocity measures how fast and smoothly workflows through the system.
Examples of velocity metrics:
- Schedule attainment
- Cycle time
- Backlog ageing
- Throughput vs plan
- Speed of execution
Velocity is often where problems become visible first—but the root cause usually lies in People or Quality.
Volume metrics (V)
When "V" represents Volume instead of Velocity, it measures total output quantity and production capacity.
Examples of volume metrics:
- Total units produced per shift/day/week
- Production vs target (planned volume)
- Capacity utilisation percentage
- Output per operator or per line
Volume-focused organisations prioritise hitting production targets and maximizing throughput, while velocity-focused operations emphasise speed and flow efficiency.
Cost metrics (C)
Cost metrics reflect the financial impact of operational performance. Scrap, downtime, labour variance, inefficiency
Examples of cost metrics:
- Scrap and waste
- Downtime losses
- Labour inefficiency
- Cost of poor quality
In PQVC, cost is treated as an outcome, not a starting point helping teams fix causes, not just cut spend.
Join 200+ Operations Teams Running PQVC on LTS Data Point
PQVC metrics Vs PQVC software?
PQVC metrics (The concept)
PQVC metrics are simply the measurements themselves - the specific numbers you track under People, Quality, Velocity, and Cost. These metrics exist regardless of how you record them. You could track it with a digital board, a whiteboard in the break room, an Excel file on a shared drive or sticky notes on a wall.
PQVC digital board or software (The tool)
PQVC digital boards and PQVC software are technology platforms that help you track those same metrics electronically. PQVC software platforms add web dashboards, mobile apps, automated reporting, and integration with other business systems. These tools:
- Automatically collect data from equipment, systems, or manual entry
- Display metrics on TV screens around the facility
- Update in real-time instead of waiting for shift reports
- Send alerts when metrics go outside target ranges
- Create reports without manual spreadsheet work
- Let managers view multiple locations from one dashboard
When teams move from manual to digital PQVC tracking
Organisations typically switch to PQVC software when:
- Data entry burden: Supervisors spend 1+ hours daily updating spreadsheets
- Delayed visibility: You find out about problems hours or days after they happen
- Multiple locations: You manage 2+ facilities and can't see performance from one place
- Integration needs: You want PQVC to pull data automatically from production equipment or ERP systems
- Mobile access: Managers need to check metrics from home or while traveling
- Historical analysis: You want to spot trends over months or years without building complex Excel formulas
See an example of digital tool for tracking PQVC- LTS Data Point is a PQVC software, that replaces manual tracking with automated dashboards.
Manual tracking getting messy? See how LTS Data Point automatically updates PQVC dashboards in real-time
PQVC vs traditional KPI tracking
PQVC does not replace KPIs, it organises them in a way that supports action.
Why PQVC metrics exist (and why teams use them)
Most organisations already track KPIs. The problem is how they’re reviewed.
Common challenges with traditional KPI reviews:
- Metrics are reviewed in isolation (quality review here, cost review later)
- Reports arrive too late to act
- Leaders see outcomes, not operational causes
- Frontline teams don’t see how daily work connects to results
PQVC metrics exist to solve this gap.
By grouping KPIs into People, Quality, Velocity, and Cost, teams can:
- Review performance daily, not monthly
- Spot trade-offs early (e.g., velocity up, quality down)
- Align frontline actions with leadership priorities
- Create a shared language across functions
This is why PQVC is often used as an executive-level operational health view, supported by drill-downs for deeper analysis.
PQVC sits alongside similar shopfloor frameworks such as SQCDP, SQDCM and SQDIP. In manufacturing, these approaches often overlap, with each tracking core themes like quality, delivery, cost and people, but arranged with different emphasis. Rather than completely separate methods, they are variations of the same idea, adapted to suit specific operational priorities.
See our guide on PQVC vs SQDCP metrics (this article explores the nuanced differences between these two similar frameworks to help you choose the right approach for your operation).
How do PQVC metrics work in real operations?
PQVC systems function through tiered dashboards that provide different levels of detail depending on the viewer's role and decision-making needs.
The four-level dashboard structure (L1–L4)
Most PQVC implementations follow a hierarchical drill-down model:
Level 1 (L1): Executive summary
- Single-screen view showing overall PQVC health (typically color-coded: green/yellow/red)
- Designed for leadership reviews and board reporting
- Example metrics: Overall Equipment Effectiveness (OEE), Total Recordable Incident Rate (TRIR), Customer On-Time Delivery %, Cost per Unit vs. Budget
Level 2 (L2): Departmental performance
- Breaks down L1 metrics by production line, facility, or business unit
- Used by plant managers and operations directors
- Example metrics: Line-specific yield rates, departmental absenteeism, shift-by-shift throughput, variance to standard cost
Level 3 (L3): Process and shift detail
- Granular data for supervisors and team leads
- Tracks daily or shift-level performance
- Example metrics: Hourly production counts, real-time scrap rates, individual equipment downtime events, safety near-miss reports
Level 4 (L4): Root cause and countermeasure tracking
- Problem-solving layer for continuous improvement teams
- Documents issues, corrective actions, and verification
- Example content: 5-Why analyses, A3 problem statements, CAPA (Corrective and Preventive Action) logs, training records for rework certification
Example: PQVC dashboard flow in manufacturing
A typical interaction pattern:
- Executive reviews L1 dashboard Monday morning and sees Quality metric is red (85% first pass yield vs. 95% target)
- Drill down to L2 reveals the issue is isolated to Assembly Line 3 in the Dallas facility
- L3 shift data shows defects spiked during night shift on Friday
- L4 root cause analysis identifies a tooling calibration issue that occurred during Thursday's changeover; countermeasure implemented, training updated
This cascading structure ensures data flows upward (from shop floor to boardroom) and accountability flows downward (from strategy to execution).
Build Your L1–L4 Dashboards in Minutes, Not Months
How does PQVC connect strategy, execution, and daily management?
PQVC metrics serve as a translation layer between high-level organisational goals and frontline activities.
Strategic alignment through PQVC
Organisations typically cascade strategic objectives into PQVC targets:
Strategic Goal: "Achieve 20% market share growth"
PQVC translation:
- Velocity: Increase production capacity by 15% without adding headcount
- Quality: Maintain customer satisfaction above 4.5/5.0 to support retention
- Cost: Reduce per-unit cost by 8% to enable competitive pricing
- People: Upskill 100% of operators on new product assembly to support volume ramp
PQVC for Lean daily management routines
As a lean daily management board PQVC framework restructure operational reviews:
Daily tier meetings (15-minute stand-ups at L3 level):
- Review previous 24-hour performance across PQVC
- Identify barriers to target achievement
- Assign ownership for resolution
Weekly operations reviews (L2 departmental):
- Trend analysis across PQVC dimensions
- Resource allocation decisions based on metric interactions
- Escalation of chronic issues to continuous improvement teams
Monthly business reviews (L1 executive):
- Performance against annual targets
- Investment decisions driven by PQVC data (e.g., "Cost savings justify automation investment")
- Strategic pivots based on persistent metric patterns
Connecting metrics to behavior
Effective PQVC systems link metrics to standard work and visual management:
- Production boards display real-time PQVC status at each workstation
- Supervisors conduct Gemba walks using PQVC as audit criteria
- Improvement projects are prioritised based on which PQVC metric(s) they impact
- Incentive systems may incorporate balanced PQVC achievement rather than single-metric bonuses
Common mistakes when using PQVC metrics
1. Using PQVC only as a report
PQVC must drive discussion and decisions, not just display numbers.
2. Data quality issues
Inconsistent collection methods or unreliable sources undermine trust
3. Tracking too many KPIs per dimension
Keep it focused signal matters more than volume.
4. Technology limitations
Legacy systems may not support real-time data integration
5. Reviewing PQVC too infrequently
Monthly PQVC reviews miss daily operational signals.
6. Treating cost as the main lever
Cost issues usually originate in People, Quality, or Velocity.
7. No drill-down or ownership
If red metrics don’t lead to actions, PQVC loses credibility.
8. Resistance to transparency
Frontline teams may fear exposure of poor performance
How do you implement PQVC metrics in an organisation?
Implementing PQVC requires both technical infrastructure and cultural adoption.
Technical implementation Steps
- Define metric hierarchy: Establish which metrics appear at each dashboard level (L1–L4)
- Establish data sources: Identify where each metric will be collected (ERP, MES, manual logs, sensors)
- Set targets and thresholds: Define green/yellow/red performance bands based on historical capability and strategic goals
- Build visualisation tools: Create dashboards that support drill-down navigation and real-time updates
- Automate data flows: Integrate systems to reduce manual data entry and reporting delays
Organisational adoption practices
- Leadership modeling: Executives must reference PQVC in decision-making and reviews
- Role clarity: Assign specific ownership for each metric at each organisational level with a KPI tree
- Training programs: Educate teams on how to interpret metrics and take corrective action
- Review cadence: Establish predictable meeting rhythms tied to PQVC updates
- Feedback loops: Close the loop from metric detection to problem resolution to verification
What industries use PQVC metrics?
PQVC frameworks originated in manufacturing but have expanded across operational sectors:
Manufacturing and production
- Automotive assembly plants tracking line efficiency and defect rates
- Pharmaceutical manufacturers balancing yield, compliance, and batch cycle times
- Food and beverage operations monitoring safety, spoilage, and production volume
- Electronics assembly managing component quality and throughput
Service operations
- Call centers measuring agent productivity, customer satisfaction, and cost per interaction
- Healthcare facilities tracking patient safety, treatment outcomes, and resource utilisation
- Logistics providers balancing on-time delivery, damage rates, and fuel costs
Project-based work
- Construction projects monitoring safety incidents, quality inspections, schedule adherence, and budget variance
- Software development teams tracking defect density, velocity (story points), team capacity, and technical debt
How is PQVC different from other performance frameworks?
PQVC shares conceptual DNA with several established methodologies but has distinct characteristics:
Relationship to Balanced Scorecard
The Balanced Scorecard (developed by Kaplan and Norton) includes financial, customer, internal process, and learning/growth perspectives. PQVC is more operationally focused, emphasising metrics that frontline teams can influence daily rather than strategic perspectives like market positioning or innovation pipelines.
Relationship to Lean and six sigma
Lean methodologies focus on waste elimination and flow; Six Sigma emphasises variation reduction and defect prevention. PQVC integrates these philosophies by tracking velocity (lean) and quality (Six Sigma) alongside people and cost dimensions that Lean and Six Sigma assume but don't always measure explicitly.
Relationship to OEE (Overall Equipment Effectiveness)
OEE measures equipment performance through availability, performance, and quality loss. PQVC is broader, incorporating workforce and cost dimensions beyond equipment-centric metrics. Many PQVC implementations include OEE as a velocity or quality metric within the larger framework.
Key takeaways for PQVC implementation
Organisations adopting PQVC metrics should prioritise:
- Start with clarity: Define what each metric measures, who owns it, and why it matters before building dashboards
- Balance detail and simplicity: L1 dashboards must fit on one screen; L3/L4 provide depth for problem-solving
- Link metrics to action: Every metric should trigger a known response when it goes red or yellow
- Invest in data infrastructure: Automated data collection pays long-term dividends over manual reporting
- Embed in management routines: PQVC only works if leaders reference it in daily, weekly, and monthly reviews
- Iterate based on use: Metrics that aren't used should be removed; gaps in decision-making reveal missing metrics
PQVC frameworks succeed when they translate strategic intent into operational reality through balanced, actionable, and hierarchical performance measurement.