What Is PQCDSM? A Leader’s Guide to Production Performance Metrics
PQCDSM is a performance management framework used to monitor Productivity, Quality, Cost, Delivery, Safety, and Morale through daily reviews, visual boards, and operational KPIs.
Contents
- What is the PQCDSM framework?
- Sample of a PQCDSM board
- An overview of PQCDSM: How does it work?
- Quick guide: PQCDSM vs. SQDCM
- What are PQCDSM shopfloor metrics?
- PQCDSM in Lean Daily Management
- What is PQCDSM board?
- Challenges and limitations in traditional paper-based PQCDSM
- What is a digital PQCDSM board?
- Which organisations can make use of digital PQCDSM boards?
- Why PQCDSM is a powerful visual management framework
- How PQCDSM improves operational performance
- PQCDSM management: How to implement PQCDSM effectively
- How to track and customise PQCDSM metrics using a digital system
- Tier-based use of PQCDSM
- Digital PQCDSM boards customised for your needs by LTS Data Point
- Case study: How PQCDSM drives real results in different sectors
Last updated on : June 10, 2026
What is the PQCDSM framework?
The PQCDSM framework is a performance management approach used in manufacturing and operations to track Productivity, Quality, Cost, Delivery, Safety, and Morale. It is usually applied in daily reviews and visual management boards to observe operational KPIs and identify issues early.
By grouping key metrics into six clear categories, PQCDSM aids teams maintain balanced operational visibility, making sure that output, efficiency, safety, and people-related performance are reviewed together rather than in isolation.
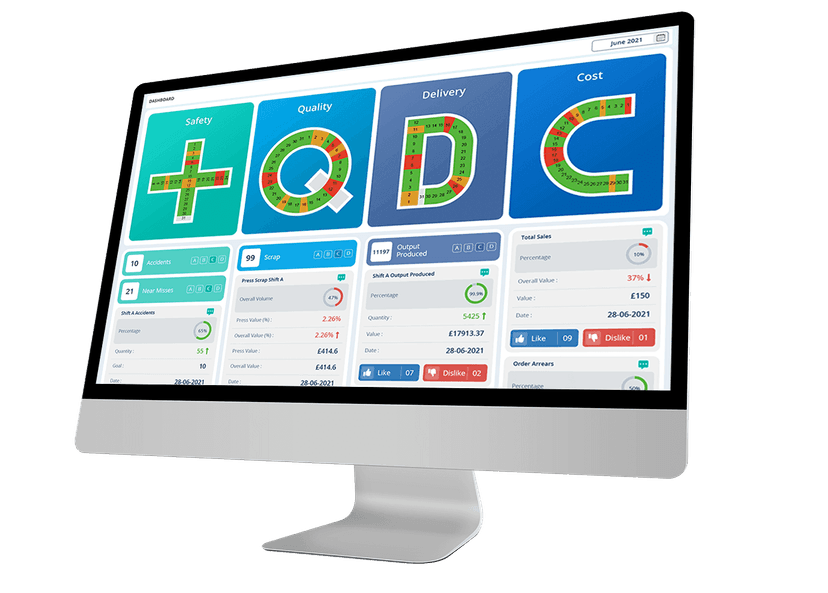
Sample of a PQCDSM board

An overview of PQCDSM: How does it work?
The PQCDSM framework works by organising operational performance into six categories – Productivity, Quality, Cost, Delivery, Safety, and Morale – and evaluating them often through daily or shift-based management routines.
Teams define a small set of operational KPIs under each category and assess them using visual boards or dashboards. Deviations from targets are underlined, discussed briefly, and allotted actions, assisting problems surface early rather than after performance has already declined.
By repeating this review cycle consistently, PQCDSM supports operational visibility, prioritisation, and alignment, verifying teams concentrate on the right problems at the right time.
Experience PQCDSM execution in action with LTS Data Point
Quick guide: PQCDSM vs. SQDCM
What are PQCDSM shopfloor metrics?
PQCDSM shopfloor metrics are the KPIs used daily on the shopfloor to track and improve performance across Productivity, Quality, Cost, Delivery, Safety, and Morale. These metrics provide teams simple, practical insight into the health of functions and assist quick decisions during daily management reviews.
Below are commonly tracked examples for each PQCDSM pillar:
Productivity
- Output per shift
- Output per labour hour
- Overall Equipment Effectiveness (OEE)
- Line efficiency
- Machine utilisation rate
- Downtime hours
- Changeover time
- Planned vs actual production
- Capacity utilisation
Quality

- Defect rate
- First Pass Yield (FPY)
- Scrap percentage
- Rework rate
- Customer complaint counts
- Internal rejection rate
- Quality audit score
- Process capability (Cp / Cpk)
- Right-first-time (RFT) percentage
- Cost of poor quality (COPQ)
Cost

- Cost per unit produced
- Material waste cost
- Labour cost per unit
- Overtime cost
- Energy cost per unit
- Maintenance cost
- Scrap cost
- Rework cost
- Budget vs actual spends
- Cost variance
Delivery

- On-time delivery (OTD)
- On-time in-full (OTIF)
- Order fulfilment rate
- Production schedule adherence
- Lead time
- Cycle time
- Backlog orders
- Missed dispatches
- Expedite count
- Customer service level
Safety

- Recordable incident count
- Near-miss reports
- Lost Time Injury (LTI) count
- Days without accident
- Safety audit score
- Unsafe act observations
- Safety training completion rate
- PPE compliance rate
- Hazard closure rate
- Incident response time
Morale

- Absenteeism rate
- Employee turnover rate
- Overtime frequency
- Employee engagement score
- Suggestion participation rate
- Grievance count
- Training hours per employee
- Skill coverage ratio
- Team pulse survey score
- Employee satisfaction score
Discuss your PQCDSM challenges with an LTS Data Point specialist
PQCDSM in Lean Daily Management
In Lean Daily Management (LDM), the PQCDSM framework is used to organise daily evaluations, visual boards, and team discussions around Productivity, Quality, Cost, Delivery, Safety, and Morale. By integrating PQCDSM into daily routines, teams can:
- Observe operational KPIs in real time
- Spot deviations early and prioritise corrective actions
- Align frontline teams with leadership goals
- Encourage continuous improvement and problem-solving
- Maintain shopfloor discipline without over-depending on reports
Usually, each metrics is showed on visual boards or dashboards during daily huddle meetings, allowing teams to see where performance is on track and where immediate action is required. This approach verifies that improvement is continuous, data-driven, and visible to everyone.
What is PQCDSM board?
A PQCDSM board is a visual management tool used on the shopfloor to display vital operational metrics across the pillars. It offers teams with a live snapshot of performance, spotlighting areas that are on target and those that need immediate action.
PQCDSM boards are typically updated daily during Lean Daily Management routines and serve as central point for team discussions, problem-solving, and alignment. They can be physical boards with charts and indicators or digital dashboards accessible across shifts and locations. The aim is to make metrics visible, reasonable, and accountable at all levels of the industry.
Challenges and limitations in traditional paper-based PQCDSM
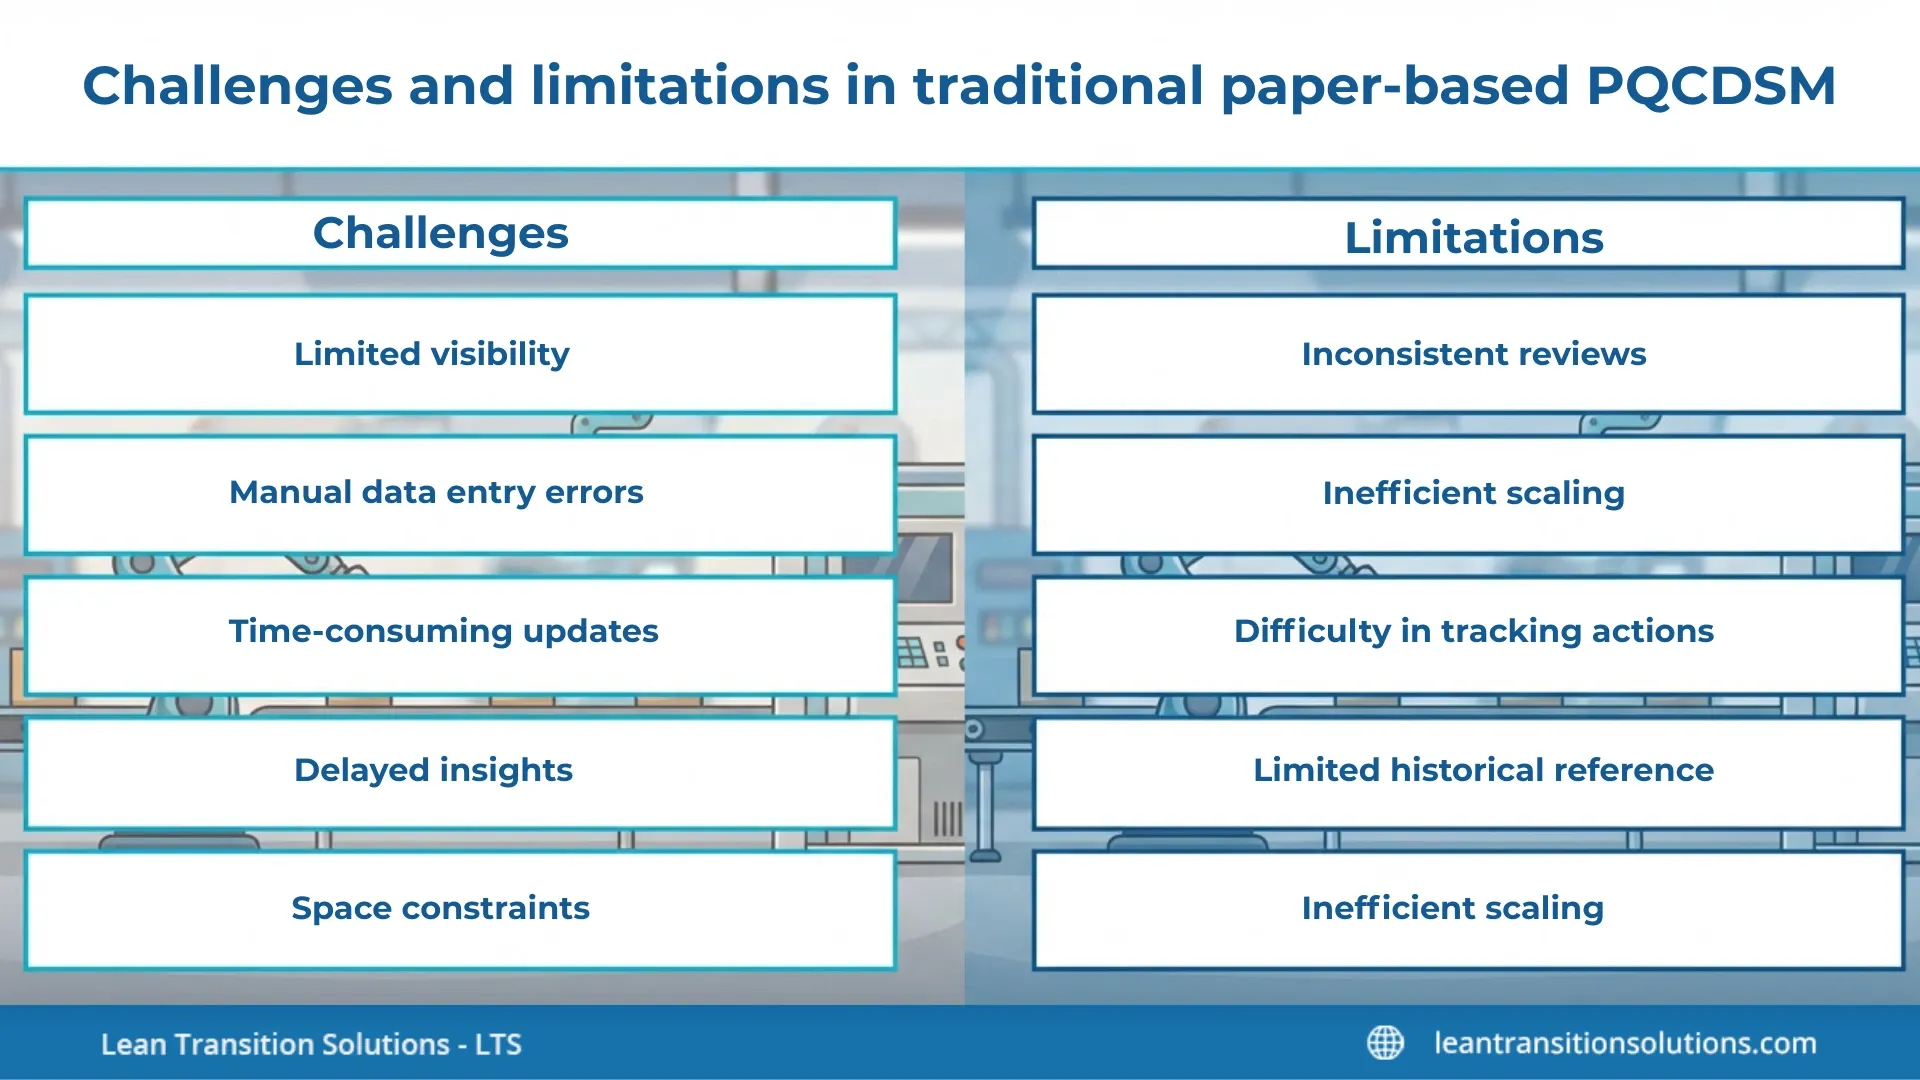
While paper-based PQCDSM boards are simple and familiar to several employees in a company, they also come with several challenges and limitations. Let’s look at these one-by-one.
Challenges of using paper-based PQCDSM
- Limited visibility: Only accessible to those who are physically present on the shopfloor. Remote or multi-shift teams may miss updates.
- Manual data entry errors: Handwritten numbers and manual updates increase the risk of mistakes.
- Time-consuming updates: Updating metrics daily can take remarkable effort, leaving less time for problem-solving.
- Delayed insights: Historical trends and performance analysis are difficult without digitisation.
- Space constraints: Limited room for additional metrics or detailed visualisations.
Limitations of using paper-based PQCDSM
- Inconsistent reviews: Different shifts may interpret or document metrics differently.
- Lack of integration: Paper boards cannot pull data from other systems, limiting live decision-making.
- Difficulty in tracking actions: Follow-ups, corrective actions, and accountability are harder to keep an eye on.
- Limited historical reference: Paper boards cannot store trends or old comparisons effectively.
- Inefficient scaling: Expanding operations or multiple lines makes paper-based PQCDSM boards inconvenient.
Visualise PQCDSM performance clearly using LTS Data Point
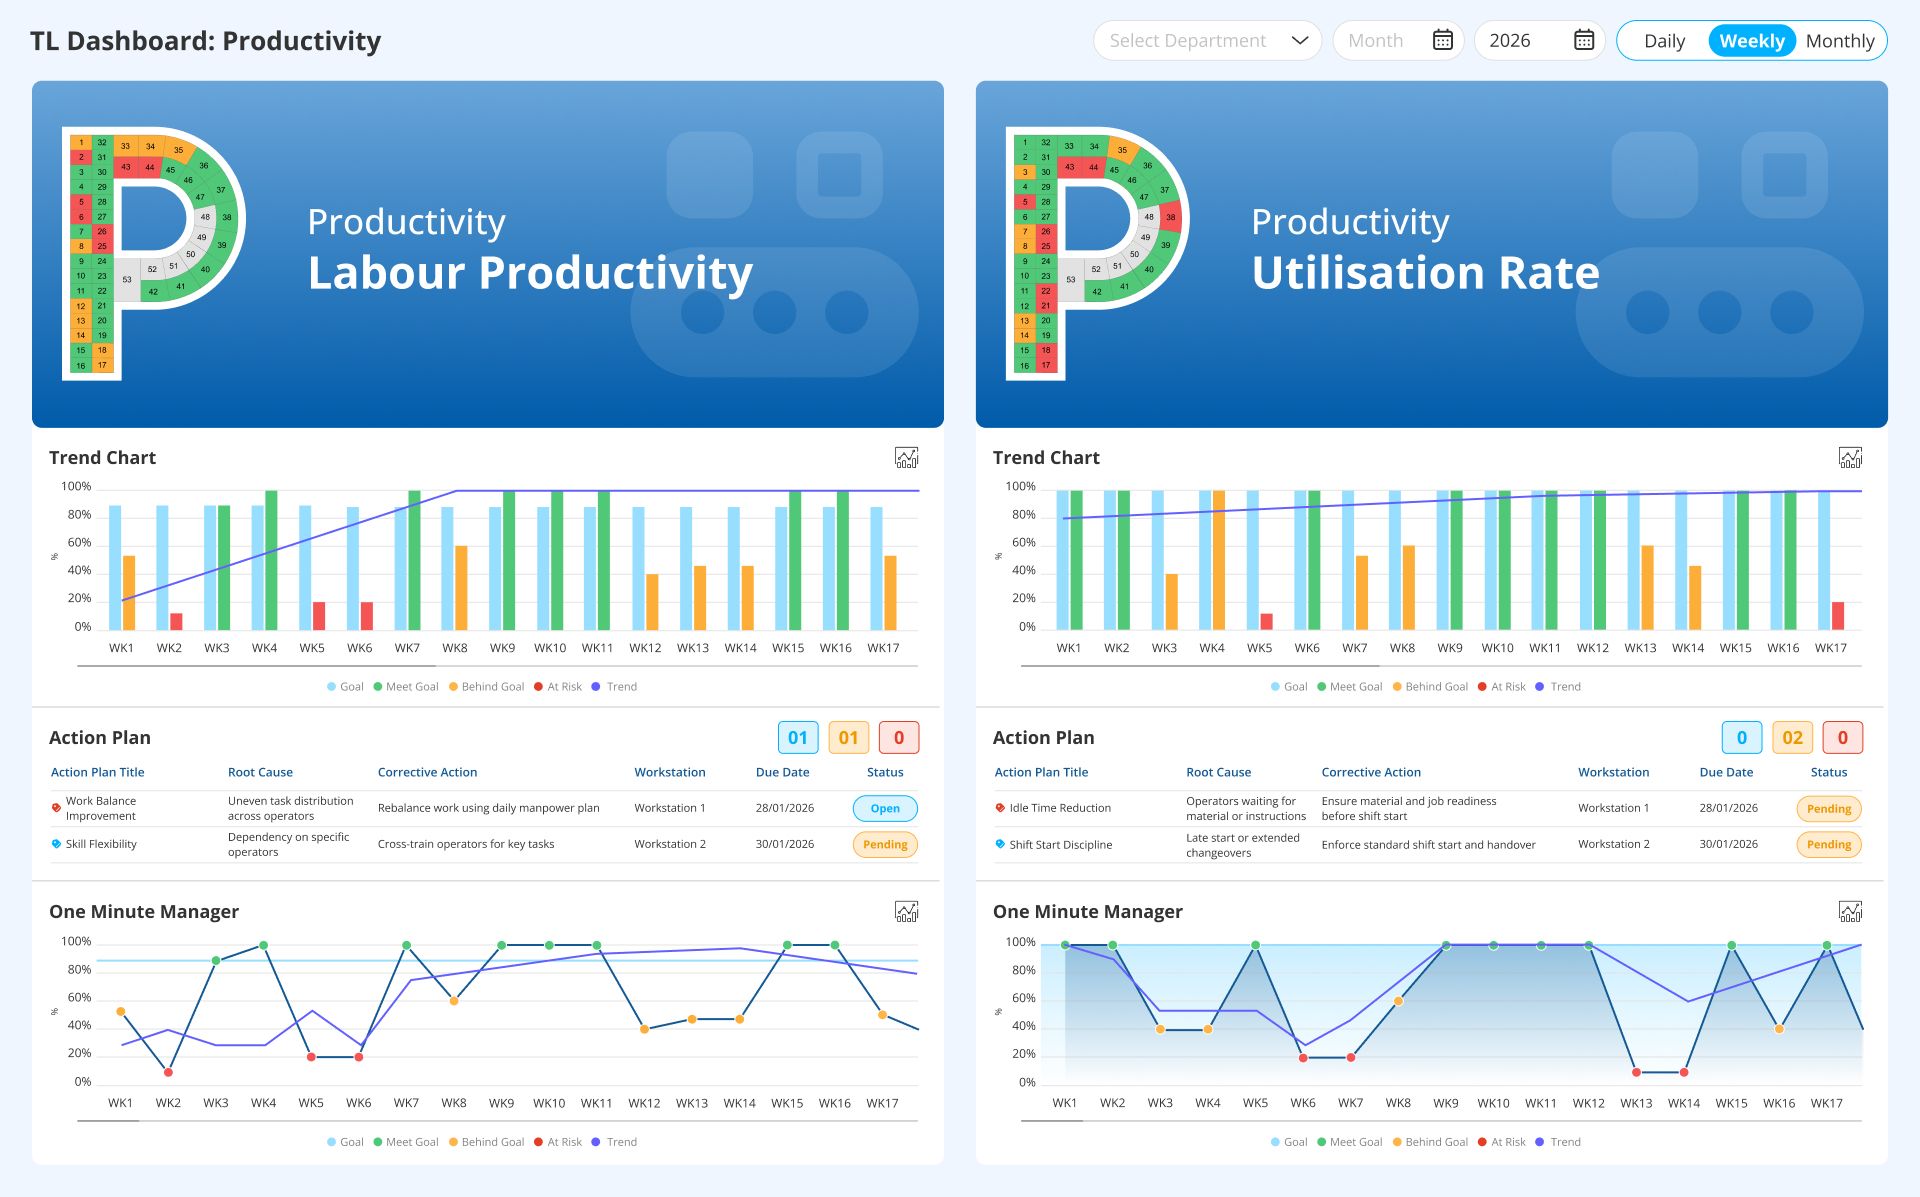
What is a digital PQCDSM board?
A digital PQCDSM board is an electronic version of the traditional shopfloor board, designed to monitor these pillar metrics in real time. Unlike paper boards, digital boards enable teams to:
- Access metrics remotely across shifts and locations
- Update data automatically from linked systems
- See trends and historical performance easily
- Scale operations without physical space restrictions
Digital PQCDSM boards are usually used in Lean Daily Management routines to give clear, actionable insights, enhance accountability, and make sure quicker fact-based decision-making on the shopfloor.
Benefits of digital PQCDSM boards
- Live visibility: Teams can see real-time operational metrics anytime, anywhere.
- Remote access across shifts: Multi-shift or distributed teams remain aligned without being physically present.
- Automatic data updates: Removes manual entry errors and saves time.
- Trend analysis and historical tracking: Quickly detects patterns, repeating issues, and long-term performance.
- Action monitoring and accountability: Corrective actions can be allocated, observed, and closed efficiently.
- Scalability: Easy to expand for multiple lines, plants, or regions without physical limitations.
- Improved decision-making: Gives clear, actionable insights for faster problem-solving.
- Integration with other systems: Pull data from ERP, MES, or other operational systems for accuracy.
- Enhanced team engagement: Teams can interact with dashboards, participate in reviews, and monitor progress.
- Supports Lean Daily Management: Reinforces routines, visual management, and continuous improvement culture.
Which organisations can make use of digital PQCDSM boards?

Digital PQCDSM boards are versatile and can be applied wherever operational performance across Productivity, Quality, Cost, Delivery, Safety, and Morale needs to be observed. Common industries include:
- Automotive and auto components: Production lines, assembly operations, and quality control.
- Manufacturing: Heavy and light manufacturing plants, discrete or continuous processes.
- Pharmaceuticals and life sciences: Batch production, lab functions, and compliance tracking.
- Food and beverage: Production efficiency, safety, and quality tracking.
- Electronics and high-tech: Assembly, testing, and delivery performance.
- Logistics and warehousing: Delivery, throughput, and operational efficiency monitoring.
- Aerospace and defence: Manufacturing, safety, and process adherence.
- Textiles and apparel: Productivity, quality, and workflow tracking.
- Energy and utilities: Plant operations, safety, and process efficiency.
- Consumer goods: Multi-line production, inventory, and delivery performance.
These organisations benefit from live visibility, practical metrics, and continuous improvement routines authorised by digital PQCDSM boards.
Get expert advice from LTS Data Point on PQCDSM metrics and reviews
Why PQCDSM is a powerful visual management framework
PQCDSM is a powerful visual management framework because it converts complex operational documents into simple, visual structure that teams can comprehend and act on daily. By arranging performance into six clear dimensions, PQCDSM allows quicker alignment, better focusing, and more disciplined decision-making on the shopfloor.
Key features of PQCDSM as a visual management framework
- Balanced performance view: PQCDSM ensures teams examine Productivity, Quality, Cost, Delivery, Safety, and Morale together, avoiding over-focus on a single metric such as output or cost.
- Clear visual structure: Metrics are exhibited in a consistent, easy-to-read format, making performance status immediately visible during daily reviews.
- Supports daily management routines: PQCDSM fits naturally into Lean Daily Management System, allowing short, focused discussions around deviations and actions.
- Early problem detection: Visual indicators assist teams detect problems early, before they escalate into larger operational issues.
- Motivates accountability: Ownership of each metric is clear, supporting follow-up actions and responsibility at the right level.
- Scalable across teams: The framework can be applied consistently across lines, departments, and sites while enabling flexibility in metric selection.
How PQCDSM improves operational performance
- Creates performance transparency by making deviations visible at the point of work
- Upgrades response time by underlining problems before they affect output or delivery
- Aligns daily actions with operational goals, minimising reactive firefighting
- Allows data-led prioritisation instead of opinion-based decision-making
- Lowers operational variability by monitoring leading indicators consistently
- Reinforces execution discipline through frequent performance reviews
- Enhances cross-functional coordination by standardising performance language
- Supports sustainable improvement rather than short-term fixes
- Builds performance ownership at the team and line level
- Develops operational predictability across shifts and departments
PQCDSM management: How to implement PQCDSM effectively
Define the purpose of PQCDSM
Begin by clarifying why PQCDSM is being introduced – whether to upgrade visibility, stabilise performance, or strengthen Lean Daily Management routines. This verifies the framework is used for decision-making, not just reporting.
Select important metrics for each dimension
Choose a small, meaningful set of metrics under Productivity, Quality, Cost, Delivery, Safety, and Morale. Metrics should be practical at shopfloor level, not high-level business KPIs.
Standardise metric definitions
Make sure every metric has a clear definition, target, and update frequency. Consistency prevents confusion across shifts, teams, and departments.
Build the PQCDSM board structure
Design a clear visual layout that separates each PQCDSM dimension and spotlights deviations. Whether physical or digital, the board should make performance status immediately obvious.
Establish a daily review routine
Integrate PQCDSM into daily management meetings or huddles. Evaluations should be short, focused, and centred on deviations rather than explanations.
Assign ownership and actions
Each metric should have a clear owner. When deviations happen, actions must be documented, monitored, and reviewed to closure.
Escalate problems systematically
Define when and how issues are escalated beyond the team level. PQCDSM works best when unresolved issues flow smoothly to the right level of leadership.
Review and refine regularly
Periodically reassess metrics, targets, and review effectiveness to guarantee PQCDSM continues to support evolving operational priorities.
Explore digital PQCDSM boards built around your operations with LTS Data Point
How to track and customise PQCDSM metrics using a digital system
- Configure metrics by role and level: Different teams (supervisors, operators, managers) can view only the PQCDSM metrics relevant to their responsibilities.
- Customise targets and thresholds: Digital systems enable teams to set realistic targets, tolerance limits, and visual alerts based on operational context.
- Standardise metric definitions centrally: Definitions, formulas, and update rules can be maintained in one place to avoid interpretation variations across shifts.
- Allow real-time or scheduled data updates: Metrics can be updated automatically or at defined intervals, minimising manual effort and improving data reliability.
- See trends instead of single data points: Digital PQCDSM boards make it easier to observe performance over time and spot recurring patterns.
- Adapt metrics as priorities change: Metrics can be added, removed, or refined without redesigning physical boards, supporting continuous improvement.
- Observe actions alongside metrics: Problems, root cause, and corrective actions can be connected directly to affected PQCDSM metrics.
- Support multi-site and multi-line views: Digital systems permit grouping or drill-down across production lines, departments, or locations.
- Enhance review consistency: Standardised layouts and workflows make sure PQCDSM evaluations follow the same structure every day.
- Maintain historical performance records: Digital tracking preserves past data for audits, reviews, and performance analysis.
Tier-based use of PQCDSM
PQCDSM framework is commonly used in a tiered daily management structure, making sure issues are assessed at the right level and escalated quickly when required.
Tier 1 – Team or shopfloor level
Used by operators and frontline teams during daily huddles.
- Reviews real-time PQCDSM metrics for the day or shift
- Highlights immediate productivity losses, quality deviations, safety risks, or delivery delays
- Prioritises short-term actions within the team’s control
- Escalates unresolved problems to tier 2
Tier 2 – Department or area level
Used by supervisors and middle management.
- Reviews escalated problems from Tier 1
- Detects cross-team dependencies, bottlenecks, and recurring patterns
- Assigns resources or corrective actions
- Secures alignment across teams and processes
Tier 3 – Leadership or site level
Used by plant leaders and senior management.
- Evaluates collected PQCDSM performance
- Focuses on systematic issues and structural constraints
- Aligns operational performance with business goals
- Drives long-term improvement initiatives and strategic decisions
Tier-based PQCDSM secures visibility, accountability, and structured escalation, assisting industries move from reactive problem-solving to proactive operational performance management.
Speak to an LTS Data Point expert about tier-based PQCDSM execution
Digital PQCDSM boards customised for your needs by LTS Data Point
Digital PQCDSM boards transform the framework from a static reporting tool into a living part of daily management. By moving PQCDSM into a digital environment, industries gain better consistency, trackability, and adaptability across teams and tiers.
LTS Data Point allows teams to design PQCDSM boards that mirror how work actually occurs on the shopfloor, rather than forcing teams to adapt to rigid templates. Boards can be organised around existing review cadences, operational hierarchies, and improvement routines – supporting both standardisation and flexibility.
How LTS Data Point strengthens PQCDSM execution
- Aligns PQCDSM with daily management rhythms: Digital boards support daily huddles, tier meetings, and leadership reviews by always keeping PQCDSM metrics visible and evaluation ready.
- Allows level-specific metric views: Operators, supervisors, and leaders can each concentrate on PQCDSM metrics important to their decision-making level, minimising noise and overload.
- Strengthens issue-to-action linkage: Issues detected in PQCDSM assessments can be connected to actions, owners, and follow-ups, helping teams move beyond observation to resolution.
- Improves escalations discipline: Problems that cannot be resolved at one tier remain visible as they move upward, maintaining context and preventing repeated discussions.
- Supports evolving metric definitions: As priorities shift, teams can refine PQCDSM metrics, targets, or thresholds without rebuilding boards from scratch.
- Enhances review consistency across teams: A shared digital structure ensures PQCDSM evaluations follow a similar flow across shifts, departments, and sites.
- Builds performance memory: Old PQCDSM data and past actions stay accessible, assisting teams identify patterns rather than reacting to isolated events.
- Reduces reliability on manual updates: Digital boards reduce the effort needed to maintain PQCDSM, enabling teams to prioritise problem-solving than reporting.
- Scales PQCDSM beyond a single line or site: As functions grow, digital PQCDSM boards help maintain alignment without increasing management complexity.
Case study: How PQCDSM drives real results in different sectors
Let's look at real life examples of industries using LTS Data Point PQCDSM boards to transform their operations.
Aerospace and defence industry
An aerospace and defence manufacturer struggled with scattered visibility across productivity, quality, and delivery metrics in highly regulated, low-volume production environments. PQCDSM records were monitored across disconnected systems and manual logs, making it hard to spot emerging risks early. Delayed escalation of problems frequently led to schedule slippages, rework, and increased cost pressure on long-lead components.
By adopting digital PQCDSM boards supported by LTS Data Point, the company brought together productivity, quality, cost, delivery, safety, and morale metrics into organised daily and tier-based reviews. Upgraded transparency aided teams surface deviations earlier, escalate risks with full context, and strengthen accountability – supporting schedule adherence, compliance discipline, and more predictable operational performance.
Textile and apparel industry
A textiles and apparel manufacturer faced challenges balancing productivity, quality, and delivery across labour-intensive, fast-changing production lines. PQCDSM metrics were observed manually and reviewed inconsistently, limiting visibility into bottlenecks, absenteeism impacts, and quality defects during peak order cycles. This led to missed delivery commitments and fluctuating production efficiency.
Using LTS Data Point digital PQCDSM execution, teams centralised daily performance tracking across the six dimensions. Digital visibility permitted faster detection of line-level issues, clearer preference during daily reviews, and better coordination across shifts – aiding stabilise output, enhance delivery reliability, and support workforce engagement.

Geandra Queiroz, Operations Management Consultant
Geandra is an Operations Management Consultant at Lean Transition Solutions, specialising in Lean philosophy, Lean Six Sigma, and strategic planning across manufacturing and healthcare. She is currently completing her PhD in Industrial Engineering at the Federal University of São Carlos, researching the integration of Operations Strategy, Lean, and Green Manufacturing.