Visual Management in Healthcare: Simplify Operations with Smart Visual Boards
Last updated on : November 3, 2025
Healthcare industry focuses on sensitive issues like the patient satisfaction, regular checking and maintenance of machines, employee efficiency and satisfaction etc. Any failure or mismanagement in these areas can cause the failure of achieving goals and worse, the lives of several individuals. It is utmost important to keep track on these issues accurately and regularly.
What do you mean by healthcare management?
Healthcare management involves overseeing the functioning of healthcare organisations such as hospitals, clinics, nursing homes, and public health agencies. The primary goal of healthcare management is to ensure that the patients receive high quality care and that the healthcare facilities operate in a smooth and sustainable manner.
What is visual management in healthcare?
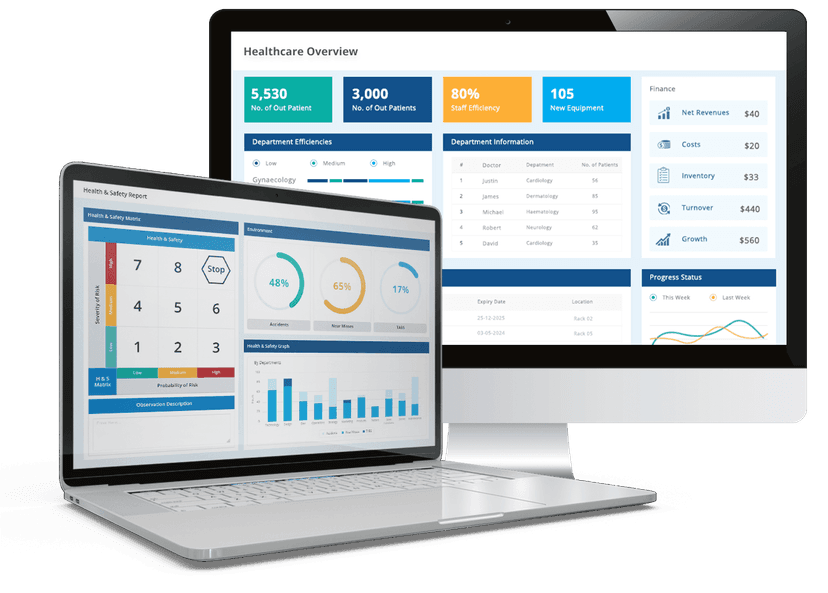
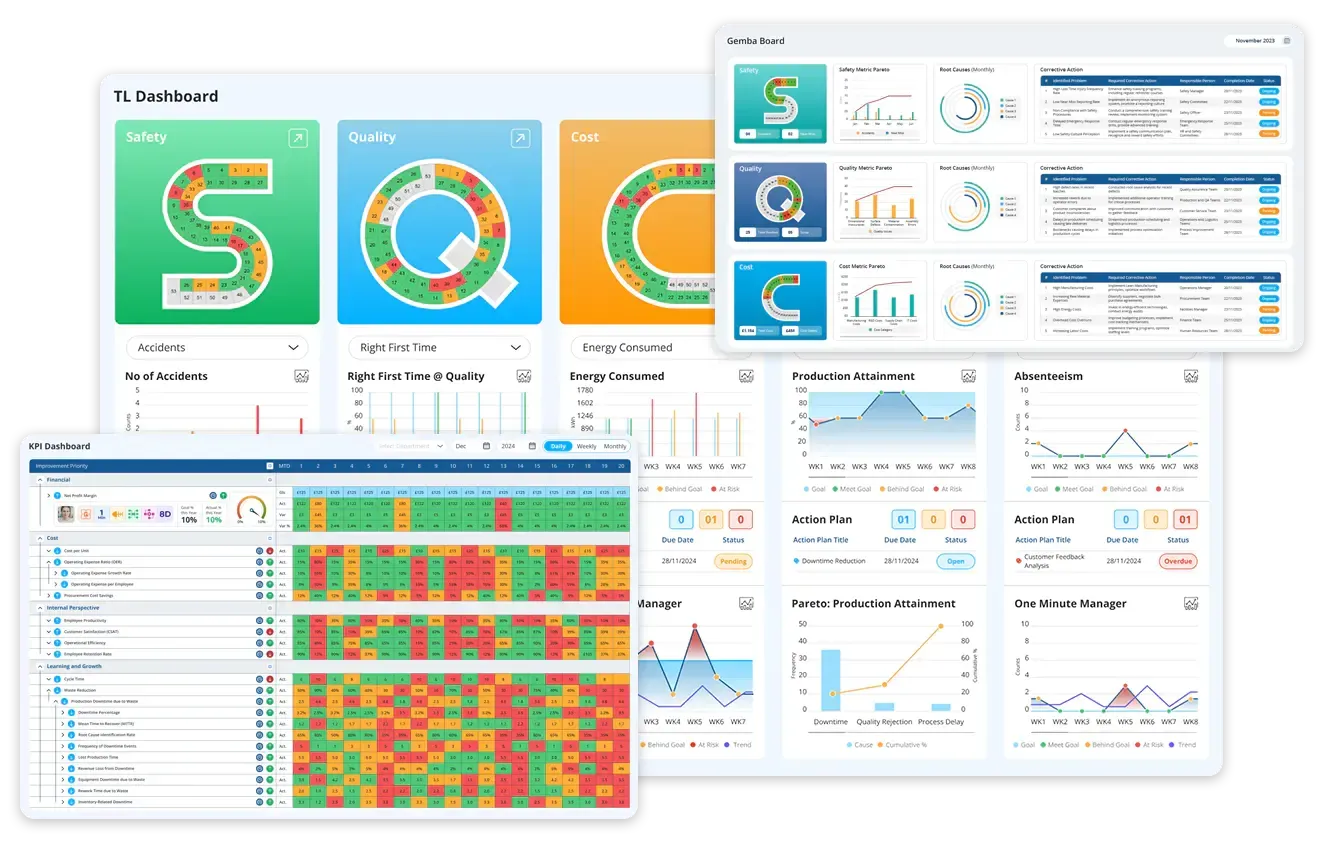
As the name suggests, healthcare visual management tools provide data visually simplified in a manner everyone can understand and interpret. Digital visual management tools in healthcare takes this recording and presenting of data to the next level. Digital visual management tools act as a software easily accessed by staff from anywhere anytime, data that is accurate and up to date.
Let's see what kinds of hospital visual management tools are available and how they can be used in healthcare management.
Know more about visual management boards
A Visual Management Board (VMB) is a tool used by healthcare industry to present quantitative and qualitative data regarding performance, workflow, and improvement projects in a manner that is easy to interpret from a single glance.
Traditional visual management boards were physical boards that utilised charts, colour-coded metrics or tables. In a clinical unit, daily or weekly huddles were assigned where staff reviewed performance, discussed issues, and coordinated tasks, based on this board. The commonly presented Healthcare Key Performance Indicators (KPIs) includes safety measures, patient outcomes, operational efficiency, and acceptance of standard protocols.
Nevertheless, in the age of digital growth and artificial intelligence, visual management boards too have digitalised resulting in significant growth in healthcare industry. Let's explore how.
Experience the future of healthcare visual management with Data Point visual boards
Virtual visual management boards
Traditional Visual Management Boards (VMB) had several limitations making it visually cluttered and difficult to use. Digital VMBs solved this issue, making it accessible as a software with easy-to-customise features. Some of the benefits include:
- Real-time data access: Automatic updating of metrics gave access to timely information to frontline staff and the right authorities.
- Enhanced collaboration and accountability: Digital tracking of tasks, assigning responsibilities, and document follow-ups can be done by team members.
- Integration with analytics: Can connect with analytics platforms to generate control charts, trends, or AI-driven insights that aids informed decision-making.
- Scalability: Can support multiple sites or departments while maintaining consistent data and visual formats.
- Remote access and flexibility: Employees can have full access to visual performance data anytime anywhere.
Learn how visual tools can transform your healthcare workflows
Types of Visual Management Board templates and how they help in healthcare management
Some of the visual frameworks which are part of visual management board templates and how they aid in healthcare management:
A Balanced Scorecard (BSC) is a visual framework that tracks healthcare performance across multiple perspectives rather than focusing solely on financial outcomes. In the context of healthcare, it aligns day-to-day operations with long-term strategic goals, integrating various needs of stakeholders – patients, clinicians and administrators.
It unites the four perspectives – Financial, Customer, Internal processes, and Learning and development (FCIL). In healthcare context, BSC deals with cost customisation without compromising care quality (F), patient care and patient satisfaction (C), the accurate tracking of healthcare facilities and services (I), and the training of staff enabling them to grow continuously (L). Further benefits are:
- Enables strategic alignment of hospital goals with operational performance, connecting organisational objectives, patient outcomes, and staff development.
- Tools such as dashboards and stage-gate review processes enables leaders to monitor and adjust interventions based on metrics from all perspectives – FCIL.
For accurate healthcare management with a Balanced Scorecard, you need to keep track of the right metrics. For more details, visit our blog: 10 Quality Metrics in Healthcare You Can Track with Balanced Scorecard Software
2. SQDCPS
SQDCPS stands for Safety of the staff and efficiency, Quality of care, Delivery and proper utilisation of resources, Cost reduction without compromising quality, Patient care and medication, and handling multiple Site healthcare facilities.
How the board helps to achieve it:
- Enhances patient safety by visualising risks and incident trends.
- Improves quality of care with real-time monitoring of service outcomes.
- Optimises resource utilisation without compromising care quality.
- Supports staff engagement and performance management.
- Blends in sustainable initiatives like eco-friendly practices, well organised energy usage, and community health metrics.
- Motivates site-specific actionable improvements, necessary for hospital facilities and outpatient services.
- Supports alignment with regulatory and license requirements for sustainable healthcare delivery.
3. SQDCM
SQDCM stands for Safety of the patient and staff, Quality of care, Delivery of resources and medication, Cost reduction by proper utilisation of resources, and strict adherence to Morale – rules and regulations.
How the board helps to achieve it:
- Incorporates workforce well-being as a key metric, identifying its impact on quality and safety.
- Allows visualisation of department-level KPIs, highlighting areas needing immediate intervention.
- Runs daily huddles, continuous improvement, and lean healthcare practices.
Furthermore, there are lean visual tools that also add to visual management in healthcare. Let's explore further.
See how visual boards simplify healthcare management
Lean visual tools: Visual planning tools and how they are used in healthcare management
A one-minute huddle board in healthcare management is a brief, visual management meeting where healthcare professionals quickly review daily tasks, patient safety concerns, and work priorities. It enables fast communication, problem recognition, and alignment across the staff at the beginning of a shift.
- Increases team responsiveness and engagement.
- Provides transparent and continuous feedback loops for staff without time consuming meetings.
- Improves patient safety and service outcomes by linking frontline action with performance data.
- Enables remote monitoring in large or multi-site hospitals
In healthcare management, a fishbone diagram is a visual planning tool used to recognise and analyse root cause of issues affecting patient care and operational processes. It helps healthcare teams regularly explore contributing factors to improve quality and safety.
- Aids in enhanced Root Cause Analysis (RCA) such as causes of medical errors, workflow inefficiencies, and patient safety issues.
- Digital tools enable multiple stakeholders – physicians, nurses, administrators etc. – to access and update the diagram in real-time, thus motivating, interdisciplinary collaboration.
- Digital diagrams can be easily integrated with healthcare information systems, electronic medical records, and quality dashboards. This allows linking of causes to actual performance metrics by keeping tabs on incident frequencies, and analysing trends, enabling data-driven and evidence-based problem-solving easier.
- Digital fishbone diagrams enable teams to quickly modify, expand or reorganise cause categories. Automated control version ensures that all edits are tracked, reducing confusion during repetitive problem-solving sessions.
- Since it provides clear visual representation suitable for reports, audits, and presentations, they can easily be shared, exported or archived to document improvement initiatives, making it valuable for regulatory compliance and internal quality reviews.
- By acting as educational tools in training healthcare staff about workflow analysis, and quality improvement, monitoring executed changes and assessing their lasting effect on outcomes contributing to continuous improvement of healthcare processes.
3. 8D Analysis
8D analysis is an eight-step problem-solving system used in healthcare management to recognise, eliminate, and prevent repeating issues, improving operational efficiency and patient care quality. This approach encourages cross-functional teamwork and data-driven decision-making to address complex problems effectively.
- Provides a clear step-by-step visual framework for recognising, analysing and resolving healthcare operational problems, helping prevent repetitions and ensuring regular resolution of complex issues.
- Promotes cross-functional teamwork among all the staff. Assigning roles and real-time collaboration ensure shared responsibility and clear tracking of corrective actions.
- Enables root cause analysis (RCA).
- Advanced dashboards and analytics enable healthcare management easy by aiding in making timely decisions based on real-time data, trends, and KPIs, reducing delays and operational risks.
- Enables centralised documentation and compliance.
- Continuous tracking and improvement
- Ensures improved patient outcomes and satisfaction.
- Ensures cost reduction and resource optimisation without compromising on quality care.
4. Mind Map
Mind map is a visual planning tool that records data in a branched manner. It helps healthcare organisations to record complex information in a more easily comprehensible manner.
- Complex information – patient records, treatment plans, and operational workflows – is presented visually enabling easy comprehension and analysing among healthcare professionals.
- Supports quicker and more accurate decision-making enabling healthcare associates to assess risks, compare treatment options, and plan workflows efficiently.
- Enables multiple team members to update and contribute simultaneously encouraging interdisciplinary teamwork in healthcare industry.
- Helps breaking down complex challenges into manageable branches increases problem-solving capabilities.
- Secures improved compliance and policy monitoring, ensuring that the healthcare staff follows guidelines correctly.
- Enables healthcare professionals preserve detailed information like treatment steps, medication management, and patient history more effectively.
- Helps in tracking and visualising patient care plans, treatment, and outcomes.
- Enables time-saving and efficient workflow.
- Encourages creative thinking for process improvement and innovation by linking ideas, recognising patterns, and generating new approaches.
- Allows integration with digital technologies.
Hospital visual management real world example: Is it worth it?
Having all the medical data is not enough. Smart tracking of medical KPIs and accessibility across various departments is a must.
Most hospitals collect several medical and operational data and end up struggling to make it accessible and meaningful for daily decision-making. This is where healthcare visual management systems come into play.
Let's look at an example from a behavioural health provider that faced challenges with low treatment-plan completion, inconsistent staff performance, and limited visibility into clinical productivity.
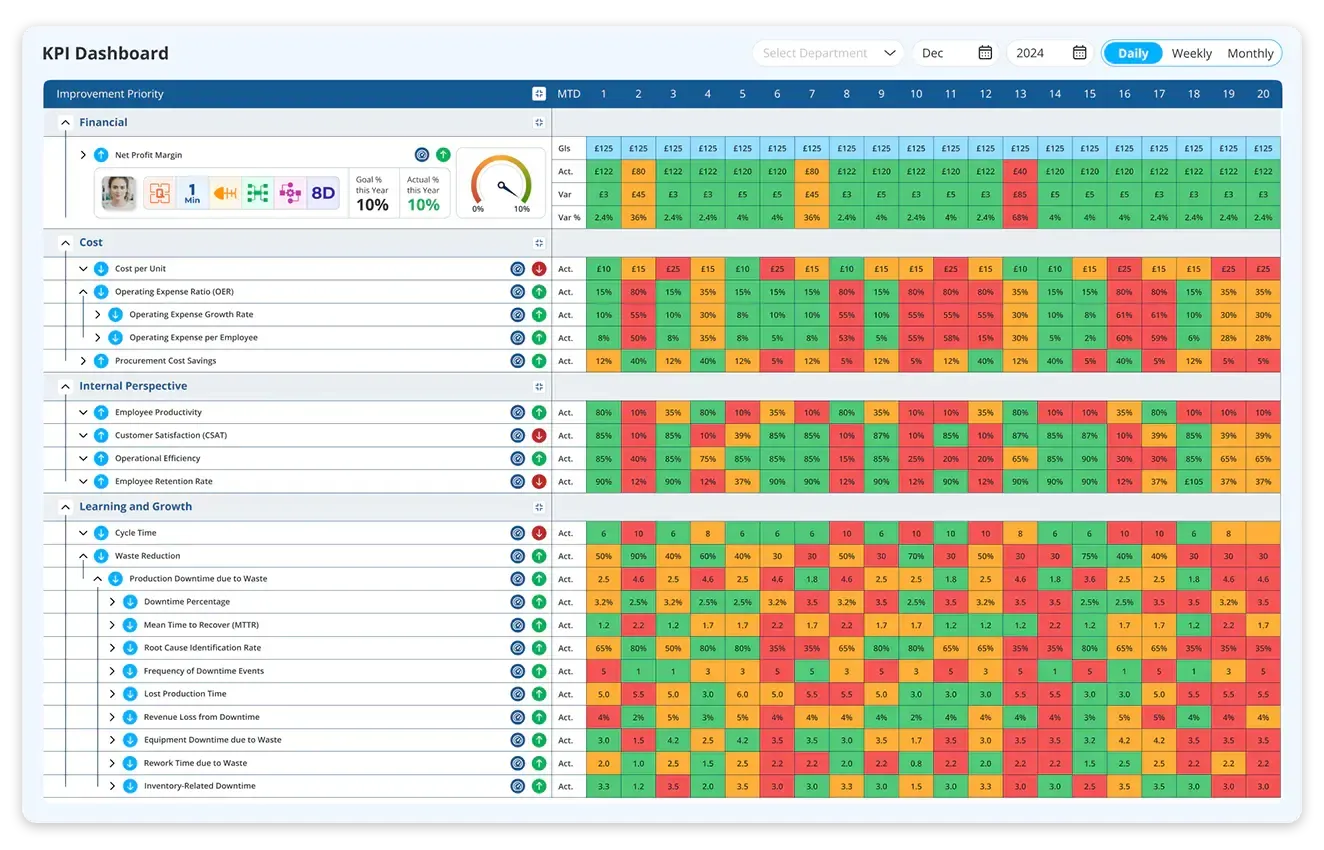
To address these issues, the organisation introduced a data-driven visual management system, using digital dashboards to track real-time operational and clinical KPIs. The visual boards displayed key metrics such as:
- Patients experience metrics: patient satisfaction and patient effort.
- Operational efficiency metrics: patient wait time, average length of stay, and bed occupancy.
- Technology metrics: percentage of staff using digital tools.
- Financial metrics: cost-per-procedure and cost savings from digital operations.
- Clinical outcome metrics: readmission and error rates, early detection success.
These medical visual dashboards made critical data accessible to every department, encouraging cross-functional responsibility and continuous improvement. Medical professionals were able to identify bottlenecks, spot performance gaps, and act before small issues escalated.
Just after three months of implementation, the results were remarkable – a 30% increase in revenue, 25% rise in treatment-plan completion, and a 20% improvement in case-rate eligibility.
Your wise choice: LTS Data Point visual management system
Keeping tabs on healthcare facilities and services is more than important – it is a necessity. LTS Data Point provides the best visual hospital management system that can be customised according to your unique needs, providing the most efficient visual management tools for tracking performance. LTS Data Point also provides expert guidance that helps you choose and implement frameworks to attain goals strategically.
Choose LTS Data Point software solutions and make it easier and much quicker.
Why delay? Get it now!
Book a free demo with Data Point right now
FAQs
1. What is the role of Visual Management Board (VMB) in healthcare?
VMB is a tool used to display KPIs, workflow data, and improvement initiatives in a visual format. It helps healthcare staff track safety, quality, and operational metrics with ease.
2. How does virtual VMBs benefit healthcare organisations?
Digital VMBs provide access to real-time data, improved teamwork, integration with analytics platforms, scalability across various departments, and remote access, resulting in improved decision-making and streamline healthcare operations.
3. What are the most common visual frameworks used in healthcare management?
Frameworks such as SQDCPS, SQDCM, and FCIL are most used. Each of these frameworks focuses on different aspects like safety, quality, staff engagement, leadership development, and strategic alignment with healthcare goals.
4. How do lean visual tools support healthcare management?
Lean tools such as the One Minute Huddle Board, Fishbone Diagram, 8D Analysis, and Mind Maps aids in root cause analysis (RCA), team engagement, continuous improvement, and visualising complex healthcare data for improved decision-making.
5. How can visual management tools improve patient outcomes?
By allowing timely interventions, tracking performance metrics, and fostering collaborative problem-solving, they contribute to improved patient safety, satisfaction, and overall care quality.
6. Can these tools be used for multi-site healthcare facilities?
Digital visual management tools are scalable and can be accessed across multiple locations, ensuring consistent data formats and performance monitoring throughout the organisation.
7. What is the role of visual boards in regulatory compliance?
VMBs help document and track compliance-related metrics, making it easier for healthcare organisations to meet licensing and regulatory standards through transparent and traceable data.

Amer Jumah, Senior Lean Consultant
Amer is co-founder of Agile Solutions and a certified Six Sigma Black Belt, Lean Black Belt, and PMP, with over nine years of experience implementing Lean, Six Sigma, and Agile principles across diverse industries. He specialises in process optimisation, waste elimination, and delivering cost savings through organisational change.