Lead with now: Why 2026 is for real-time KPI dashboards
Last updated on : December 13, 2025
2026 will define a new standard for leadership.
Not leadership that waits for reports. Not leadership that reacts after results are locked in. But leadership that leads with now.
For operational leaders, continuous improvement leaders and strategy owners, the shift is clear. Decisions can no longer depend on monthly summaries or delayed dashboards. To perform in 2026, leaders must see performance as it unfolds.
That is why 2026 real-time KPI dashboards are becoming essential leadership infrastructure.
They do not just show numbers. They shape how leaders think, act and improve.
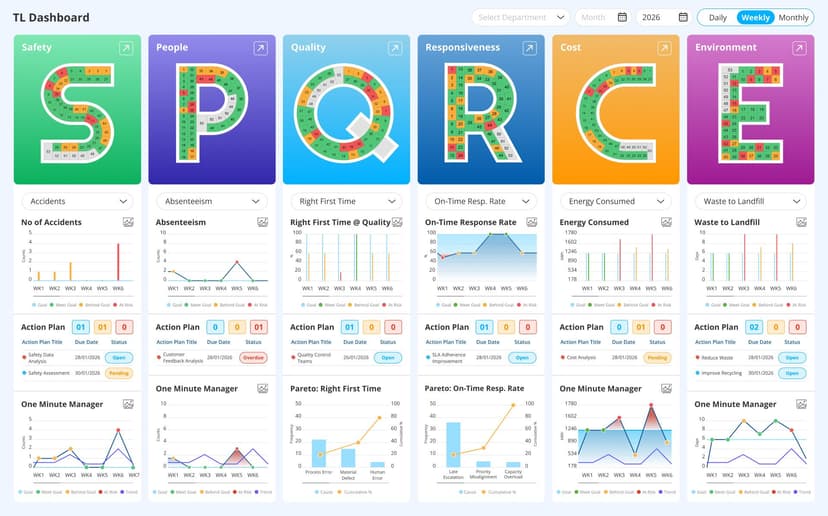
See how 2026 real time KPI dashboards of LTS Data Point work in practice
Why leadership models break down without real-time KPI dashboards?
Traditional leadership rhythms were built around periodic reviews. KPIs were collected, analysed and discussed after the fact. This created distance between work and decision-making.
In 2026, that distance becomes dangerous.
Operational complexity, global teams and faster customer expectations mean leaders must stay connected to reality continuously. When KPIs arrive late, leaders manage outcomes instead of shaping them.
Real-time KPI dashboards remove this gap.
They give leaders immediate visibility into:
- Operational flow and bottlenecks
- Quality and delivery risks as they emerge
- Alignment between daily execution and strategic intent
This is why leadership effectiveness in 2026 increasingly depends on real-time KPI dashboards, not retrospective reporting.
An example of 2026 real-time KPI dashboard from manufacturing industry
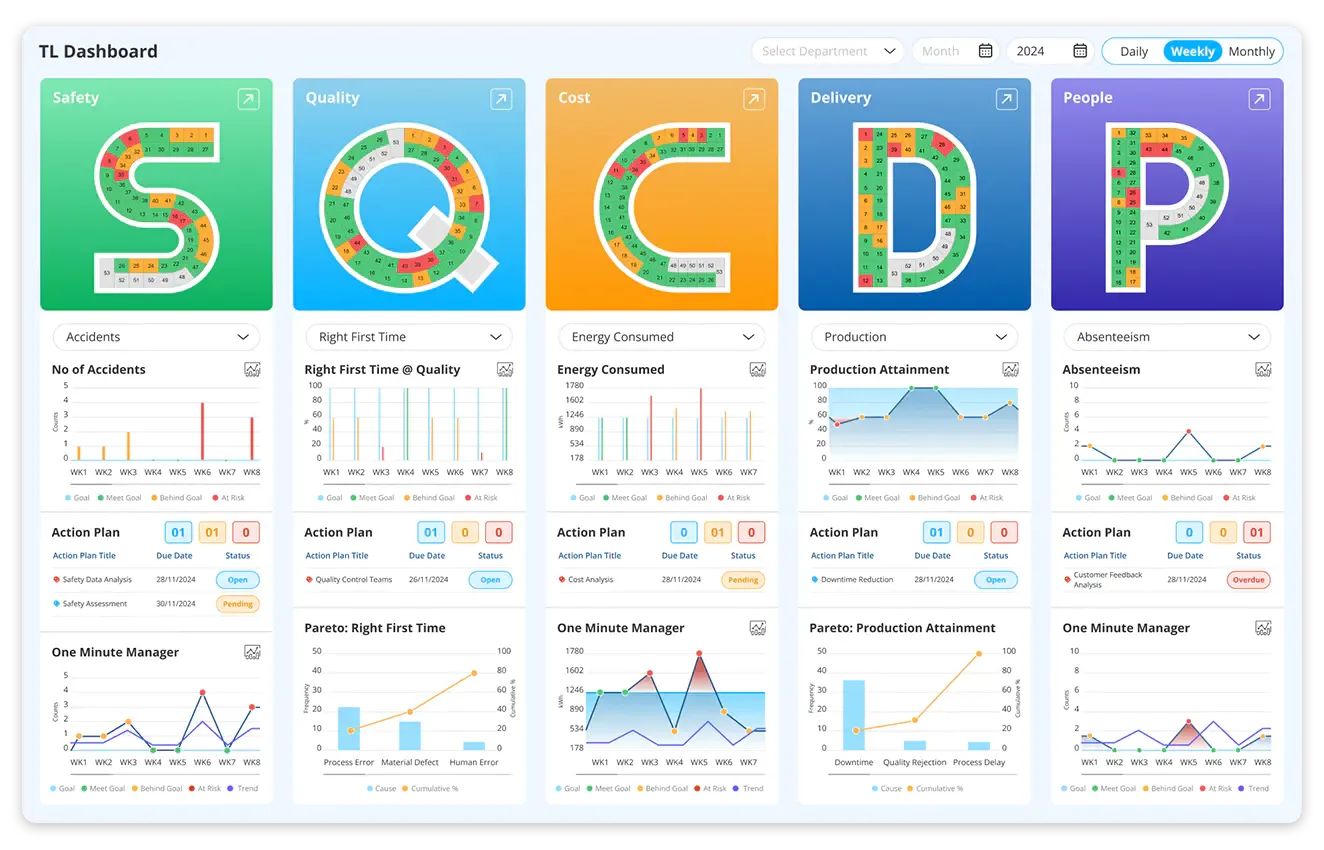
Look at the LTS Data Point SQCDP real-time huddle dashboard is designed to mirror how manufacturing leaders actually review performance. Each pillar presents goal vs actual status at the top, supported by live visual layers that move leaders from signal to action in one screen.
What leaders see and act on in real time:
- Goal vs actual performance (RAG status): Each KPI clearly shows whether performance is meeting target, behind goal or at risk, allowing leaders to assess stability across Safety, Quality, Cost, Delivery and People within seconds.
- Live KPI trend graphs: Trend charts show how performance is moving across days and weeks, helping leaders distinguish one-off variation from systemic drift.
- Pareto analysis for focus: Pareto charts highlight the few causes driving most losses, guiding leaders to prioritise the right problems instead of spreading attention thin.
- One minute manager view: Simple, time-based visuals show daily performance behaviour, enabling fast conversations on what changed, when it changed and why.
- KPI-linked action plans: Each KPI includes a visible action plan with owner, due date and status, ensuring accountability and follow-up are built into the review, not handled separately.
- Category-level KPI visibility: Leaders can instantly view all KPIs within a pillar, supporting structured review flow and faster prioritisation during daily and weekly huddles.
- Expanded KPI trends for deeper insight: Scroll through and expand all KPI trends, switch views, or open quad charts instantly, enabling deeper analysis when needed without disrupting the review rhythm.
Together, these elements ensure the dashboard answers three leadership questions in real time:
Are we on target? What is changing? What action is needed now?
This is what makes a 2026 real-time KPI dashboard more than a reporting tool. It becomes a live management system that connects performance, problem-solving and execution in a single view.
Start using your custom KPI dashboard
Lead with now: the operating principle of 2026 leaders
Leading with now means making decisions based on what is happening, not what has already happened.
In practice, this requires a shift in how KPIs are used.
In organisations preparing for 2026, leaders are moving from:
- Static dashboards → Live KPI dashboards
- Periodic reviews → Continuous performance awareness
- Centralised analysis → Empowered decision-making at the edge
- Corrective action → Preventive action
Real-time KPI dashboards make this possible by turning KPIs into live signals rather than historical records.
For continuous improvement leaders, this means problems surface early. For operational leaders, it means flow can be stabilised before disruption spreads. For senior leaders, it means strategy stays connected to execution.
Why 2026 accelerates the demand for real-time KPI dashboards?
Three leadership pressures converge in 2026.
Speed of improvement cycles
Continuous improvement can no longer operate on delayed feedback. Kaizen depends on fast learning loops. Real-time KPI dashboards shorten the time between action, result and adjustment.
Execution pressure on strategy
Strategies are increasingly dynamic. Without real-time KPI dashboards, leaders lose visibility between planning cycles. Live dashboards ensure strategy is instrumented, not assumed.
Distributed leadership
Decision-making is moving closer to the front line. Leaders must create shared visibility so teams act with confidence. Real-time KPI dashboards provide one version of truth across levels.
These forces make 2026 real-time KPI dashboards a leadership necessity rather than a technology upgrade.
How real-time KPI dashboards transform leadership behaviour
The most powerful impact of real-time KPI dashboards is behavioural.
Leaders using live dashboards in 2026 demonstrate four distinct shifts.
From inspection to awareness
Leaders stop inspecting performance after the fact and start staying aware of it continuously.
From control to trust
When KPIs are visible in real time, trust replaces micromanagement. Teams know the score and act accordingly.
From reaction to anticipation
Patterns emerge earlier, allowing leaders to intervene before problems escalate.
From meetings to momentum
Less time is spent preparing reports. More time is spent improving processes.
This is why real-time KPI dashboards are becoming core to modern leadership systems.
What modern real-time KPI dashboards look like in 2026
A 2026 real-time KPI dashboard is not a faster spreadsheet.
It is:
- Integrated with systems such as ERP, MES and QMS
- Structured around strategy and continuous improvement priorities
- Designed to show cause-and-effect between KPIs
- Built to trigger action, not presentation
Balanced Scorecards, SQCDP and operational dashboards operate together as one system. This ensures that leaders see how daily performance influences long-term objectives.
This integration is what separates reporting dashboards from real-time KPI dashboards built for leadership.
Experience live KPI visibility with LTS Data Point and boost ROI.
Why real-time KPI dashboards support continuous improvement?
Continuous improvement thrives on visibility and speed.
In 2026, organisations using real-time KPI dashboards consistently:
- Detect waste before it compounds
- Identify quality issues at the first signal
- Improve cross-functional collaboration through shared metrics
- Strengthen ownership by making performance transparent
When teams can see performance live, improvement becomes part of daily work, not a monthly initiative.
The role of LTS Data Point for 2026 leaders: How to achieve best results
To lead with now in 2026, leaders need more than dashboards. They need a connected performance system.
LTS Data Point supports this by enabling:
- Real-time KPI dashboards for operational and strategic visibility
- Digital Balanced Scorecards that align execution with strategy
- Automated alerts that trigger immediate follow-up
- A shared performance language across leadership and teams
For leaders, this means clarity. For teams, it means focus. For organisations, it means faster learning and stronger execution.
The leaders who win in 2026: What makes them stand apart
The leaders who succeed in 2026 will not be the ones with the most dashboards. They will be the ones with the least delay.
They will:
- Lead with now, not later
- Use real-time KPI dashboards to guide daily decisions
- Embed continuous improvement into execution
- Keep strategy alive through live performance visibility
This is why 2026 is for real-time KPI dashboards.
Lead with now: How to make it possible with an advanced operational excellence software
2026 will reward leaders who choose clarity over comfort and visibility over delay.
With LTS Data Point, real-time KPI dashboards become the foundation for operational excellence, continuous improvement and confident leadership.
Stop waiting for reports.
Start leading with now.
See real-time KPI dashboards in action
FAQs
1. What makes LTS Data Point KPI dashboards different from other real-time dashboards?
LTS Data Point dashboards are designed not just for reporting but for live management. They integrate with ERP, MES, and QMS systems, connect KPIs to strategic objectives, and provide actionable insights with built-in ownership, due dates, and status tracking. This ensures leaders can move from insight to action instantly.
2. How does LTS Data Point help leaders “lead with now”?
By providing continuous visibility into operational and strategic performance, LTS Data Point enables leaders to anticipate issues, stabilise processes before disruptions occur, and align daily execution with long-term goals. The dashboards turn KPIs into live signals rather than static data, supporting faster decisions and continuous improvement.
3. What industries benefit the most from 2026 real-time KPI dashboards?
Real-time KPI dashboards are valuable across industries that rely on fast decision-making, operational efficiency, and continuous improvement. Manufacturing, logistics, healthcare, and retail organisations can particularly benefit, as live insights help prevent bottlenecks, improve quality, and align execution with strategy.
4. How do real-time KPI dashboards support remote or distributed teams?
By providing a single version of truth accessible anytime, real-time dashboards allow leaders and teams across locations to make aligned decisions, track performance instantly, and respond to emerging issues without delays caused by traditional reporting cycles.
5. Are real-time KPI dashboards suitable for small businesses or only large enterprises?
While large organisations often implement them first, small and medium businesses can also gain significant advantages. Real-time visibility helps optimise resources, detect issues early, and make strategic decisions faster, regardless of organisation size.
6. How secure is the data displayed on real-time KPI dashboards of LTS Data Point?
Modern KPI dashboards of LTS Data Point integrate advanced security protocols, including role-based access, encryption, and audit trails, ensuring that sensitive operational and strategic data remains protected while still being available for timely decision-making.
7. Can real-time KPI dashboards replace traditional reports entirely?
Real-time dashboards complement, rather than completely replace, traditional reports. While dashboards provide immediate insights for operational and strategic actions, periodic reports may still be useful for historical analysis, compliance, or long-term trend reviews.