Manufacturing Operations Managers — want the best visual platform that end your daily struggles?
Last updated on : November 17, 2025
A day in the life of a Manufacturing Operations Manager
Meet David Harris, a Manufacturing Operations Manager at a growing multi-site factory. Maybe (well, definitely, if you’re managing shop-floor operations day to day), this sounds familiar.
Instead, he’s met with the same problems manufacturing managers search about every day —
“How do I solve disconnected KPIs?”
“What is the best digital tool for manufacturing operations?”
“Which software gives real-time shop-floor visibility?”
“How do I manage performance across plants?”
“How to implement a Digital Lean daily management or SQCDP system?”
David jumps between Excel sheets, MES dashboards, ERP reports, SharePoint logs, and manual updates — yet nothing feels connected. His data exists, but it lives everywhere except where he needs it.
And that’s exactly why tools like LTS Data Point — a connected AI integrated operations visibility platform built for manufacturing KPIs, daily management, and real-time performance control — are becoming essential for modern factories.
Let’s have a look a day in the life of a manufacturing operations manager until he finds the best digital tool for manufacturing operations.
Challenges of a manufacturing operations manager (without a manufacturing operations software)
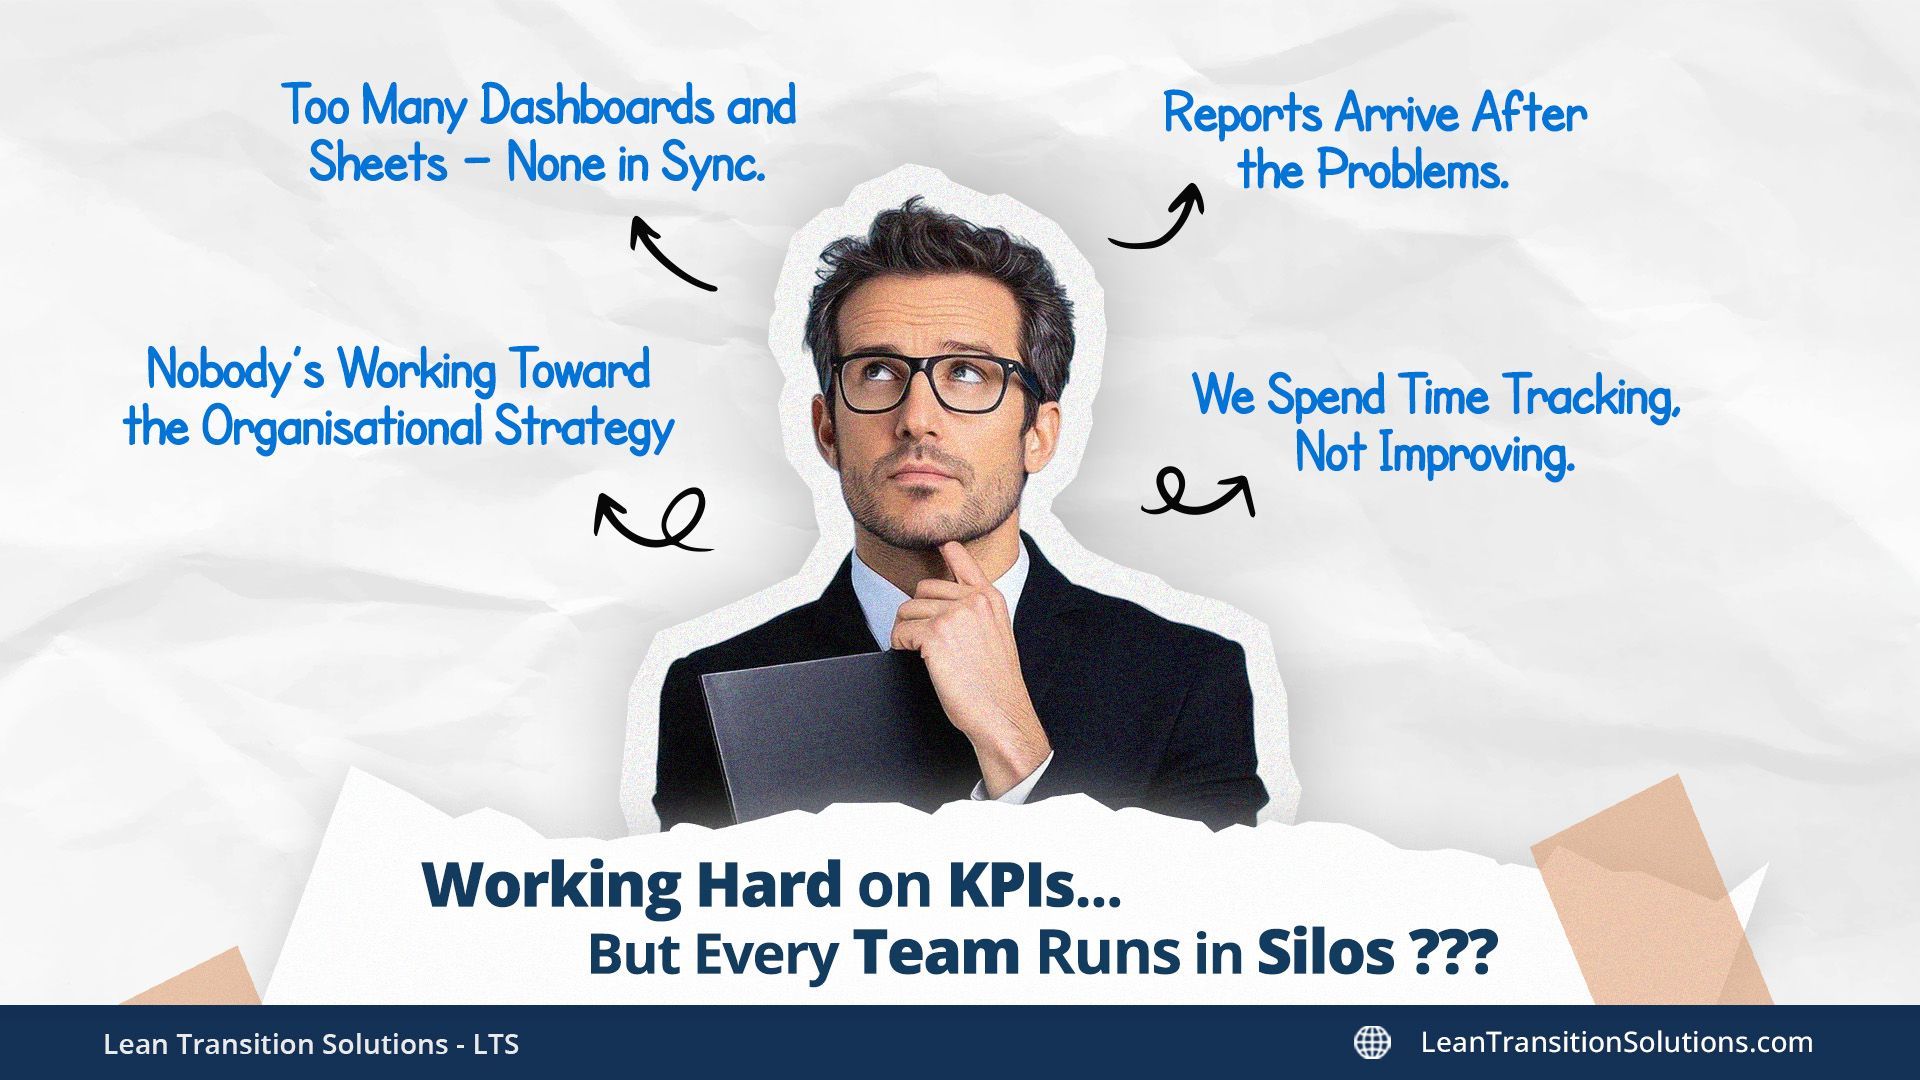
Morning chaos: The daily data storm
- Too many dashboards and spreadsheets, open across different systems none in sync. Production KPIs are in Excel, quality data in SharePoint, OEE on another dashboard, and operator logs in handwritten notes and shop floor white boards.
- 5 Excel sheets emailed overnight, all in different formats
- 3 review meetings before 10 AM
- 0 alignment between what people say and what the data shows
Production, quality, maintenance, planning — everyone reports differently.
Every KPI tells a different story.
Every team sees a different “version of the truth.”
And David has to stitch all of this together… manually.
Get the one platform that unifies KPIs, SQCDP, PDCA, and strategy — all in real time.
Midday mayhem: Firefighting instead of improving
As the shift moves on, the problems start piling up.
- Quality deviation this morning
- Unexpected machine downtime in the afternoon
- Supplier delay planned for tomorrow
- WIP piling up because upstream didn’t sync with downstream
- Operators reporting issues but no structured escalation path
David spends more time reacting than leading.
Instead of improving processes, he’s:
- Following up on missing numbers
- Asking teams to “update the sheet”
- Chasing root causes
- Repeating the same discussions in every tier meeting
It’s a loop that never ends.
End of day: Pressure without clarity
By evening, leadership wants answers.
“Why did downtime increase?”
“Where’s the trend?”
“What actions were taken?”
“Why wasn’t this escalated earlier?”
And like most Manufacturing Operations Managers:
David isn’t short of data, his data just lacks direction.
A Manufacturing Operation manager’s biggest challenge isn’t lack of effort. It’s lack of visibility, alignment, and real-time clarity.
And that’s exactly where LTS Data Point enters his story — the platform that turns operational challenges or chaos into connected clarity.
What if David (or You) could run your entire Manufacturing Operation with one connected visual system?
Let’s imagine David’s world again. But this time, with LTS Data Point at the center of his operations.
A world where every tool he needs is not scattered, but intelligently connected in one real-time visual platform. A connected visual system where every KPI, every deviation, every action, and every team finally moves in sync.
A best manufacturing operations tool kit contains
- One connected view of operations
- Real-time KPI visibility
- Standardised Lean Daily Management
- A digital SQCDP system
- Seamless escalation and issue tracking
- Strategy execution tools, not static dashboards
- Automation, not manual reporting
- A performance system that thinks ahead, not reacts late
Move from traditional shop-floor management to smart, connected, Industry 4.0 operations — with one powerful platform.
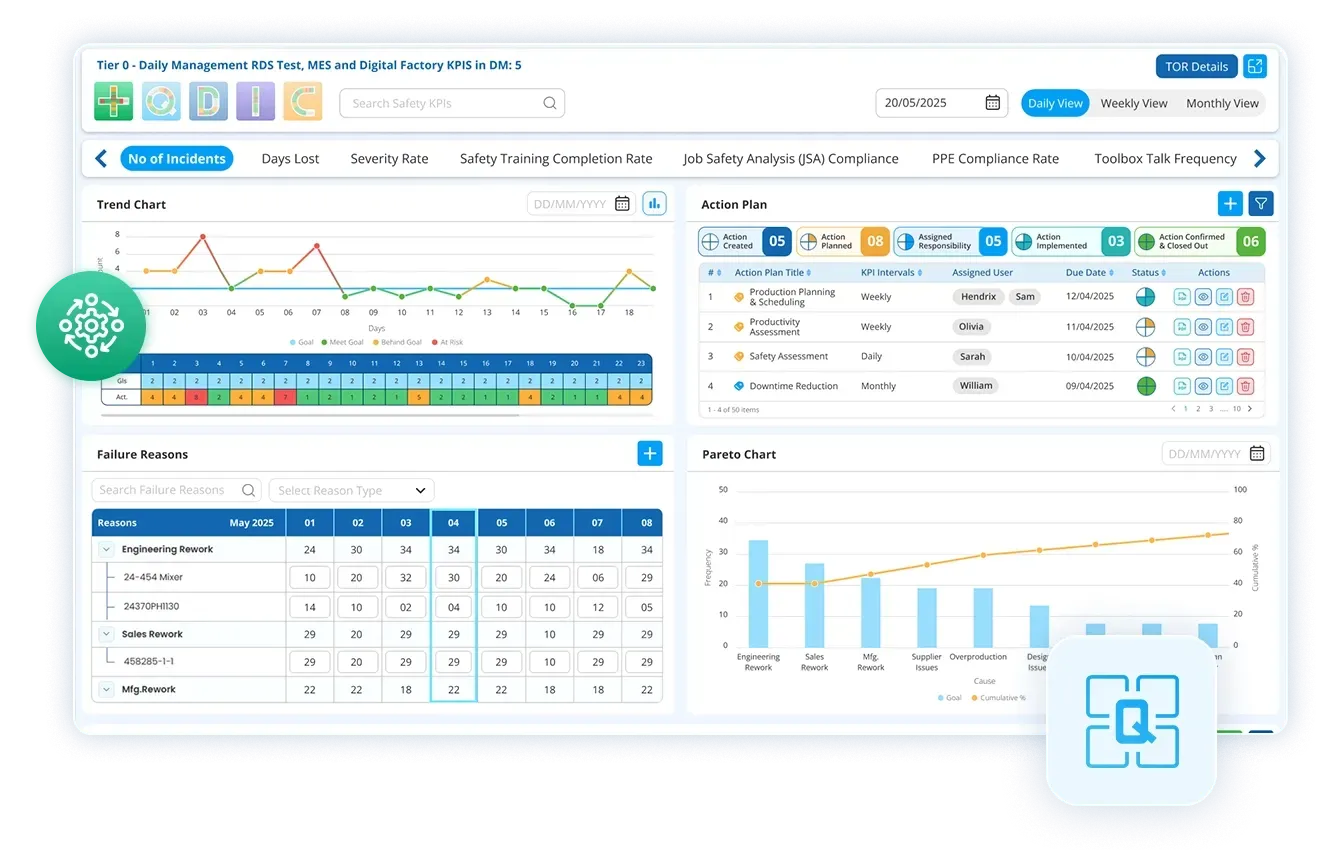
What if you had a One-minute manager board with all shop floor summary?
Start your Gemba meetings after viewing this!
One-minute manager board- a dashboard that summarises key incidents, KPIs, bottlenecks, and corrective actions in under 60 seconds.
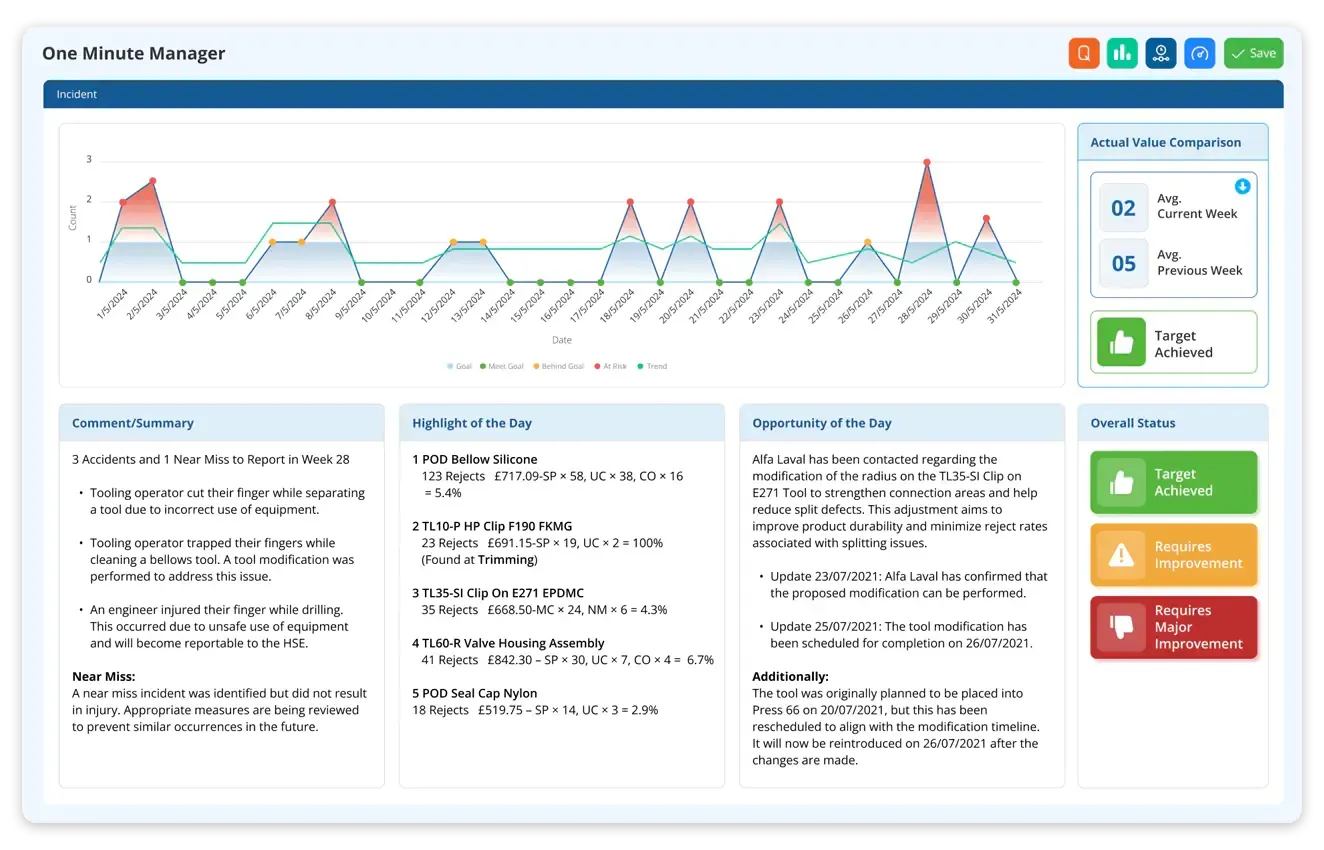
Imagine stepping onto the shop floor with:
- Live deviations
- Action owners
- Risk indicators
- Downtime summary
- Priority hotspots
All visible at a glance — so your Gemba walk becomes strategic, not reactive with this operational excellence platform for manufacturing.
What if you had a live SQCDP or other custom dashboard for daily huddles?
Not a static whiteboard.
Not a PDF someone updates once a week.
But for your Lean Daily Management (LDM) a real-time SQCDP system or any other custom frameworks like SQDCM/SQDC or more is the best solution.
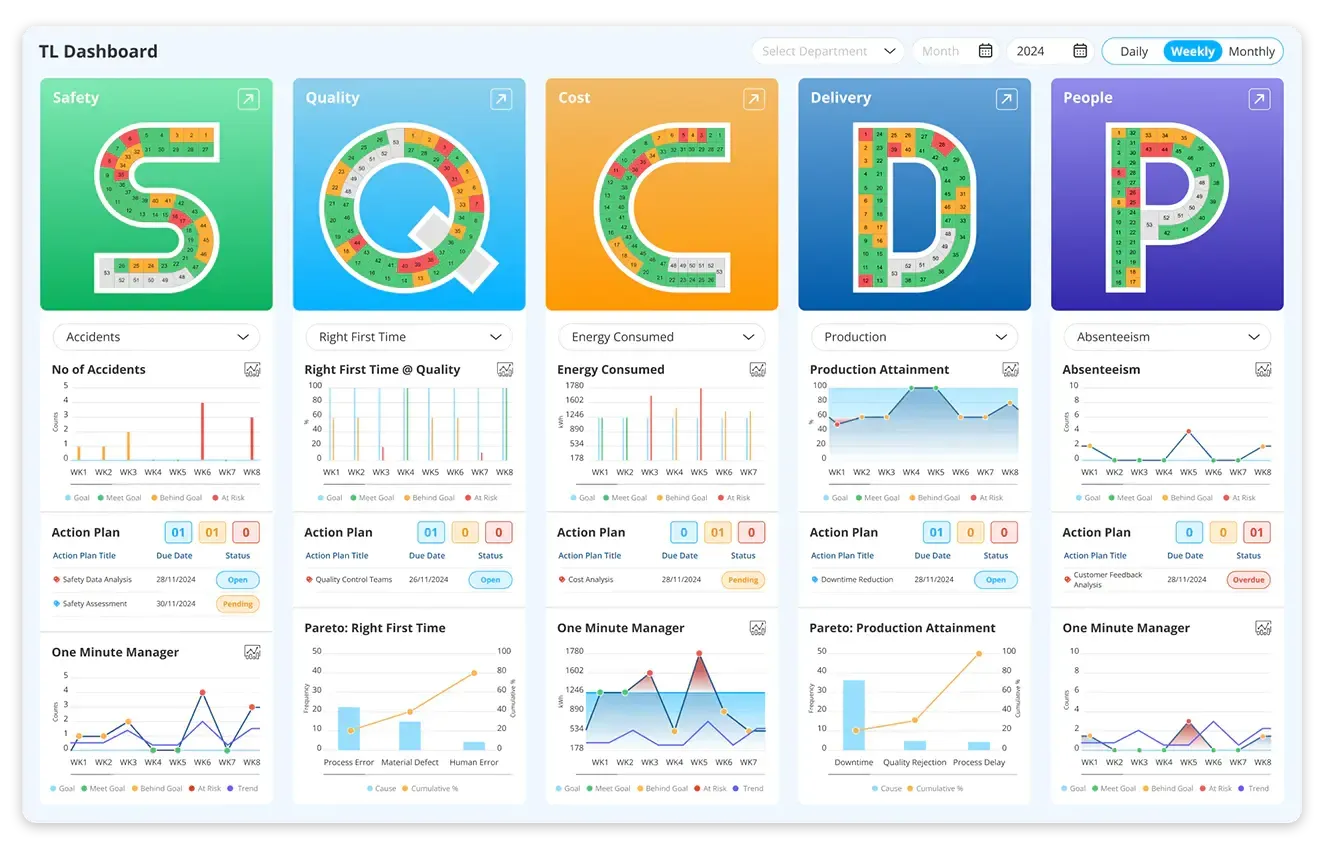
What contains in a best SQCDP digital huddle board:
- Live Safety alerts
- Quality trends and defects
- Delivery performance
- Cost variances
- People insights & attendance
- Pareto analysis
- Root cause logs
- Daily action plan
- Trend charts
Imagine Tier 1 to Tier 3 meetings where every team sees the same truth with this Industry 4.0 visual management system.
Build your Huddle Board in minutes. Add the KPIs you want. See the clarity you need.
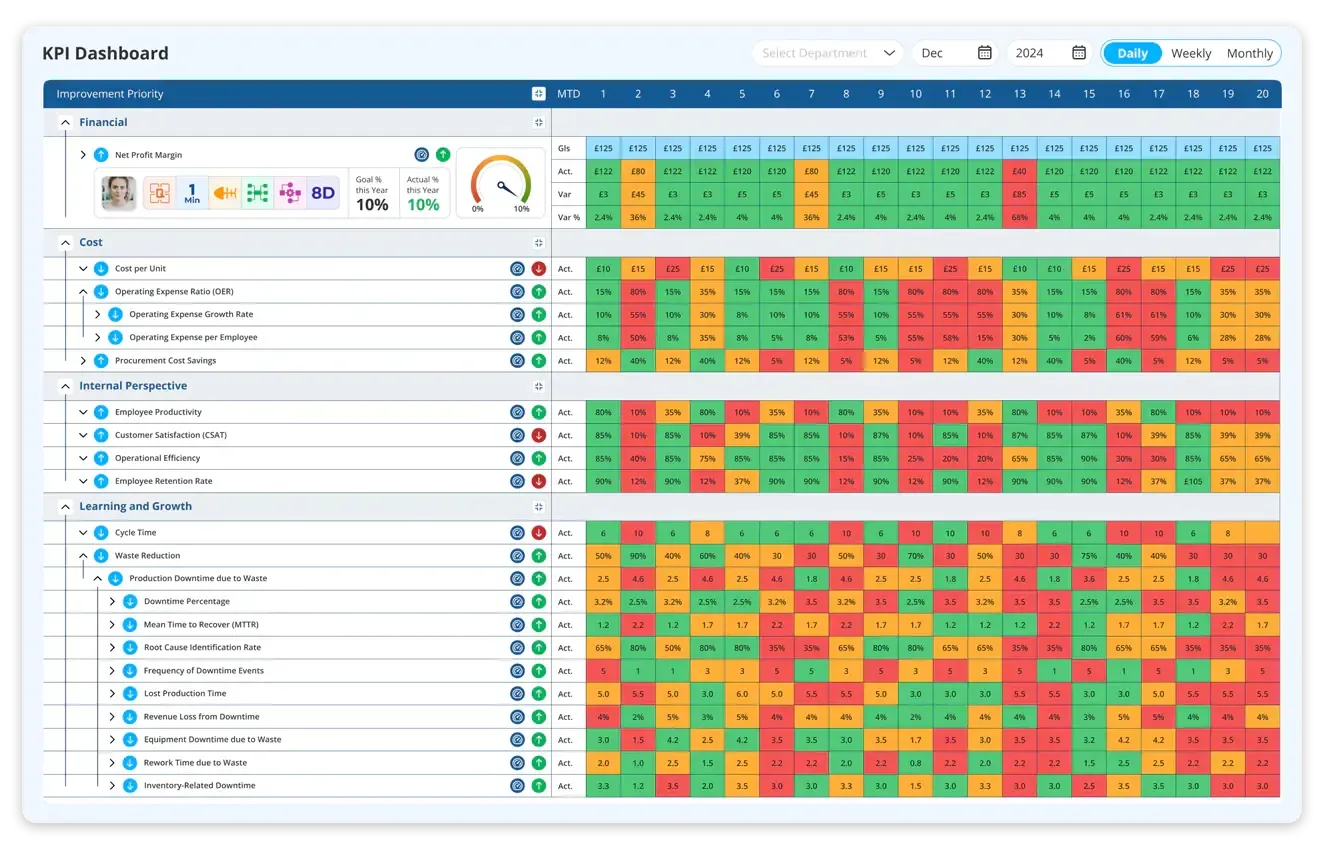
What if you had real-time KPI visibility with scorecard view and deep drill-down?No more waiting for end-of-shift reports.
No more searching different systems.
No more “Is this number, correct?
With Data Point, manufacturing leaders can track and analyse every KPI in minutes — not hours.
They can drill down from:
- Plant → Line → Machine → Shift → Operator → Issue
- KPI → Daily Data → Weekly Trends → Monthly Bowler Chart → Yearly View
- Trend → Variation → Failure Reason → Root Cause → Corrective Action
- Deviation → Escalation Path → PDCA Status → Action Closure
He gets:
- A live scorecard view across Safety, Quality, Delivery, Cost, People
- KPI Bowler charts showing targets vs actuals every month
- Trend charts that instantly reveal patterns and risks
- Custom dashboard views for OEE, defects, downtime, and cycle time
- RAG indicators that highlight performance gaps at a glance
- One-click drill-down to understand exactly where issues originate
Every performance layer in one click.
What if you could analyse any process with a digital Quad Chart?
A Quad Chart diagram inside Data Point brings everything into a single visual frame.
It gives you:
- Trend analysis of KPIs or performance
- Failure reasons
- 5-Why root causes
- Fishbone diagrams
- Pareto charts
David can now walk into a meeting with facts, not guesses.
What if you had a complete digital Hoshin Kanri to check alignment with organisational goals?
Now that David has clarity on KPIs, issues, and daily performance, a bigger question appears:
“Are all these efforts truly aligned with our annual objectives and organisational goals?”
With Digital Hoshin Kanri X matrix, the answer becomes clear in seconds.
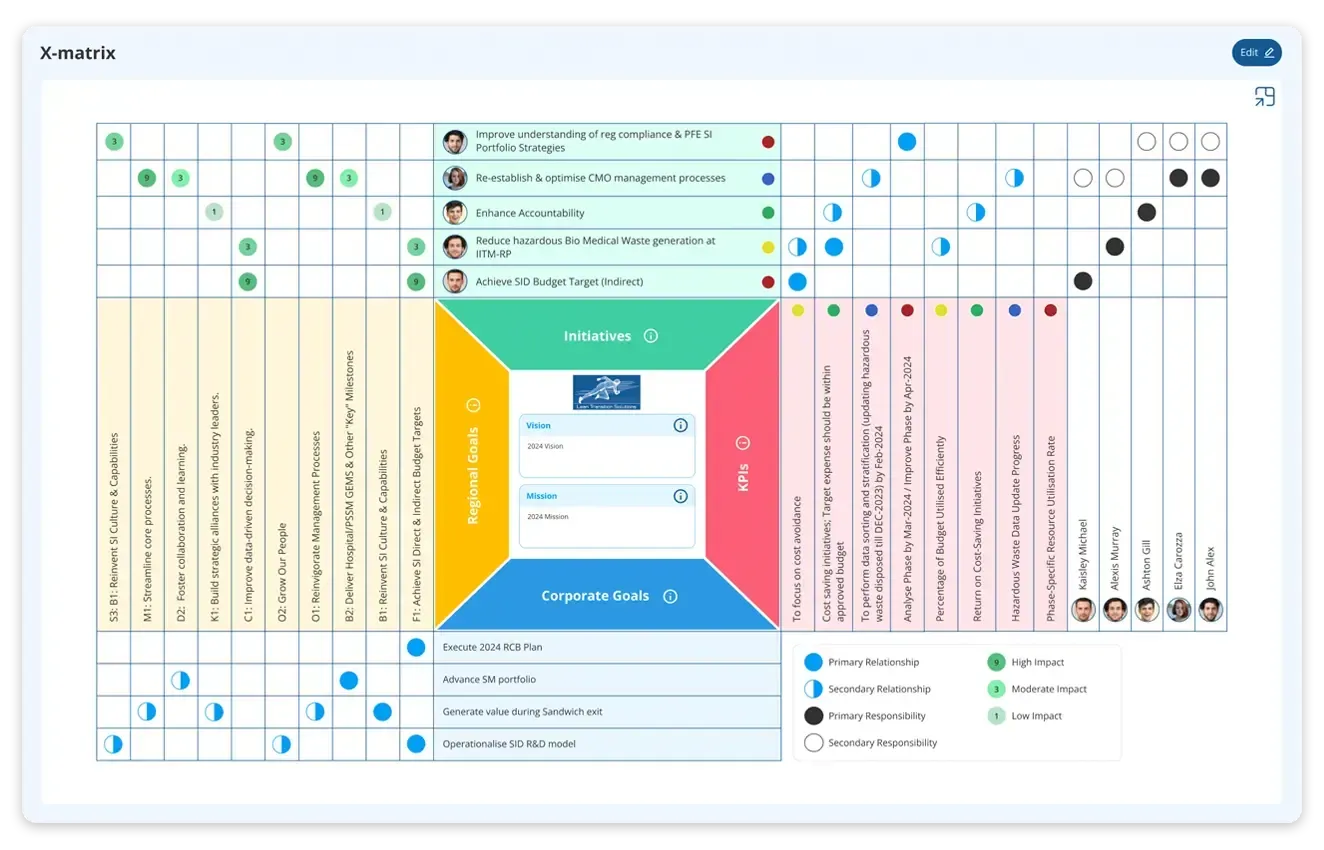
- He starts directly with the X-Matrix to see the company’s top goals
- Drills down into KPIs linked to each objective
- Confirms whether teams, projects, and improvement actions support the right priorities
- Tracks strategy → execution → results with a live objective flow & strategy digital board.
No more strategy trapped in presentations.
No more wondering whether activities match the true north with a real-time KPI & Strategy Execution Platform
Every KPI, every action, every team — aligned automatically.
Let Data Point craft your X-Matrix to keep every activity aligned to strategy.
The best part: MES, ERP, Excel, Power BI, and Tableau all synced automatically
The best part: MES, ERP, Excel, Power BI, and Tableau all synced automatically:
All systems must talk to each other — effortlessly.
With LTS Data Point, integration is not an obstacle or an IT-heavy project.
It’s a built-in capability, designed for fast, reliable, manufacturing-grade data flow.
If needed, LTS Data Point connects with:
- MES for production and downtime data
- ERP for orders, costs, materials, and delivery
- Quality systems for inspections and deviations
- Excel and CSV files for team-level inputs
- Power BI / Tableau for analytics and visual insights
All of these feed directly into one real-time platform — without manual entry, without multiple dashboards, and without waiting for reports.
- Production performance updates instantly
- Quality deviations appear the moment they occur
- Delivery metrics sync automatically
- Every KPI stays accurate and up-to-date
No matter how scattered your data is, we’ll bring it together — and connect you to a single source of truth.
Why visual, connected digital boards are transforming Manufacturing Operations?
Now it is clear that, manufacturing operational managers/ every leader today needs more than dashboards, they need a digital operational platform that helps teams work smarter every day. Track every KPIs you need, especially the KPIs for manufacturing operations managers or the manufacturing KPIs.
With visual, connected digital boards, manufacturers can:
- Run faster, data-driven daily huddles
- Track KPIs in real time using scorecards, bowler charts, and trend views
- Detect deviations early and start PDCA immediately
- Standardise shift reviews and handovers
- Reduce reporting effort by integrating MES, ERP, and Excel data
- Support Industry 4.0 workflows without complicated tool
Real results manufacturing leaders are achieving with a visual management platform
- 60% faster issue resolution
- 40% drop in manual reporting time
- Improved OEE through real-time tracking
- Reduced quality deviations with PDCA
- Higher engagement in daily tier meetings
- Standardised performance reviews across plants
Read the real-life success stories of how manufacturing leaders achieved results and uncover what you’re searching for.
How did the global manufacturer enhanced efficiency with end-to-end digitalisation
An Automobile manufacturer’s path to excellence using SQDCP Boards
LTS Data Point is trusted by manufacturing teams worldwide. Be the next success story.
Why Data Point is the best Excellence Software for Operations Managers?
- Designed for manufacturing complexity
- High security assurance
- Fits multi-site and remote operations
- Supports 100+ integrations
- Easy adoption across teams
Get LTS Data Point – The best Manufacturing Operations Visibility Platform
Imagine the relief David Haris the manufacturing operations manager of a global firm feels, while walking into his operations room and seeing everything he needs to know at a glance.
What make LTS Data Point apart from a common Manufacturing Operations Management (MOM) software is that it controls people, KPIs, performance, strategy, and improvement.
David has gone from firefighting to driving real improvement every day. Are you ready to do the same?
Experience the best visual platform for manufacturing operations managers
FAQs
1. What is the best way to manage daily shop-floor operations?
The most effective method is to run digital SQCDP boards, structured daily huddles, and tiered reviews supported by real-time data.
A platform like LTS Data Point helps standardise these routines across shifts and plants.
2. What are manufacturing operations manager challenges?
Manufacturing operations managers face challenges such as disconnected KPIs, manual reporting, delayed insights, inconsistent shift handovers, siloed data across MES/ERP/Excel, unstructured daily meetings, poor cross-functional alignment, slow root-cause analysis, and the continuous pressure to improve productivity, quality, and delivery with limited real-time visibility.
3. Why is an all-in-one Operational Excellence software essential for modern manufacturing?
Modern manufacturing needs more than dashboards — it needs a central platform that aligns KPIs, connects daily routines, supports SQCDP, drives PDCA, tracks actions, unifies data, and creates real-time visibility across plants and teams. Operational Excellence software eliminates manual work, speeds decisions, and ensures every activity aligns with organisational goals.
4. Why is LTS Data Point called the best manufacturing software for decision-makers?
Because Data Point gives decision-makers complete operational visibility: real-time KPIs, SQCDP dashboards, PDCA workflows, Hoshin Kanri alignment, cross-site comparison, and seamless integration with MES/ERP. Leaders can see performance, identify issues faster, and make confident decisions from a single platform — no switching tools or waiting for reports.
5. What are the solutions for manufacturing operations manager’s challenges?
Operations managers need solutions such as:
- Real-time KPI dashboards
- Digital huddle boards (Tier 1–3)
- SQCDP visual management
- PDCA, CAPA, and root-cause tools
- Hoshin Kanri for strategy alignment
- Cross-plant performance comparison
- Automated reporting
- Seamless MES/ERP integration Platforms like LTS Data Point unify all of this in one system.
6. How to get more visibility in manufacturing operations?
Visibility increases when data from MES, ERP, quality, maintenance, and shop-floor systems are brought into one connected visual platform. Real-time dashboards, scorecards, bowler charts, and deviation alerts help managers see performance clearly and act faster — this is exactly what LTS Data Point enables.
7. What KPIs should an operations manager track?
Key KPIs include:
- OEE (Overall Equipment Effectiveness)
- Downtime & MTTR/MTBF
- Production output & cycle time
- Defect rate & first-pass yield
- On-time delivery
- Cost of poor quality (COPQ)
- Safety incidents
- Attendance & workforce utilization
- Energy consumption
8. What is Manufacturing Operations Management (MOM) software?
MOM software covers planning, execution, and control of production processes.
9. How is LTS Data Point different from a MOM software?
MOM software manages execution — work orders, production tracking, routing, WIP, instructions, scheduling.
LTS Data Point manages performance — KPIs, SQCDP, PDCA, huddles, strategy alignment, RCA, continuous improvement.
In simple terms:
MOM runs production; Data Point runs performance.