SQDIP Explained: How digital dashboards empower leaders to track KPIs
SQDIP is a proven operational excellence framework that helps organisations monitor, analyse, and optimise critical performance metrics across Safety, Quality, Delivery, Inventory, and Productivity. Know more about SQDIP boards that bring Lean principles and Industry 4.0 insights with real-time visibility
Contents
- Introduction to SQDIP- What is SQDIP?
- An example of SQDIP board
- An overview of SQDIP
- Quick guide: SQDIP vs. SQDCP
- What are the SQDIP shop floor metrics and its examples?
- Challenges in traditional paper based SQDIP metrics tracking
- What is SQDIP board?
- What is digital SQDIP or SQDPI board?
- Benefits of digital SQDIP boards
- Which are the industries where we can use SQDIP KPI dashboard software?
- Why is SQDIP a powerful visual management tool in manufacturing?
- How SQDIP visual management boards solve manufacturing or other industry challenges?
- What are the key features of a best digital SQDIP solution?
- Digital SQDIP board for
- How does SQDPI software help in improving safety, quality, delivery, inventory and productivity?
- How to optimise inventory management with SQDIP tool?
- How to enhance productivity with a SQDIP board?
- SQDIP management- Implementation and uses of SQDIP boards
- How to implement SQDIP effectively?
- How to track SQDIP metrics with digital system?
- How to customise a digital SQDIP dashboard for ?
- What is SQDIP meeting and how can you use as ?
- SQDIP for different work tiers: Tailored use across roles and responsibilities
- Elevate your performance with LTS DataPoint’s best digital SQDIP Boards
- Case study: How SQDIP drives real results in different sectors
Last updated on : June 10, 2026
Introduction to SQDIP- What is SQDIP?
SQDIP also used as SQDPI is an acronym that stands for Safety, Quality, Delivery, Inventory, and Productivity. It is an operational excellence framework used to monitor, analyse, and optimise critical performance areas in organisations.
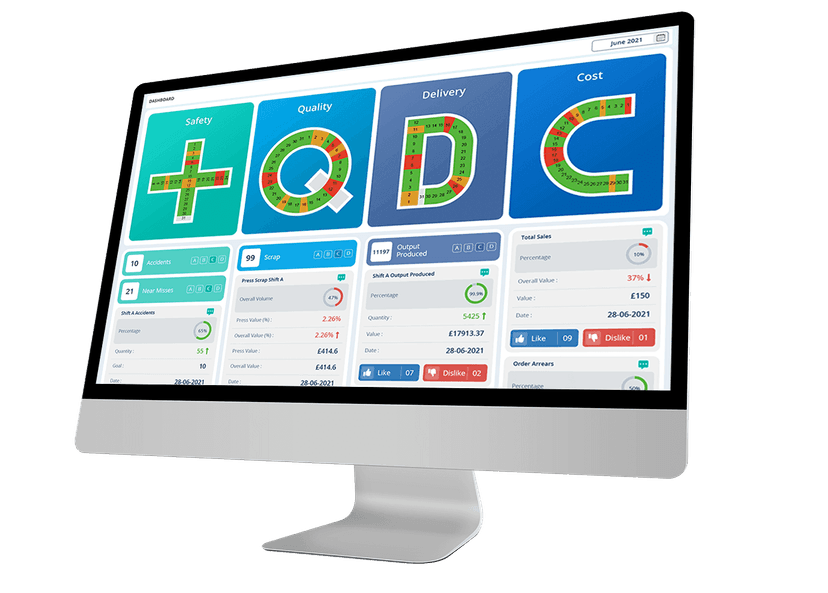
An example of SQDIP board
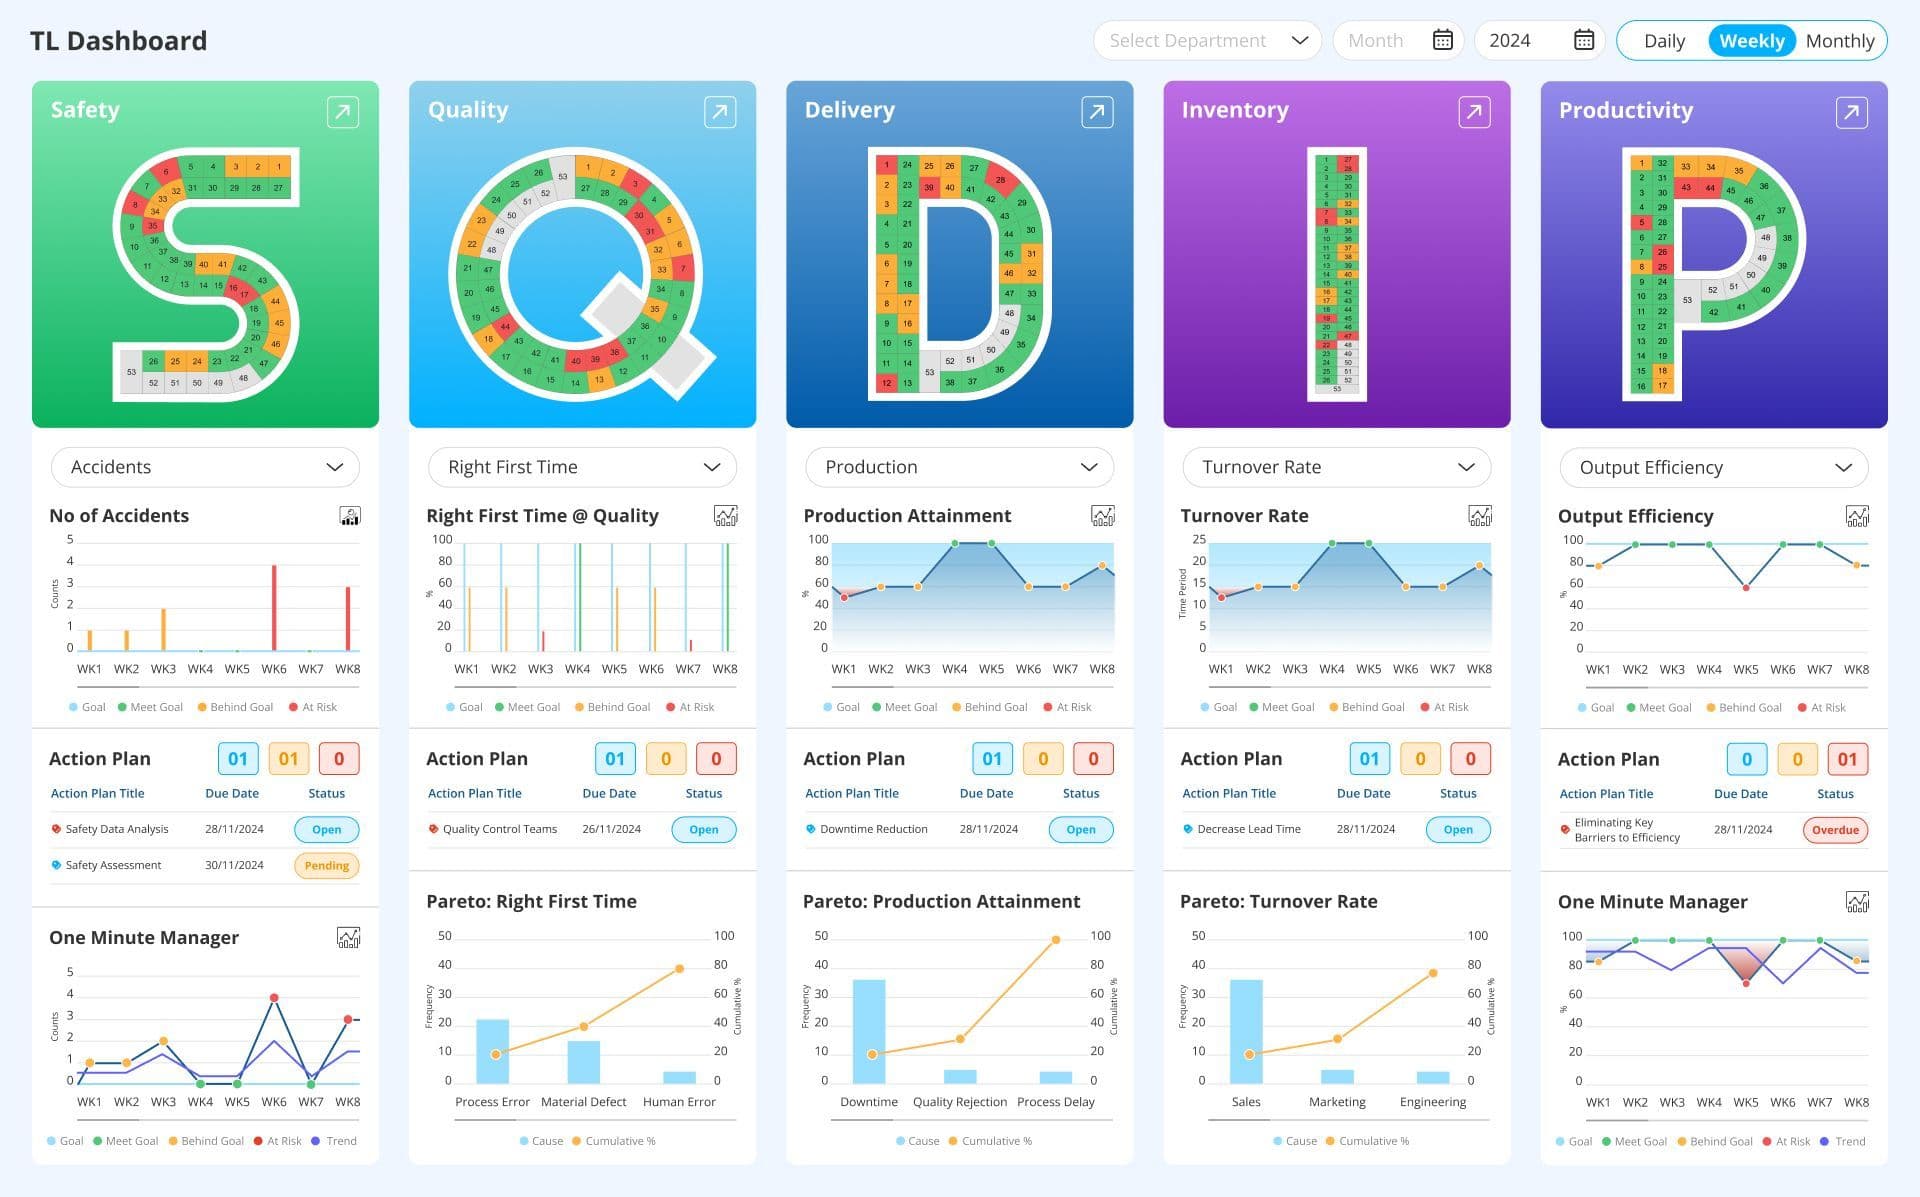
An overview of SQDIP
SQDIP is a data-driven methodology that helps businesses track real-time performance metrics across five pillars. It originated in Lean manufacturing and Six Sigma practices as an evolution of earlier models like SQDC (Safety, Quality, Delivery, Cost). Over time, industries replaced “Cost” with “Inventory” and “Productivity” to address modern supply chain complexities and workforce efficiency demands.
SQDIP is designed for all organisational levels: shop floor employees gain daily operational visibility, middle managers use it to track trends and coordinate teams, and leadership relies on it for strategic decision-making and cross-department alignment.
Track Safety, Quality, Delivery, Inventory, and Productivity metrics all in one dashboard.
Quick guide: SQDIP vs. SQDCP
As you may notice, SQDIP is derived from SQDCP; it may be useful to compare SQDIP with SQDCP help yourself if you are familiar with SQDCP.
What are the SQDIP shop floor metrics and its examples?
The common metrics, that is some key performance indicators (KPIs) monitored in each SQDPI pillar are given below. Here are the top 10 examples of each metric in the SQDIP framework.
SQDIP KPIs examples for Manufacturing sector
Safety
- Incident rates
- Audit scores
- Near misses
- Injury rates
- Safety violations
- Lost time injury frequency rate (LTIFR)
- PPE compliance rate
- Manual handling injuries
- Emergency drill completion rate
- Total Recordable Incident Rate (TRIR)
Quality
- Customer complaints
- Cost of quality
- Defect rates
- Rework percentages
- Scrap rate
- First Pass Yield (FPY)
- Patient satisfaction score
- Customer returns/rejections
- Audit compliance score
- Medication error rate
Delivery
- On-time delivery percentage
- Number of deliveries
- Cycle time variance
- Lead time
- Planned product volume and actual volume
- Order accuracy
- Stockout rate
- Order backlog
- Last-Mile delivery performance
- Schedule adherence rate
Inventory
- Inventory turnover ratio
- Raw material availability
- Stock accuracy rate
- Work-in-progress (WIP) inventory
- Obsolete inventory percentage
- Material shortage incidents
- Equipment utilisation rate
- Waste reduction rate
- Inventory Carrying Cost.
- Average Inventory
- Internal Warehouse Management System (WMS) Efficiency
Productivity
- Overall Equipment Effectiveness (OEE)
- Labour productivity (Units per hour/worker)
- Downtime percentage
- Changeover time (SMED)
- Energy consumption per unit
- Average Call Handling Time (AHT)
- First Contact Resolution (FCR)
- Agent occupancy rate
- Task Completion Rate
- Operating rates
Companies using Digital SQDIP See 30% less downtime
Challenges in traditional paper based SQDIP metrics tracking
Manual data entries with paper-based methods or spreadsheets increase the risk of inaccurate data. Despite the proven benefits of SQDIP, traditional tracking methods often create operational bottlenecks. Let’s explore these challenges:
- Manual data entries using paper-based boards: Teams often rely on whiteboards, printed charts, or handwritten logs placed in meeting or board rooms. This approach is highly prone to human error, outdated information, and poor visibility.
- Time-consuming updates: Updating the board takes valuable time away from actual problem-solving. When done manually, data collection, validation, and reporting become separate tasks, that slows down the feedback loop.
- Inconsistent reporting across departments: Different teams may track metrics differently or miss updates altogether.
- Lack of real-time visibility: Traditional boards do not provide instant updates. Problems can go unnoticed until the next scheduled review, delaying root cause analysis and actions.
- Limited historical data for trend analysis: There’s no reliable way to track performance trends over time.
Limitations in analysing SQDIP with excel
While Excel is a widely used tool in many organisations, it poses significant limitations for effective SQDIP analysis, especially in complex or fast-paced environments like manufacturing.
- Manual data entry increases workload and error risk: Process of collecting and entering data introduces errors, wastes time, and creates data silos across departments.
- Scattered files and version control issues: Excel files are often shared through email or stored on local drives. Without real-time synchronisation, teams can end up using outdated versions, leading to inconsistent reporting and poor communication.
- Limited visual management capabilities: While Excel can create charts, it doesn’t support real-time visual indicators like colour-coded status lights and issue flags.
- Poor usability on the shop floor: Opening and navigating spreadsheets on shared devices or tablets isn’t practical in fast-moving production environments. It is not a good option for team huddles.
- Lack of automation for KPI tracking: Excel lacks built-in tools to automatically capture data from machines, ERP systems, or IoT devices.
- Time-consuming reporting: Creating daily, weekly, and monthly reports from Excel sheets often requires manual data consolidation and formatting.
- Ineffective for cross-departmental collaboration: Excel doesn’t support simultaneous multi-user collaboration well, especially in environments where different departments need to review or act on SQDIP data simultaneously.
Eliminate manual tracking of SQDIP metrics, Integrate data from ERP, MES, and IoT systems
What is SQDIP board?
An SQDIP board is a daily management tool or visual management board that tracks and measure SQDIP metrics. It can be either physical boards placed in any place of the shop floor or digital boards that can be accessible from anywhere.
What is digital SQDIP or SQDPI board?
The digital solution displays real-time performance metrics for Safety, Quality, Delivery, Inventory, and Productivity. It serves as a central hub by consolidating significant data related to KPIs, identifying issues and tracking progress.
Benefits of digital SQDIP boards
- Real-time visibility into Safety, Quality, Delivery, Inventory, and Productivity metrics.
- Faster decision-making with automated alerts and colour-coded indicators.
- Reduced manual effort by integrating data from ERP, MES, and IoT systems.
- Enhanced accountability through role-based access and trackable action items.
- Improved collaboration across teams and departments with centralised dashboards.
- Data-driven continuous improvement via trend analysis, historical reports, and root-cause insights.
- Customisable views to suit shop floor operators, supervisors, and leadership.
See performance in real-time with Data Point SQDIP software
Which are the industries where we can use SQDIP KPI dashboard software?
SQDIP software can be applied across multiple industries where performance tracking, process optimisation, and continuous improvement are critical.
Here are the key industries that can benefit from it:
Manufacturing & Industrial production
- Automotive – Monitoring assembly line efficiency, defect rates, safety incidents
- Aerospace & Defence – Ensuring compliance with quality and safety standards
- Electronics – Tracking production cycle times and defect rates
- Textile & Apparel – Measuring delivery performance, production output
Supply chain & logistics
- Warehousing & Distribution – Managing inventory levels, order accuracy, on-time shipments.
- Retail supply chains – Optimising stock levels, minimising delays
- E-commerce fulfilments – Tracking order processing speed, delivery accuracy
Healthcare & Pharmaceuticals
- Hospitals & Clinics – Monitoring patient safety, treatment quality, staff efficiency
- Medical Device Manufacturing – Ensuring product quality, regulatory compliance
- Pharmaceuticals – Managing production, inventory, and delivery of medicines
Food & Beverage industry
- Food Processing – Maintaining quality standards, hygiene, production efficiency
- Beverage Manufacturing – Tracking raw material usage, reducing waste
Energy & Utilities
- Oil & Gas – Ensuring process safety, equipment reliability
- Renewable energy – Monitoring efficiency of solar/wind power generation
- Power plants – Tracking equipment uptime, energy output, and maintenance schedules
Construction & infrastructure
- Civil engineering – Measuring project safety, material availability, work productivity
- Building construction – Tracking site safety incidents, material delays, quality metrics
Why is SQDIP a powerful visual management tool in manufacturing?
Manufacturing floors are fast-paced, high-pressure environments where small inefficiencies can snowball into major production delays, quality issues, or even safety hazards. Without a structured way to monitor key performance areas, teams often react to problems after they’ve already disrupted operations. This is where SQDIP it becomes an essential Lean daily management system in every shopfloor. This metrics tracking system brings order to complexity and helps the teams to take control of their processes.
Manufacturing operations are constantly battling challenges like:
- Safety incidents that disrupt workflows and put employees at risk.
- Quality defects that increase waste and damage customer trust.
- Missed delivery deadlines due to inefficiencies and bottlenecks.
- Inventory imbalances—either too much stock tying up cash or shortages halting production.
- Productivity issues where teams struggle with unclear goals, inefficient processes, or untracked downtime.
When these problems go unnoticed or unaddressed, they lead to costly delays, customer dissatisfaction, and lost revenue. A lack of real-time visibility into these issues forces teams into a reactive mode, constantly firefighting instead of preventing problems in the first place.
How SQDIP visual management boards solve manufacturing or other industry challenges?
SQDIP provide a consolidated view of significant data and present them visually for better understanding of every team member. By making key manufacturing or other metrics visual, accessible, and actionable, SQDIP transforms the way teams work. It shifts the focus from firefighting problems to preventing them, creating a culture where continuous improvement becomes second nature.
What are the key features of a best digital SQDIP solution?
- Real-Time Data Display for immediate availability of real-time and timely-updated safety, quality, delivery and inventory and productivity metrics with instant integration from MES and or ERP systems.
- Interactive daily huddle boards for better strategy execution and quick decision making.
- KPI visual management with Colour-coded tracking for instant metric status visibility.
- Customisable dashboard layouts and KPIs to suit team requirements.
- Graphical data representation with charts and trend analysis.
- Drill-down capability for in-depth metric analysis.
- Intuitive navigation for seamless user experience.
- Role-based access control for personalised data views.
- Integration with MES, ERP, and IoT for streamlined operations.
- Mobile and remote accessibility for real-time monitoring anywhere.
- Historical data and trends that contain information on past performance for better planning process.
- Automated alerts to identify deviations from metrics to address the issues immediately.
Customise your shop floor view with dashboards for operators, team leads, and executives
Digital SQDIP board for continuous improvement
Digital SQDIP boards drive continuous improvement by providing real-time insights that ensure ongoing effort to enhance processes, reduce waste, and boost efficiency. SQDIP as a continuous improvement tool helps to adapt, prevent recurring problems, and consistently achieve higher performance.
How does SQDPI software help in improving safety, quality, delivery, inventory and productivity?
With real time data dashboards and Indepth analysis SQDIP software enhance transparency, drives quick identification of issues and bring solutions by proactive problem solving.
➜ SQDIP software for safety monitoring
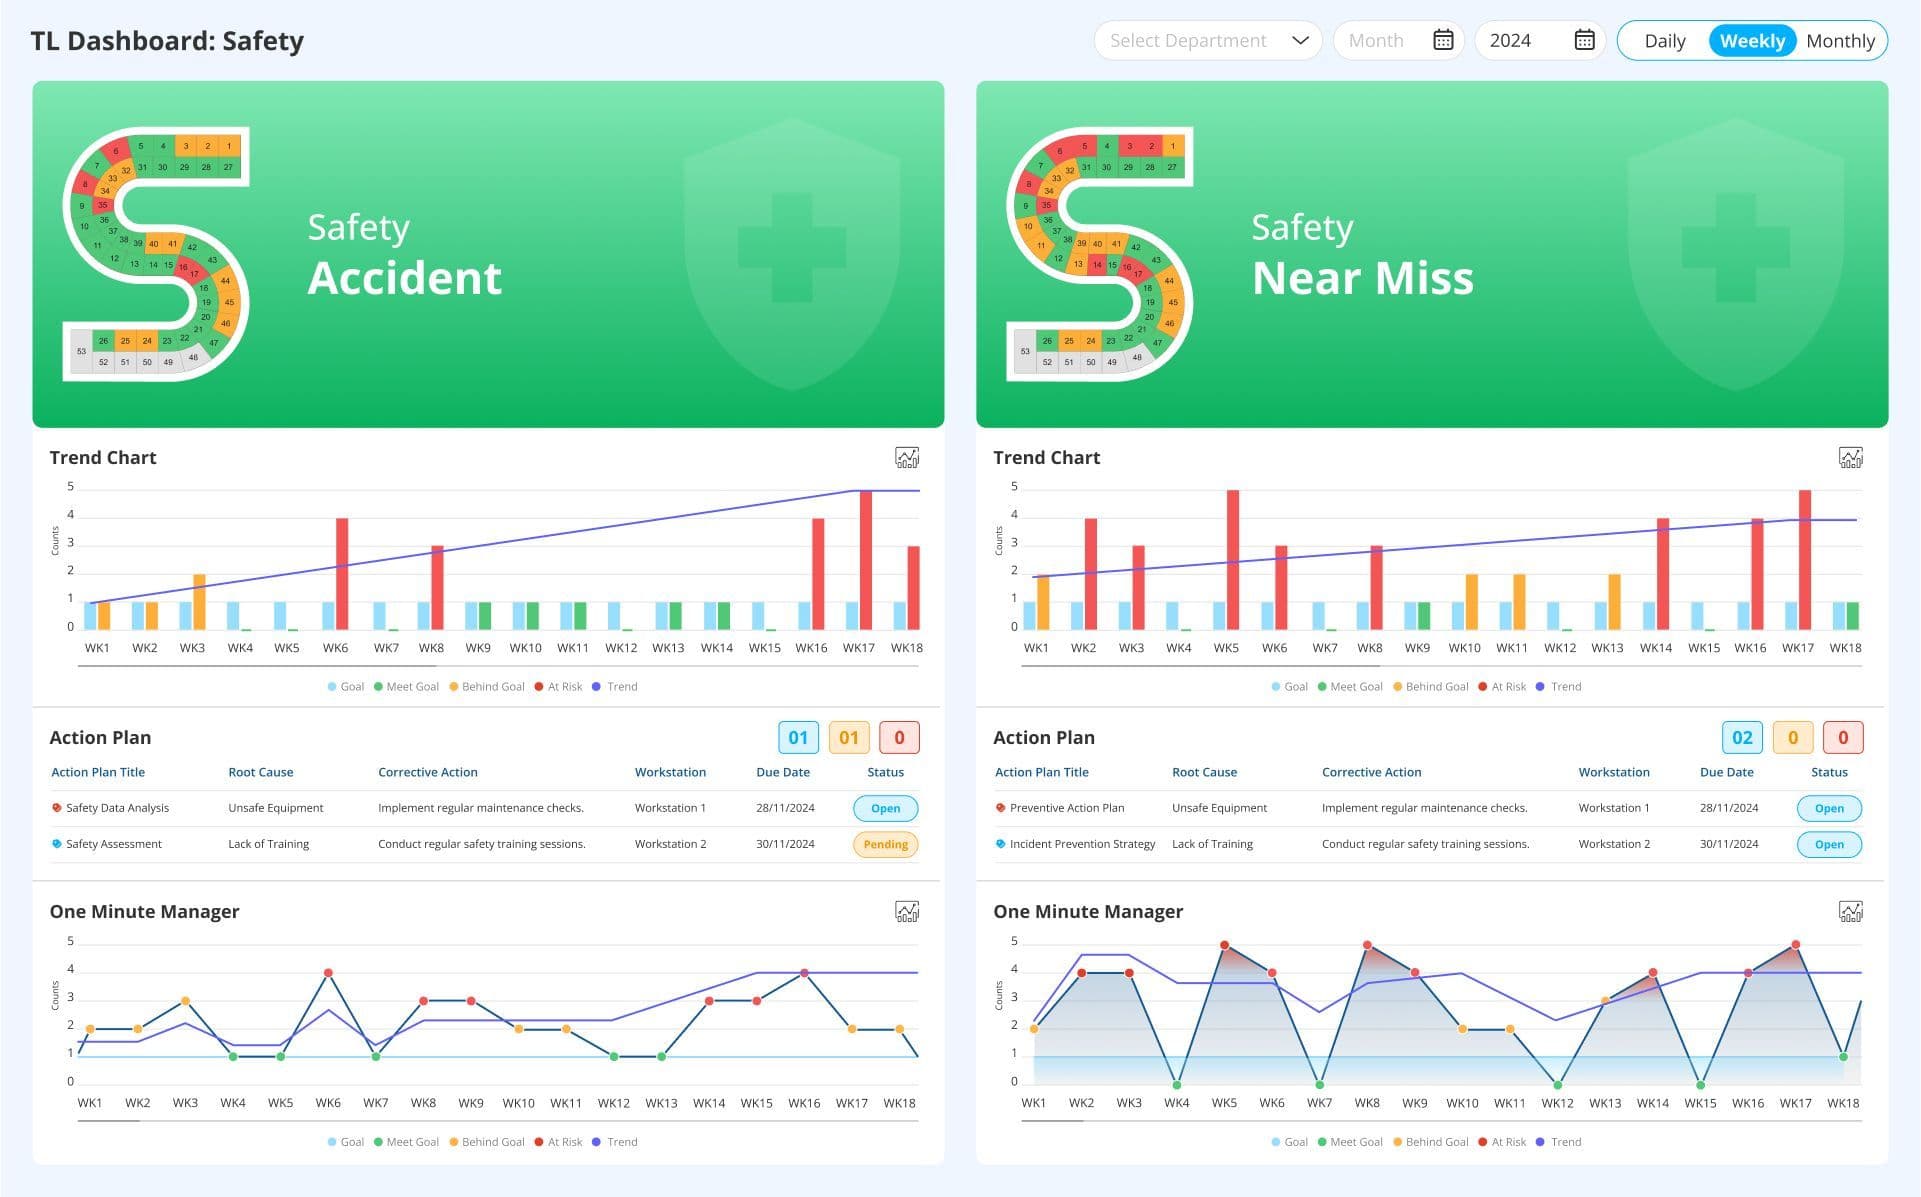
Tracks incidents in real-time, automates compliance alerts, and predicts risks with advanced features.
➜ SQDIP system for quality enhancement

Monitors defects via automated data collection, triggers root cause analysis, and standardises workflows. Live Pareto charts pinpoint recurring quality issues and helps to take necessary actions.
➜ SQDIP solution for delivery performance improvement
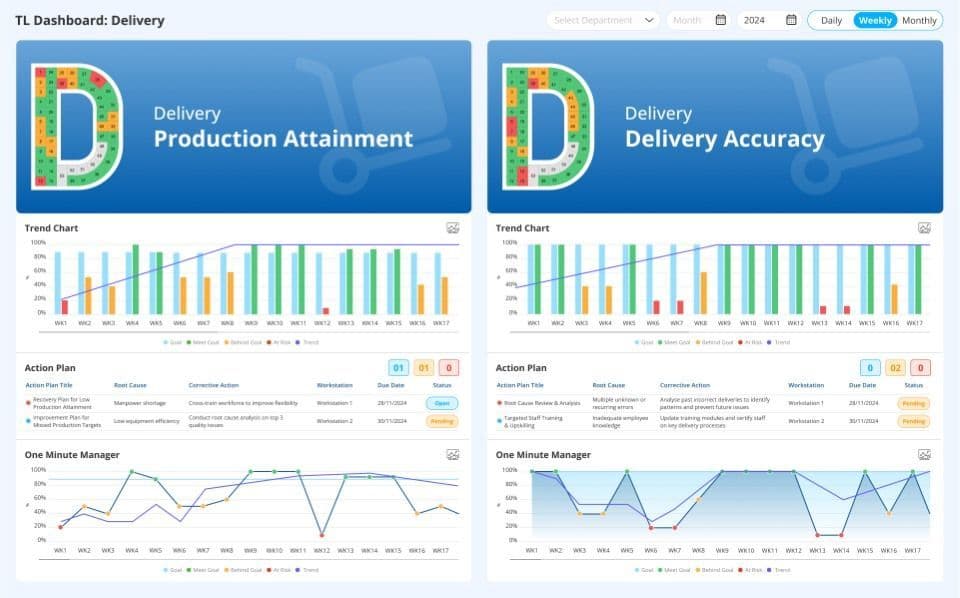
Visualises on-time performance with On-Time Delivery (OTD) Tracking, identifies supply chain bottlenecks, and optimizes scheduling.
How to optimise inventory management with SQDIP tool?

Managing inventory metrics has traditionally been difficult because it is a complex process, and small errors make impact in big mistakes. Unexpected shortages disrupt production, stock discrepancies and slow-moving materials are some among those challenges that affect inventory management. Also Keeping inventory under control isn’t just about tracking stock levels—it’s about understanding trends, identifying risks, and making informed decisions.
The need for visual management tool for monitoring and manging inventory performance is demanding because it give data driven insights about material availability, turnover rates and stock levels by automates stock-level tracking, forecasts demand, and flags excess/understock with JIT alerts. Accurate report making and in-depth analysis from the part of a SQDIP software solution helps the team and managers to take proactive actions before the challenges impact production by tracking the Lean management KPIs. With an efficient SQDIP board a business can easily prevent shortages, reduce excess stock, optimise material flow and ensure continuous improvement.
How to enhance productivity with a SQDIP board?

Every shop-floor operation’s productivity is often held back by challenges such as unplanned downtime, process bottlenecks, and lack of accountability. To overcome these, operations need a real-time, transparent view of production KPIs. That’s where a digital SQDIP or visual KPI dashboard becomes indispensable.
With a digital board you can:
- Eliminate waste and inefficiencies by tracking Overall Equipment Effectiveness (OEE), availability, performance, and quality metrics in real time.
- Spot trends and root causes in metrics like cycle time variation, changeover time (SMED), idle machine time, and throughput—so you can act before issues escalate.
- Optimise workforce productivity and labour utilization through data-driven insights into operator efficiency, labour hours, and operator utilisation rates.
- Reduce rework, defects, and scrap percentages by monitoring quality yield (such as First Pass Yield ‒ FPY) and quality rate metrics.
- Drive faster decision-making with automated alerts, threshold-based notifications, and colour-coded visuals that flag performance gaps immediately.
- Support continuous improvement and lean process optimization by enabling leaders to review daily, weekly, and monthly productivity reports, make adjustments via Gemba walks, and empower teams to own their metrics.
SQDIP management- Implementation and uses of SQDIP boards
Implementing a digital SQDIP system, consistently tracking metrics, and customising a digital SQDIP dashboard are essential steps for all teams—shop floor operators, supervisors, and leaders—to drive continuous improvement, ensure accountability, and achieve sustainable operational excellence. Look at how SQDIP boards streamline production.
How to implement SQDIP effectively?
Every organisation must prioritise use of SQDPI board in their daily process for gaining desired results from it.
- Link SQDIP to business goals: A standalone SQDIP board cannot enhance your operational excellence if it is not integrated with business goals. Leaders must align it with organisational objectives to ensure meaningful improvements in safety, quality, delivery, inventory, and productivity.
- Reduce employee’s resistance to change: A digital transformation aiming better goal achievement may face resistance from the part of the employees, because the system is unfamiliar and new to them. So, communicating with your team about the benefits such as faster problem solving and fewer manual reports of digital SQDPI board is the initial step toward gaining acceptance and ensuring a smooth transition.
- Strong leadership commitment: Effective SQDIP management starts with leaders. Compare the management process before and after the use of SQDIP boards and present it to your teams. Active usage of SQDIP board, encouraging discussions around it and making data-driven decisions based on its insights make others enlightened.
- Provide Training: Equip teams with the knowledge to update, interpret, and act on SQDIP data. Regular training ensures the board is used effectively rather than becoming a passive tool.
- Take SQDIP to your Gemba walk: SDDIP board, the data its presents or the report it generated is a robust companion of your Gemba walk. A quick look on this board gives leaders essential insights about their overall process and helps to ask data driven questions. (Example: Why did Safety turn red yesterday? What is the reason for it, why the action taken is missing in this board)
- Set up regular reviews: Conduct daily, weekly, and monthly SQDIP meetings to analyse trends, track progress, and take corrective action.
∘ Daily: Focus on urgent issues (e.g., safety incidents, delivery delays) during 5-minute huddles at the SQDIP board.
∘ Weekly: Analyse trends (e.g., rising defect rates) and assign corrective actions.
∘ Monthly: Review progress toward strategic goals (e.g., inventory turnover) with leadership; adjust targets if needed.
- Encourage team ownership: Assign specific SQDIP elements to team members, ensuring active participation and accountability in maintaining and improving metrics.
How to track SQDIP metrics with digital system?
1. Automate data capture
- Connect your digital SQDIP system with ERP, MES, or IoT devices to automatically pull real-time data for Safety, Quality, Delivery, Inventory, and Productivity.
- Reduce manual data entry errors by integrating directly with production machines, quality systems, and attendance logs.
2. Centralise and visualise data
- Consolidate data from multiple departments into a single source of truth.
- Use colour-coded indicators (green/yellow/red) for instant status updates and prioritisation of issues.
3. Set performance thresholds and alerts
- Define targets and tolerances for each SQDIP pillar (e.g., safety incidents = zero, OEE > 85%).
- Configure real-time alerts so that when metrics fall below target, teams are notified immediately via email, SMS, or push notifications.
4. Drill down for root cause analysis
- Use the digital board’s drill-down capability to investigate the exact shift, process, or workstation where the deviation occurred.
- Document issues directly in the system and link them to corrective actions for visibility.
5. Create and assign action plans
- Convert deviations into trackable action items directly from the board.
- Assign responsibility, set deadlines, and monitor progress in the same platform to ensure accountability.
6. Share insights across teams
- Enable role-based access so each tier (operators, supervisors, leadership) sees the right level of detail.
- Export reports and share them during shift handovers, cross-department meetings, and management reviews to keep everyone aligned.
7. Close the loop
- Once corrective actions are completed, verify results by checking if the metric improved.
- Document lessons learned to build a knowledge base and prevent similar issues in the future.
How to customise a digital SQDIP dashboard for Lean daily management?
The requirements and targets of organisations vary from one to other and custom solutions only can change complex data into actionable visuals. Have a look on the procedures of customising your SQDIP board.
- Define your business goals and align the dashboards metrics with top priorities
- Choose your metrics and layout by prioritising important KPIs and easily understandable layout.
- Use drag and drop features and resize panels for high priority metrics.
- Set role-based views choosing the boards for managers, floor staffs etc.
- Make best visual practices by applying colour codes for gaining quick insights, line graphs for trend analysis and bar charts for defect comparisons.
- Integrate real time data by connecting with ERP or IoT sensors. Use Excel/Google sheets for manual updates.
- Bring changes according to the feedback and remove rarely used metrics or add new ones.
Real-Time KPI Visibility Increases Decision Accuracy by 40%
What is SQDIP meeting and how can you use as huddle boards?
Daily management, an essential function of the SQDIP board, can be implemented by conducting meetings, reviewing the board, and using it as a huddle board.
A properly executed SQDIP system creates ongoing accountability to drive performance-based actions. During morning meetings, teams gather around the board to discuss performance, flag issues, and assign corrective actions. Everyone from shop floor workers to supervisors and plant managers is engaged in the process, ensuring that problems are tackled before they escalate.
While in the 5–10-minute huddles, members can use it for discussing root cause analysis, assign immediate actions, and track progress on the board. Thus, it can be said that SQDIP board can be used as your short interval management board (SIMB).
SQDIP for different work tiers: Tailored use across roles and responsibilities
SQDIP is not a one-size-fits-all tool. It adapts across different levels of the organisation, helping teams at every tier contribute to operational excellence. From the shop floor to the boardroom, each group interacts with SQDIP differently, focusing on metrics that reflect their specific roles and responsibilities.
Tier 1: Frontline employees & Operators
Who they are:
- Machine operators
- Assembly line workers
- Quality inspectors
- Maintenance staff
How they use SQDIP:
- Daily visual management of key performance indicators
- Real-time feedback on safety, quality, delivery, inventory, and productivity metrics
- Quickly identifying abnormal conditions or disruptions in the workflow
- Participating in daily huddles to update the board and raise concerns
- Using colour-coded indicators to flag issues and suggest corrective actions
Key benefits of using SQDIP board for employees and operators:
- Promotes ownership of performance
- Supports a culture of safety and quality awareness
- Encourages active problem identification and communication
Tier 2: Team Leaders, line supervisors, middle managers
Who they are:
- Shift leaders
- Production supervisors
- Department heads
- Continuous improvement coordinators
How they use SQDIP:
- Reviewing trends across daily, weekly, and monthly metrics
- Leading team huddles and discussions based on SQDIP insights
- Aligning team goals with broader departmental targets
- Facilitating root cause analysis when performance dips
- Using the board as a coaching and employee engagement tool
Key benefits of using SQDIP board for leaders and managers:
- Drives data-informed decision-making at the team level
- Supports accountability and structured follow-up on actions
- Improves communication between tiers of the organisation
Tier 3: Senior leadership & Strategic decision-makers
Who they are:
- Plant managers
- Operations directors
- Lean practitioners
- Executive leadership
- Strategic planners
How they use SQDIP:
- Monitoring high-level KPIs across departments or sites
- Evaluating performance trends to inform strategic planning and resource allocation
- Ensuring that SQDIP metrics are aligned with business goals and targets
- Driving digital transformation and promoting standardised reporting across the organisation
- Integrating SQDIP insights into executive dashboards and performance reviews
Key benefits of using SQDIP board for strategic decision-makers:
- Enhances visibility across operations for quicker decision-making
- Supports strategy deployment and performance alignment
- Facilitates cross-functional collaboration using a shared visual language
Why tier-based use of SQDIP matters?
When every tier engages with the SQDIP board according to their role, the tool becomes far more than just a tracking board; it evolves into a dynamic communication system, fostering alignment, transparency, and accountability throughout the organisation.
Leverage best-in-class Lean manufacturing tools and a proven framework to track SQDIP
Elevate your performance with LTS DataPoint’s best digital SQDIP Boards
In today’s fast-paced manufacturing and operations landscape, real-time visibility of SQDIP metrics isn’t a luxury—it’s a driver of excellence. LTS DataPoint digital SQDIP dashboards as a visual KPI platforms transform raw data into actionable insights, delivered with precision, clarity, and speed.
Why choose LTS DataPoint to track your SQDIP metrics?
- Live data integration: Pulls data automatically from your MES, ERP, IoT sensors, and other core systems so your dashboard is always up to date. No more manual entry delays or version mismatch.
- Fully customisable dashboards: Tailor your SQDIP board to your organisation’s priorities: choose which KPIs matter most for Safety, Quality, Delivery, Inventory, and Productivity; arrange layouts; set colour codes; and design role-specific views (shop floor, supervisor, executive) so every person sees what they need.
- Visual excellence: With intuitive visual tools like heat maps, trend lines, status indicators, Pareto charts, and alerts, you can spot anomalies at a glance and act before small issues escalate.
- Real-time alerts and notifications: Be notified instantly when thresholds are breached—whether a safety incident, a quality defect spike, delayed delivery or low inventory. Trigger corrective action faster.
- Multi-device and remote access: Whether you’re on the shop floor, in a meeting room, or offsite, you’ll have secure access to the dashboard via tablets, desktops, or mobile devices.
- Drill-down and historical trend tracking: Go from high-level overviews to detailed investigations. Analyse what caused a drop in productivity, why inventory turnover slipped, or where delivery delays stemmed. Historical data helps with continuous improvement.
- Role-based access and ownership: Assign access levels and dashboards views so operators, team leads, quality leaders, and executives each see relevant metrics. Encourage accountability and ownership.
- Scalable and industry-versatile: LTS DataPoint digital SQDIP system is used in manufacturing, automotive, supply chain & logistics, pharmaceuticals, food & beverage, aerospace, and more. As your operations grow, your solution scales with them.
Tailored solutions for SQDIP management
LTS DataPoint understands that every operation has unique challenges. Whether you need:
- A lightweight starter board to kick off daily management in a specific plant or line
- A full enterprise-wide SQDIP solution connecting multiple sites and data sources
- Custom visuals or KPI sets for highly regulated environments (e.g. pharma, medical devices)
- Integration with predictive analytics or advanced reporting modules
Case study: How SQDIP drives real results in different sectors
Look at real-life examples of organisations using Data Point SQDIP boards to transform their operations
Automotive components – Cutting downtime and boosting efficiency
A mid-sized automotive supplier implemented a Data Point digital SQDIP board to track Safety, Quality, Delivery, Inventory, and Productivity across assembly lines. By visualising real-time metrics and conducting daily huddles, supervisors quickly identified bottlenecks and acted immediately. Within three months, the plant reduced unplanned downtime by 18%, improved on-time delivery by 12%, and increased overall equipment effectiveness (OEE)—showing how Data Point boards convert data into actionable insights.
Pharmaceutical production – Optimising inventory and safety
A mid-sized pharmaceutical plant adopted Data Point SQDIP boards to track inventory levels, expiry dates, and safety incidents in real time. Operators and managers could anticipate shortages, prevent overstocking, and enforce safety protocols using the dashboard. Within six months, the plant reduced inventory carrying costs by 15% and maintained 100% compliance with safety audits, highlighting the board’s role in risk mitigation and efficiency enhancement.
LTS Data Point digital SQDPI solution configure a solution that aligns with your business goals and operational priorities. Ready to unlock operational excellence? See LTS Data Point digital SQDIP board in action. Request a free demo now and find out how your safety, quality, delivery, inventory, and productivity metrics can move from reactive tracking to proactive leadership.

Abel Jiménez, Lean Consultant
Abel is a Lean Consultant with over 30 years of expertise in operational analysis, process improvement, and organisational change across Mexican industries. Currently serving as Director of Insurance Promotions at CESCEMEX, he helps organisations leverage technology and lean practices to improve efficiency and manage change with continuity.