Optimise your factory operations with Manufacturing Balanced Scorecard
Use comprehensive Manufacturing Digital Balanced Scorecard software with best Manufacturing KPI Dashboards to improve operational efficiency, track KPIs, and enhance production management for sustainable growth.
Choice of industry leaders and Fortune 500 companies


















Transforming manufacturing challenges to opportunities: Why Data Point is your smartest solution?
Data Point Balanced Scorecard enables manufacturing companies to easily track and analyse manufacturing key performance indicators like OEE (Overall Equipment Effectiveness), ensuring alignment with strategic goals and operational efficiency.
- Automate data collection and visualisation for manufacturing KPIs.
- Monitor performance trends and benchmark against industry standards.
- Data consolidation from multiple manufacturing units into a single, unified system.


Align your operational goals with the strategic vision and break them into actionable objectives, while ensuring everyone is moving towards the same organisational goals.
- Align departmental KPIs with overarching business goals
- Prioritise initiatives that deliver the most strategic value.
- Tracks strategic alignment metrics, identifying discrepancies and adjusting strategies in real time.
Align teams and goals with strategic KPIs that deliver results.
Optimise manufacturing processes by integrating the Lean manufacturing KPIs to reduce waste and downtime, driving significant improvements in productivity and operational performance.
- Identify and eliminate process inefficiencies hindering productivity.
- Monitor machine uptime, and cycle times to achieve operational excellence.
- Enable predictive maintenance with real-time KPI tracking.


Enhance product quality and customer satisfaction through targeted KPIs, improving overall competitiveness in the market.
- KPIs tracking quality control metrics, examples such as defect density and first-pass yield.
- Enhance on-time delivery and supply chain performance by optimising production schedules.
- Use customer satisfaction scores and feedback metrics to refine manufacturing processes.
Driving Efficiency and Performance Gains with Data Point
0%
reduction in breakdown time
0%
annual cost savings
0%
OEE improvement
How do manufacturing companies use balanced scorecards?

Achieve strategic planning
Data Point enhances organisational performance by aligning KPIs with strategic objectives across various levels, fostering a high-performance culture

Execute strategies effectively
Implement and assess your initiatives using the Digital Balanced Scorecard to ensure alignment with strategic goals.

Transform data into insights
Analyse departmental data effortlessly to gain valuable insights with automated reports, ensuring you stay on top of your KPIs.

Optimise production and sales
Continuously monitor KPIs or metrics to enhance production planning and sales, enabling organisations to anticipate demand and fulfill it promptly.

Enhance customer satisfaction
Visualise strategy maps and analyse KPIs to align processes with strategic goals, focusing on metrics like on-time delivery and quality that matter most to customers.

Customisable digital reports
Access a variety of digital reports tailored to monitor overall performance, generating insights from real-time data.
Build a performance-driven culture by aligning KPIs with your strategic goals
Manufacturing Balanced Scorecard Software – The Complete Guide to Strategic Factory Performance
Learn how a Manufacturing Balanced Scorecard tracks OEE, quality, delivery, and strategic KPIs to improve factory performance and decision-making.
How does tracking OEE specifically as a strategic KPI change how manufacturing leadership assesses equipment performance?
Overall Equipment Effectiveness is often treated as a shopfloor metric, monitored by maintenance or production teams but rarely elevated into the strategic conversation leadership has about the business. That separation misses the fact that OEE is one of the clearest indicators of whether the capital investment is being utilised effectively.
Tracking OEE within the same scorecard used for strategic objectives means equipment effectiveness is reviewed alongside financial and customer metrics, not siloed as an operational-only concern. This is what allows leadership to see a direct line between a declining OEE trend and its eventual impact on delivery or cost KPIs, rather than discovering that connection only after the downstream effect has already shown up elsewhere.
How does real-time KPI tracking enable predictive maintenance rather than only reactive or scheduled maintenance?
Reactive maintenance responds after a failure has occurred. Scheduled maintenance intervenes at fixed intervals regardless of actual equipment condition, which means some maintenance happens too early, wasting resource, and some happens too late, missing a developing failure.
Real-time KPI tracking on machine uptime and cycle times gives visibility into how equipment performance is trending before a failure occurs. A gradual decline in cycle time consistency or a rising pattern in minor stoppages can indicate a developing issue well before a scheduled maintenance check would catch it. This is what allows maintenance to be triggered by actual equipment condition rather than a fixed calendar, connecting directly to the same real-time visibility principle behind takt time tracking on the production side.
How does linking customer satisfaction scores directly to internal production metrics change how a quality issue gets prioritised?
A production defect flagged internally is often prioritised based on internal severity criteria: cost of rework, frequency, or ease of fix. That prioritisation can miss whether the specific defect type is affecting customer perception, since internal severity and customer-perceived severity do not always align.
Using customer satisfaction scores and feedback metrics alongside internal quality data means a defect type correlated with declining customer satisfaction can be prioritised above one that is more frequent internally but has little visible customer impact. This is what keeps quality improvement effort aligned with what customers notice, rather than purely with what is easiest or cheapest to fix internally.
How does aligning production schedules with delivery KPIs specifically improve on-time delivery, rather than treating scheduling and delivery as separate concerns?
A production schedule optimised purely for manufacturing efficiency, longest possible run lengths, minimal changeovers, does not automatically produce the sequence that best serves delivery commitments. A batch scheduled for production efficiency might complete after the customer delivery window it was meant to serve has already passed.
Optimising production schedules with delivery KPIs as an explicit input means scheduling decisions account for delivery deadlines directly, not just production throughput. This connects the production planning function directly to delivery performance, rather than treating the two as separate departments optimising for different objectives that occasionally conflict
How does benchmarking manufacturing KPIs against industry standards change what "good performance" means for a specific factory?
A factory hitting its own historical best for a given metric can still be significantly behind what competitors in the same sector are achieving. Without an external reference point, internal improvement can look successful while the organisation is falling further behind industry standards over time.
Benchmarking performance trends against industry standards gives that external context directly within the same dashboard used for internal tracking. This is what prevents a manufacturer from mistaking incremental internal progress for competitive performance, since the two are only the same thing when the benchmark confirms it.
How does tracking defect density alongside First Pass Yield give a more complete quality picture than either metric alone?
First Pass Yield tells you what proportion of units pass inspection without rework. Defect density tells you how many defects are occurring relative to output volume, regardless of whether those defects ultimately get caught and corrected before the unit ships. A high FPY with rising defect density can indicate that inspection is compensating for a quality problem rather than the process improving.
Tracking both together surfaces distinction. A quality team relying on FPY alone might see a stable pass rate and assume quality is under control, while defect density reveals more units are requiring rework to achieve that same pass rate, which is a cost and efficiency problem even when the customer never sees the defect.
How does consolidating data from multiple manufacturing units into a single system change decision-making for multi-plant organisation?
Reviewing performance across several manufacturing units running separate, disconnected systems requires someone to manually compile figures from each before any cross-site comparison is possible. That manual compilation step introduces delay and the risk of inconsistent definitions between sites, where one plant's "downtime" figure might not mean the same thing as another's.
Data consolidation into a single unified system removes that manual step and enforces consistent definitions across all units. A group operations director can compare OEE, quality, or delivery performance across plants directly, using figures that were calculated the same way at each site, rather than reconciling differences in methodology before any comparison can be trusted.
How does post-implementation support and training affect whether a manufacturing scorecard implementation sustains itself past the initial rollout?
A scorecard system that receives significant setup attention during implementation but is then left to run without further support is vulnerable to slow disengagement. Configuration questions go unanswered, new team members are not properly onboarded, and usage gradually reverts toward whatever manual process existed before.
Ongoing training and technical assistance after implementation are what keeps the system embedded in daily practice rather than becoming a tool that was set up once and gradually abandoned. This is particularly relevant for manufacturing organisations with shift-based staffing and regular turnover, where the group trained during initial rollout is not necessarily the same group using the same system a year later.
Hear it from our customers

MARC ROBINSON
Director, Global Operational Excellence


“By providing a central location to input, analyse and share our KPIs, 'Data Point' enables site management to more easily focus on the entire business as a team. Its ability to allow automated data entry and trend analysis gives us more time for improvement rather than just reporting numbers. Combined with a disciplined approach within our SQDC meeting process, I believe 'Data Point' will help us continually focus on key issues and drive business excellence in all areas.”
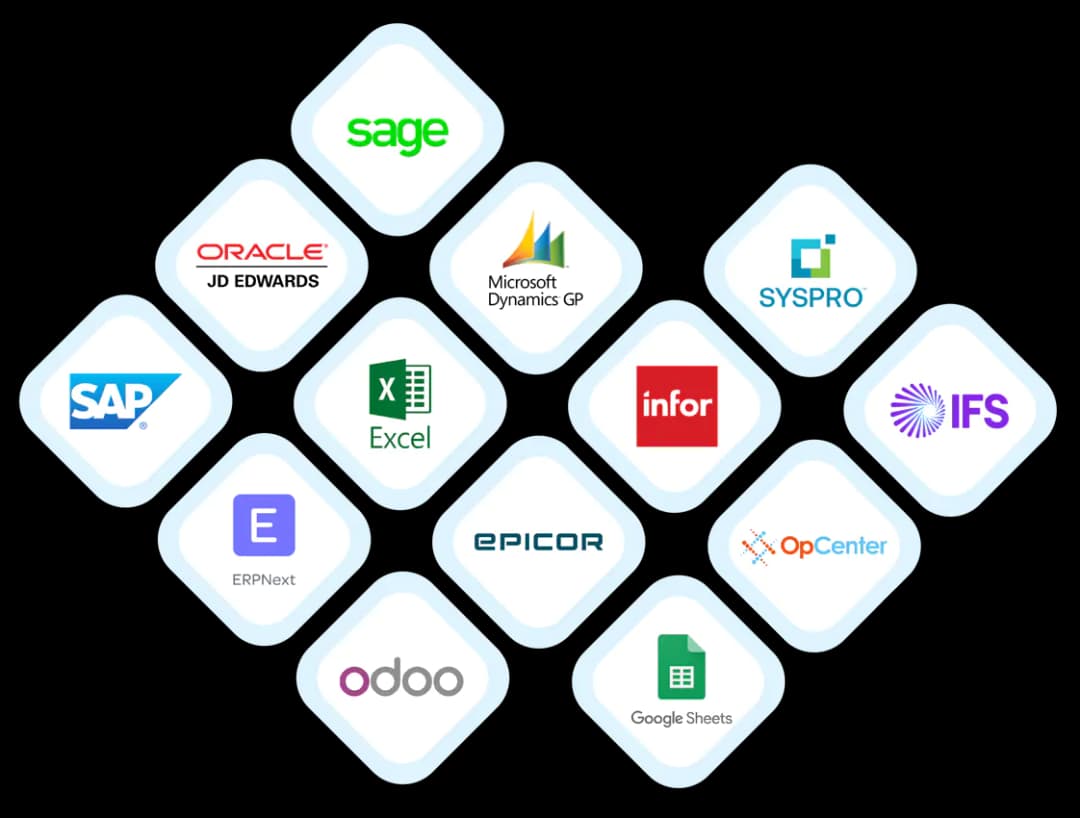
Hassle Free Data Point Integrations
Connect Data Point to essential business tools, integrating ERP systems, project management software, and more to unify performance tracking seamlessly.
Discover MoreLearn More about Manufacturing Balanced Scorecard


Start your journey towards enhanced manufacturing performance !
Plan your Strategic alignment with Digital Balanced Scorecard
