How Did the Global Manufacturer Enhanced
Efficiency with End-to-End Digitalisation
With LTS Data Point Balanced Scorecard, a global manufacturer unified planning, tracking, and KPI management across multiple sites. The digital platform enabled real-time visibility, faster corrective actions, and data-driven performance improvement.
Customer Overview
- Industry: Manufacturing
- Location: Global Operations
- Specialisation: Production of high-precision industrial components with a focus on quality, reliability, and continuous innovation.
A globally recognised manufacturing organisation with a strong multi-plant presence, the company has delivered excellence in production for over two decades. Known for its precision engineering and commitment to operational efficiency, it serves diverse markets across multiple continents. The organisation takes pride in its advanced production facilities, robust process control, and consistent achievement of high customer satisfaction levels.
Background
A global manufacturing organisation relied on Excel-based planning sheets, SAP extracts, and disconnected reporting tools for production planning, performance tracking, and continuous improvement.
While functional, these manual and semi-manual processes caused delays in decision-making, lacked real-time visibility, and made collaboration between operators, supervisors, and management difficult.
Leadership identified the need for a single, integrated platform to centralise data, automate tracking, and enable proactive performance management across all operational tiers.
Challenges Before Digitalisation
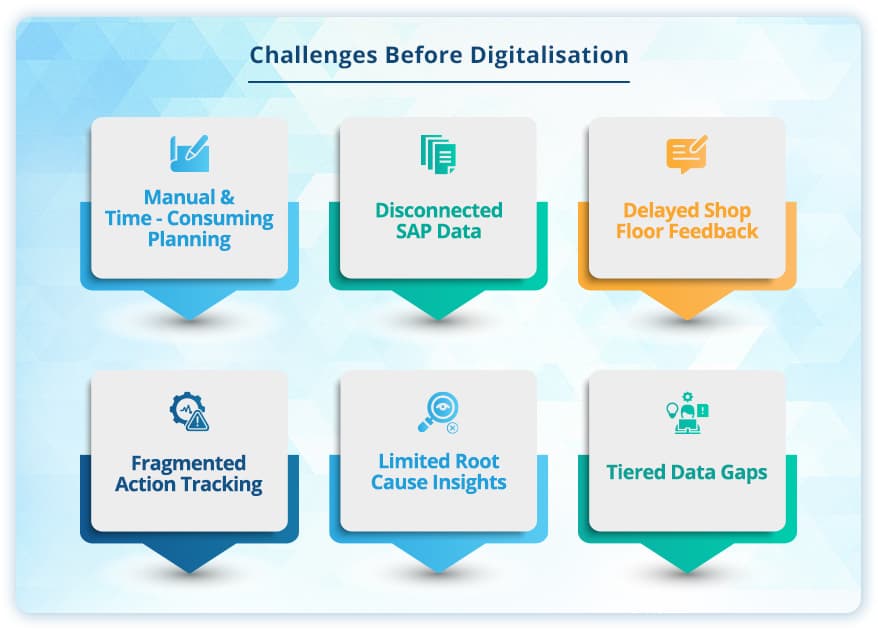
- Manual & Time-Consuming Planning
Production plans maintained in multiple Excel sheets led to version control issues and repeated updates.
- Disconnected SAP Data
Extracts needed to be transformed manually before aligning with planning data.
- Delayed Shop Floor Feedback
Operators tracked actuals on paper, causing reporting delays.
- Fragmented Action Tracking
Corrective actions and improvement initiatives were scattered across emails and documents.
- Limited Root Cause Insights
Failure analysis required manual investigation and data consolidation.
- Tiered Data Gaps
Operators (Tier 0) and Supervisors (Tier 1) could only access basic production data, while management (Tiers 2–3) had visibility over functional KPIs — but without integrated departmental grouping.
The Digital Transformation
The organisation implemented Data Point, a digital balanced scorecard and operational management platform, transforming operations across all tiers.
- Integrated Digital Planning
- Replaced Excel-based planning with a live, centralised Planning Module accessible to all stakeholders.
- Automated scheduling based on operator efficiency, backlog recovery, and demand inputs.
- Direct SAP integration for backlog and daily production data — removing manual data handling.
- Real-Time Shop Floor Tracking
- Digitalised the Shop-floor Interval Control Board (SICB) to capture actual production live.
- Automatic variance (delta) calculations with issue logging linked to problem codes.
- Instant visibility into performance gaps for faster corrective action.
- Unified KPI Monitoring
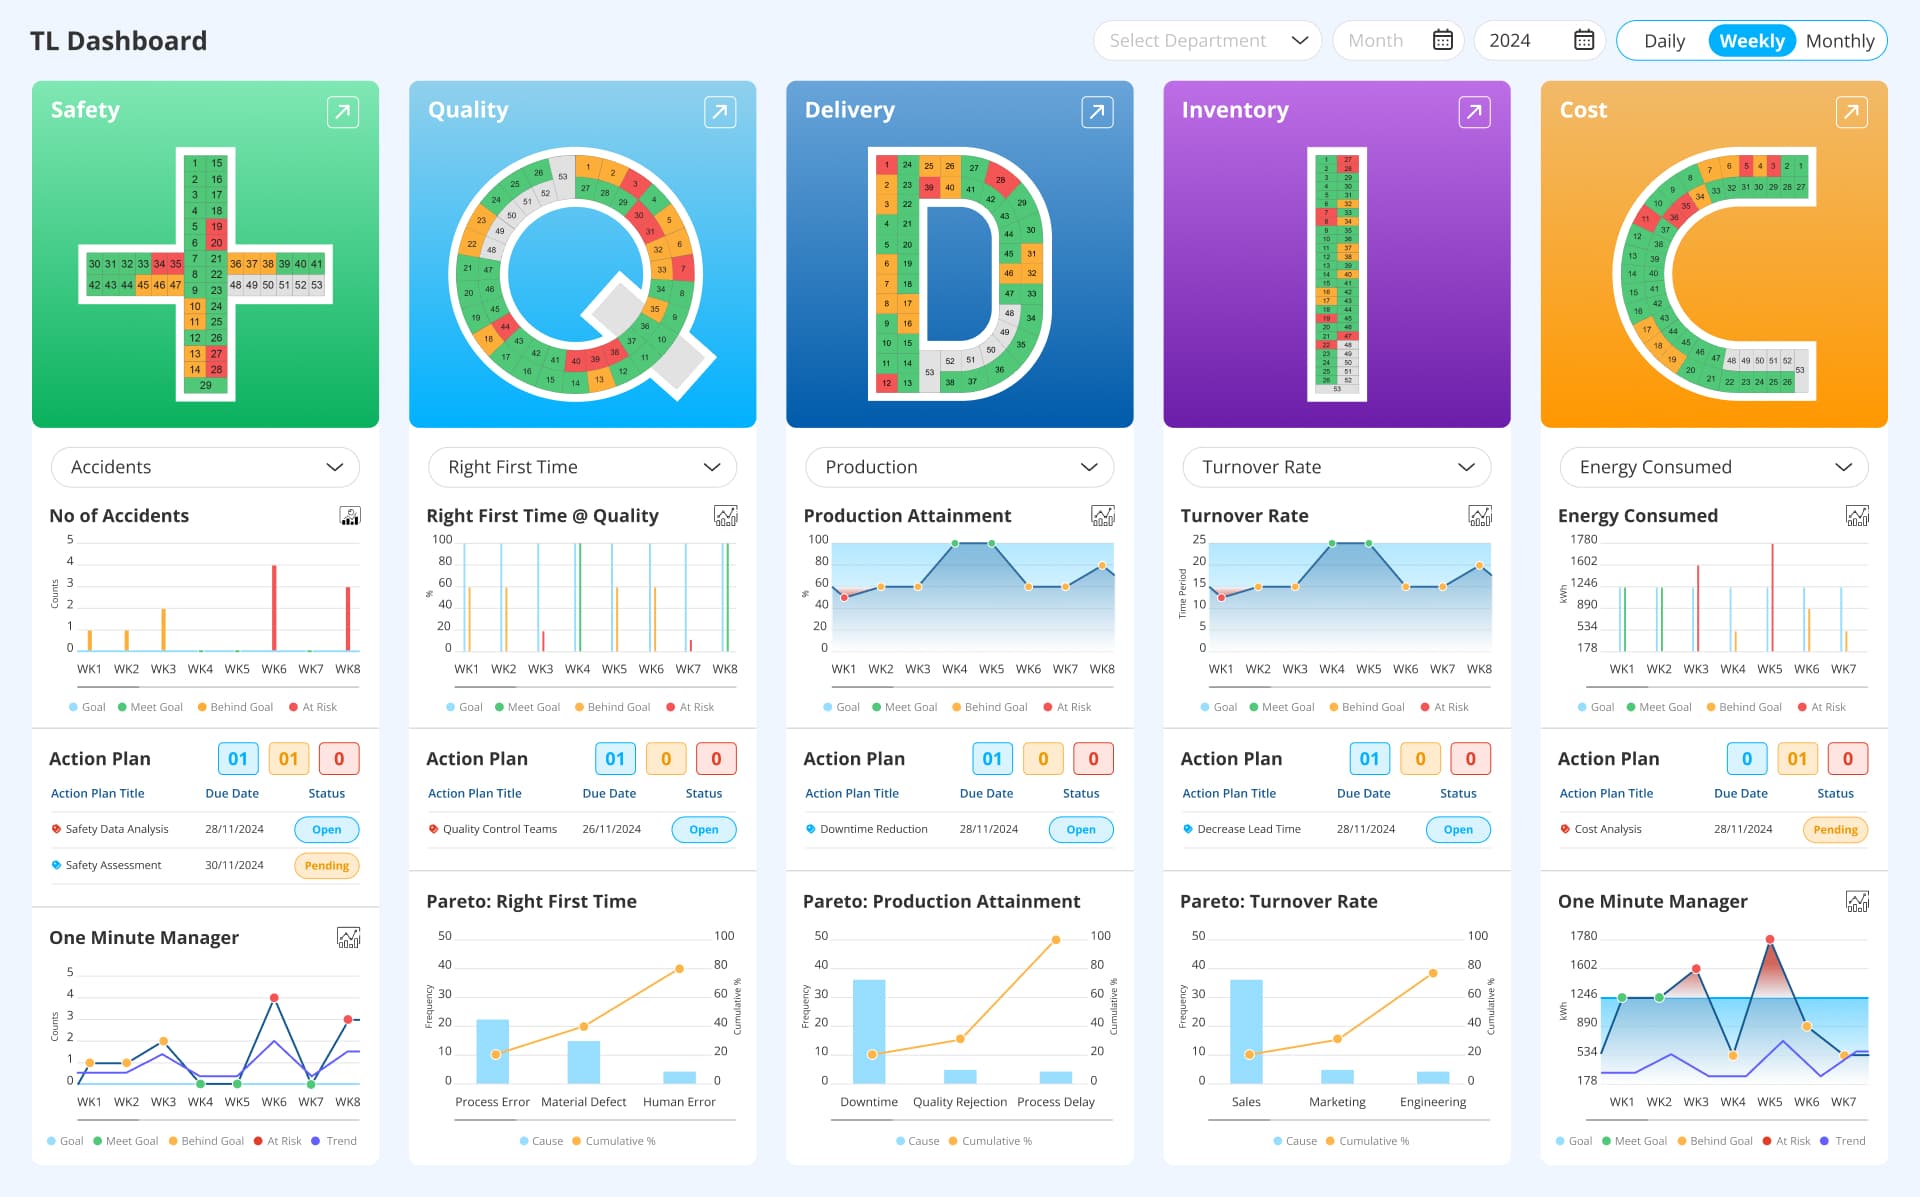
- +QDIC dashboard for live monitoring of Safety, Quality, Delivery, Inventory and Cost KPIs.
- Scorecard dashboard with drill-down Pareto charts for failure reason analysis.
- Tier-based dashboard access:
Tier 0–1: Production KPIs linked to cells and lines.
Tier 2–3: Full functional group data, including department-level KPIs.
- Structured Action Plan Management
- Introduced the 4C Action Plan – Concern, Cause, Correction, Confirm.
- Centralised table view for all actions with status, owner, escalation count, and due dates.
- Built-in escalations, closure confirmations, and effective check tracking.
- Linked directly to Failure Reason Analysis and KPI dashboards.
- Advanced Insights & Reporting
- Labor Rate Analysis :
Tracks labor hours lost due to specific issues, calculates corresponding costs, and compares against predefined goals. - Q Metric Report :
Analyses line interruptions, categorises problems, and tracks open/closed issues with related hours and costs. - Missed Value Report :
Highlights weekly missed production hours against schedule, segmented by weeks, with data from the Scorecard and SICB. - All reports are export-ready and include configurable filters for daily, weekly, or monthly analysis.
- Labor Rate Analysis :
- Enhanced Operational Control
- Digital shift creation, allocation, and operator efficiency management.
- Configurable KPI setup with custom units, icons, and calculation types.
- Centralised workstation and probe configuration to ensure data accuracy.
Results Achieved
The leadership team decided to adopt our Data Point Balanced Scorecard after extensive evaluation. Key implementation stages included:
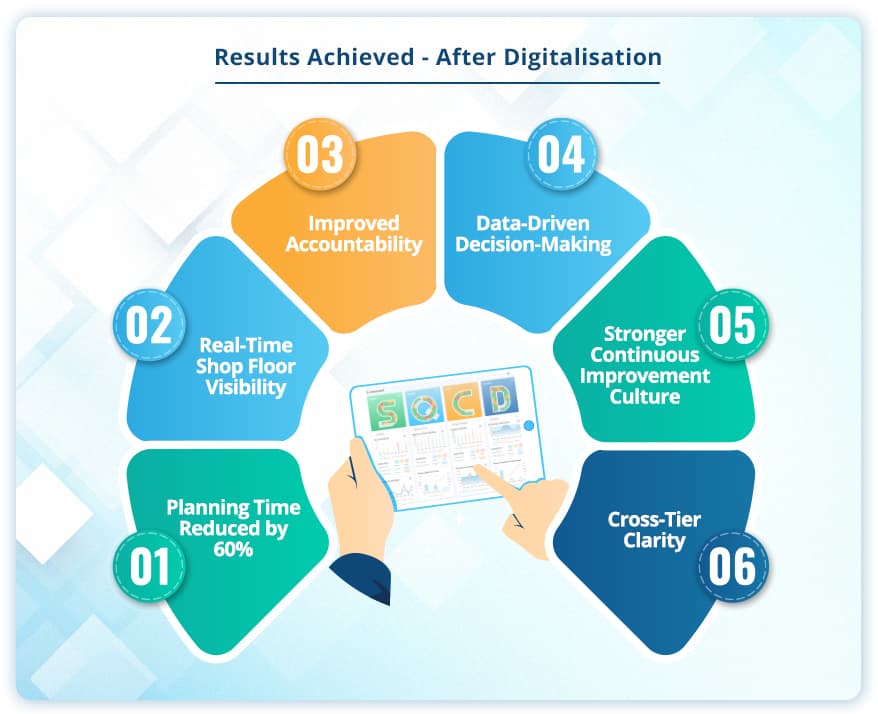
- Planning Time Reduced by 60% through automation of Excel and SAP data integration.
- Real-Time Shop Floor Visibility enabled immediate variance detection and issue logging.
- Improved Accountability via structured action tracking with escalations and confirmations.
- Data-Driven Decision-Making supported by KPI dashboards, Pareto charts, and advanced cost analysis reports.
- Stronger Continuous Improvement Culture by embedding 4C, CAPA, and failure analysis into daily operations.
- Cross-Tier Clarity across all levels, from operators to plant management, aligned on a single source of truth.
Conclusion
By replacing fragmented spreadsheets, manual boards, and siloed reports with one digital performance management platform, the organisation shifted from reactive reporting to proactive control. From Tier 0 operators to plant-level leadership, every stakeholder now has the ability to plan, track, and improve in real time — with decisions backed by live, accurate, and actionable data.