Lean Visual Management: The complete guide to transforming your operations
Last updated on : January 29, 2026
Lean visual management uses visual signals, boards, and displays to make work processes, performance metrics, and problems immediately visible, enabling faster decision-making and continuous improvement across manufacturing operations.
Lean visual management transforms how organisations communicate critical information on the shop floor. Instead of hunting through spreadsheets or waiting for status meetings, your team gets instant insights through visual displays that make problems obvious and solutions clear.
What is Lean visual management?
Lean visual management is a systematic approach that uses visual tools to communicate information quickly and effectively across your operations. At its core, it makes processes, performance, standards, and problems immediately visible to everyone who needs to see them.
Think of it as your operation's dashboard but positioned right where the work happens. Through carefully designed visual cues like colour-coded boards, charts, floor markings, and digital displays, lean visual management ensures that anyone can understand your operational status at a glance.
The methodology originated within the Toyota Production System, where visual controls helped teams spot abnormalities instantly and respond without delay. Today, lean visual management has evolved into a comprehensive framework that combines traditional physical displays with modern digital solutions.
Core principles of Lean visual management
Effective lean visual management follows several fundamental principles that distinguish it from simple information posting:
1. Immediate understanding
Visual displays should communicate status within 30 seconds. Anyone walking past a lean visual management board should instantly grasp whether operations are on track, what problems exist, and who's addressing them.
2. Real-time accuracy
Information must reflect current reality. Outdated metrics destroy trust in the system. Modern lean visual management systems update continuously, ensuring teams always work with fresh data.
3. Standardisation
Visual management in lean manufacturing establishes consistent methods for displaying information across the facility. Teams use the same colour codes, symbols, and layouts, eliminating confusion when people move between areas.
4. Action-oriented design
Every visual element should drive specific behaviours. Lean visual management boards aren't decoration—they're tools that prompt immediate response when metrics fall outside targets.
5. Accessibility for all
Visual displays must be positioned where teams naturally gather and sized for easy viewing. The best lean visual management principles ensure frontline workers access information as readily as managers.
6. Integration with daily routines
Visual management systems become most powerful when embedded into daily huddles, shift handovers, and Gemba walks. Regular interaction keeps the system alive and relevant. Read Lean daily management tools for more insights.
Start your Lean visual management transformation with real-time dashboards, mobile accessibility, and customisable templates
Types of Lean visual management tools
Lean practitioners deploy various visual management tools, each serving specific purposes within the overall system:
Visual management boards
These centralised displays form the backbone of most lean visual management systems. Common board types include:
- SQCDP Boards track safety, quality, cost, delivery, and people metrics in one location. Teams review SQCDP boards these during daily management meetings to identify trends and respond to deviations. This is one of the most important lean manufacturing visual management tools. It has variations such as SQDCM, SQDPI, SQDC etc.
- Kanban Boards visualise workflow status through columns representing different process stages. Cards move across the board as work progresses, making bottlenecks immediately apparent. Kanban board is one of the most recognised examples of visual management in lean manufacturing.
- Kamishibai Boards: Aids structured audit process review processes regularly. Kamishibai boards offers layered process audit for higher efficiency.
- Production Boards display real-time output against targets, often updated hourly. Manufacturing teams use these lean manufacturing production boards to maintain takt time and identify line stoppages quickly.
- Problem-solving Boards document issues, root causes, countermeasures, and ownership. These boards keep improvement work visible and accountable.
- Balanced Scorecard software: A Balanced scorecard digital tool that is used to measure performance against the operational goals of the business within the Balanced Scorecard framework.
Visual controls
Visual controls prevent errors and maintain standards through physical design:
- Andon Lights provide instant status indicators using colour coding green for normal operation, yellow for attention needed, red for line stop. These lights epitomise lean visual management principles by making machine status obvious from anywhere on the floor.
- Floor markings define work areas, material locations, and traffic paths. Shadow boards outline exactly where tools belong, making missing items immediately obvious.
- Standard work charts display the most efficient method for each task visually, ensuring consistency across shifts and reducing variation.
- Visual information boards communicate safety procedures, quality standards, and process flows through images rather than dense text blocks.
Digital visual management
Modern lean visual management software extends traditional approaches:
- Real-time dashboards aggregate data from multiple sources, displaying KPIs that update automatically. These systems eliminate manual data collection while providing broader visibility.
- Digital production boards connect to manufacturing equipment, showing live cycle times, downtime reasons, and quality metrics. This represents the evolution of visual platform for lean manufacturing operations.
- Mobile visual management enables supervisors to access metrics, log issues, and trigger alerts from anywhere in the facility through tablets or smartphones.
Benefits of Lean visual management
Organisations that implement robust lean visual management systems experience tangible improvements across multiple dimensions:
Enhanced communication
Visual displays create a shared language. Instead of relying on verbal updates that may be misunderstood or forgotten, teams reference common visual sources that present facts consistently to everyone.
Improved accountability
When performance metrics are visible to all, ownership and accountability reporting becomes natural. Team members see their contributions reflected in real-time, creating motivation to meet targets and address problems proactively.
Faster problem identification
Lean visual management boards highlight deviations as they occur. Rather than discovering issues hours or days later through reports, teams spot problems immediately and implement countermeasures before small issues become major disruptions.
Reduced waste
By making process flows visible, lean visual management exposes non-value-added activities. Teams identify unnecessary movement, excess inventory, and process delays that previously went unnoticed.
Stronger safety culture
Visual management in lean manufacturing places safety metrics at the forefront. Near-miss tracking, hazard identification, and safety improvement actions remain constantly visible, reinforcing that safety comes first.
Better decision-making
Visual management system for leaders makes them practice data-driven management when visual systems present reliable information. Decisions based on visible evidence replace assumptions and gut feelings.
Increased employee engagement
When people see how their work impacts broader goals through visual management boards designed for lean manufacturing, they feel more connected to organisational success. This visibility fosters pride in accomplishments and commitment to continuous improvement.
Lean visual management board examples
Understanding visual management becomes easier when you examine specific applications:
Daily management board example
A typical lean daily management board tracks:
- Yesterday's production volume versus target
- Quality defects by type with Pareto analysis
- Current backlog status
- Active improvement projects with owners
- Open action items from the previous day
The board uses red-yellow-green colour coding, with red items requiring immediate supervisor attention and green indicating on-target performance.
5S visual management board
Integrating 5S lean visual management principles, these boards display:
- Audit scores by area over the past month
- Photos showing "before and after" improvements
- Scheduled audit dates with auditor assignments
- Outstanding 5S action items
- Recognition for areas achieving perfect scores
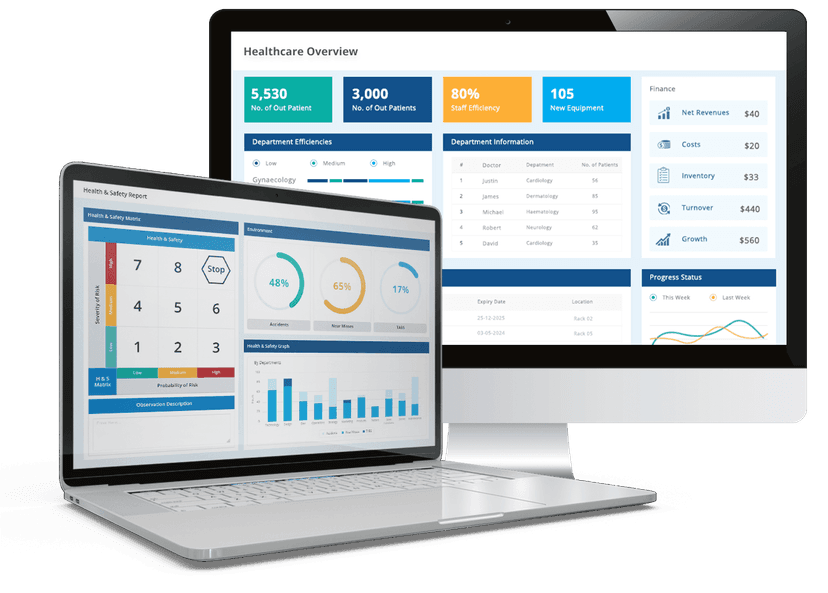
Healthcare visual management board
Lean healthcare visual management adapts manufacturing principles to clinical settings:
- Patient flow metrics (admit-to-bed time, discharge delays)
- Safety indicators (falls, medication errors, infections)
- Staff satisfaction scores
- Supply stock-out incidents
- Process improvement initiatives in progress
Visual management corner
Many facilities establish a lean visual corner- a dedicated space featuring:
- Strategic objectives with progress indicators
- Year-to-date performance against budget
- Customer satisfaction trends
- Workforce development metrics
- Continuous improvement project pipeline
This centralised location serves as the hub for management reviews and organisational alignment discussions.
Looking to build your first Lean visual management board? LTS Data Point can display your daily management
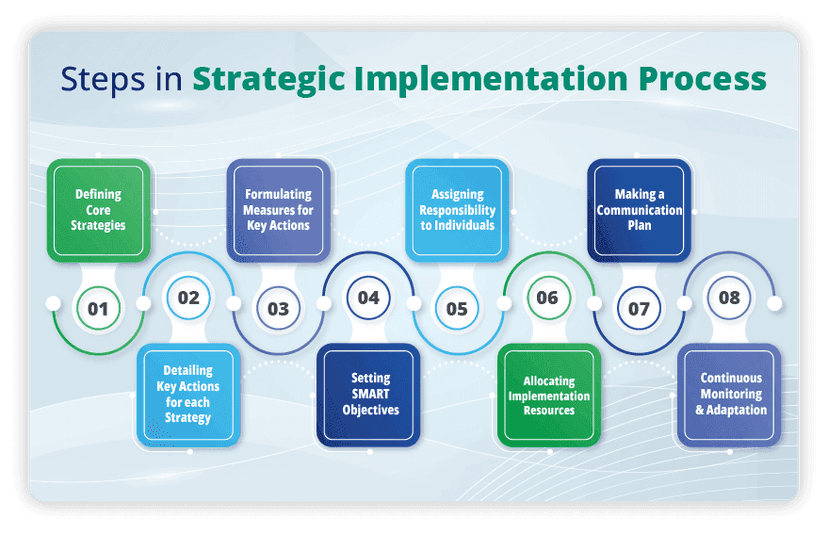
Implementing a Lean visual management system
Successful implementation requires systematic planning and disciplined execution:
Define key performance indicators
Start by identifying which metrics genuinely drive operational performance. Focus on leading indicators that enable proactive management rather than purely lagging measures that only report what already happened.
Consider metrics across safety, quality, delivery, cost, and morale. Involve frontline teams in selecting KPIs—they understand which measurements actually influence daily work.
Design clear visual displays
Layout matters enormously. Organise boards logically with the most critical information positioned prominently. Use consistent colour schemes throughout your facility:
- Green: on target, normal operation
- Yellow: attention required, approaching limit
- Red: problem state, immediate action needed
Keep text minimal. Replace words with symbols, charts, and graphs wherever possible. The goal is instant comprehension, not detailed reading.
Establish data collection processes
Determine who captures each metric, when they record it, and where data resides. Automate collection wherever feasible through direct equipment connections or barcode scanning.
For manually collected data, create simple, foolproof logging methods. Complicated data entry discourages consistent use and introduces errors.
Position boards strategically
Place visual management boards where teams naturally congregate—near production lines, break areas, or shift change locations. Ensure boards are large enough for group viewing during stand-up meetings.
Lighting and viewing angles matter. Test visibility from multiple positions to confirm everyone can see clearly.
Integrate into daily routines
Schedule brief team huddles at each board daily. These 5-10 minute meetings review metrics, discuss red items, assign actions, and celebrate successes.
Leadership gemba walks should include board reviews, demonstrating that visual management drives decision-making at all levels.
Maintain and improve continuously
Appoint board owners responsible for keeping information current. Establish audit processes to verify accuracy.
Regularly solicit feedback about what works and what doesn't. Lean visual management templates provide starting points, but customisation for your specific context improves effectiveness.
Lean visual management software and digital tools
Technology amplifies traditional visual management when implemented thoughtfully:
Real-time data integration
Modern lean visual management software connects directly to manufacturing equipment, ERP systems, and quality databases. This automation ensures displays always show current information without manual updates.
Remote accessibility
Digital platforms enable managers to monitor multiple locations simultaneously. LTS Data Point and similar solutions provide web-based dashboards accessible from any device, extending visibility beyond the physical shop floor.
Historical trending
While physical boards excel at displaying current status, digital tools effortlessly track historical patterns. Teams analyse trends over weeks or months to identify recurring issues and validate improvement effectiveness.
Customisation and flexibility
Software platforms allow rapid board reconfiguration as priorities shift. Teams experiment with different layouts and metrics without reprinting physical displays.
Alert capabilities
Automated notifications flag critical events immediately. Rather than waiting for someone to notice a red condition on a board, the system sends alerts directly to responsible parties.
Data analytics
Advanced lean visual management systems incorporate analytics that surface insights invisible in raw metrics. Predictive algorithms might identify equipment degradation before failures occur or forecast capacity constraints during demand spikes.
Challenges in implementing visual management supplies and resources
Despite clear benefits, organisations encounter common obstacles:
Resistance to transparency
Some supervisors resist visual management because it makes performance gaps obvious. This challenge requires cultural work emphasising learning over blame and positioning problems as improvement opportunities.
Maintaining accuracy
Visual systems lose credibility when information becomes stale. Organisations must establish clear ownership, simple update processes, and accountability for data quality.
Information overload
Displaying too many metrics creates visual clutter that obscures what matters most. Successful implementations ruthlessly prioritise, showing only actionable information relevant to the audience.
Sustaining engagement
Initial enthusiasm often fades without deliberate sustainment efforts. Regular leadership attention, continuous improvement to the boards themselves, and celebration of successes maintain momentum.
Balancing physical and digital
While digital solutions offer advantages, completely eliminating physical displays often reduces effectiveness. The most successful lean visual management systems blend both approaches. Digital for complex analytics and historical data, physical for immediate shop floor visibility.
Explore Challenges of visual management in manufacturing for in-depth understanding of the challenges of implementing lean visual boards can be solved.
Lean six sigma visual management integration
Combining lean visual management with Six Sigma methodologies creates powerful synergy:
Visual management boards track Six Sigma projects, displaying:
- DMAIC phase status for each active project
- Process capability indices (Cp, Cpk) trended over time
- Defects per million opportunities (DPMO)
- Project financial benefits realised versus projected
This integration ensures improvement work remains visible and connected to operational performance.
Industry-specific applications of Lean visual management
Lean visual management adapts to various contexts:
Manufacturing process simulation
Visual management boards in production planning display capacity utilisation, changeover schedules, and material availability. This enables proactive resource allocation and bottleneck avoidance.
Lean visual effects in product development
Development teams apply visual management principles to project portfolios, showing concept status, resource assignments, and milestone tracking through Kanban-style boards.
Lean visual basics for service operations
Service industries adapt manufacturing principles, using visual boards to track call centre metrics, order processing times, and customer satisfaction trends.
Lean methodology visual management in supply chain
Distribution centres employ visual management for order accuracy, shipping deadlines, inventory turns, and warehouse organisation audits.
Measuring visual management effectiveness
How do you know if your lean visual management system delivers value?
Track these indicators:
- Time required to understand operational status (target: under 30 seconds)
- Problem response time from identification to countermeasure implementation
- Employee engagement survey scores related to communication and empowerment
- Number of improvements generated through board discussions
- Accuracy of visual information when audited
Conduct regular assessments asking: "Does this board help people do their jobs better?" If not, change it.
The future of Lean visual management
Visual management continues evolving as technology advances:
- Augmented reality: AR overlays might display real-time metrics directly within an operator's field of vision, eliminating the need to look away from work.
- Artificial intelligence: AI algorithms could automatically highlight patterns in visual data, directing attention to the most impactful improvement opportunities.
- IoT integration: Connected sensors will feed visual management systems automatically, eliminating most manual data collection while increasing accuracy and timeliness.
- Cloud-based collaboration: Remote teams will interact with visual management boards through virtual environments, extending lean principles to distributed operations.
Despite technological advances, the core lean visual management principles remain constant: make problems visible, enable quick action, and empower people closest to the work.
Ready to implement lean visual management in your facility? Start with multiple tools for your tailored solutions.
Quick tips for Lean Visual Management success
- Start small: Begin with one board in one area, perfect the approach, then expand facility-wide
- Involve the team: People support what they help create—engage frontline workers in board design
- Update religiously: Stale data destroys credibility faster than no board at all
- Use colour wisely: Stick to simple red-yellow-green schemes that communicate status instantly
- Position strategically: Place boards where daily team meetings occur naturally
- Keep it simple: Display only actionable information; remove clutter ruthlessly
- Review and revise: Treat boards as experiments; continuously improve them based on team feedback
- Lead by example: Managers must reference visual boards regularly to demonstrate their importance
FAQs
1. What is the main purpose of lean visual management?
The primary purpose is to make work processes, performance standards, and operational problems immediately visible to everyone, enabling faster decision-making, improved accountability, and continuous improvement without requiring lengthy reports or meetings. Target snippet style: definition.
2. How do visual management boards differ from traditional reporting?
Visual management boards provide real-time information displayed where work happens, enabling immediate action, while traditional reports are historical, delayed, and often reviewed away from operations. Boards make status obvious at a glance versus requiring detailed reading and analysis. Target snippet style: definition.
3. What metrics should appear on a lean visual management board?
Essential metrics include safety incidents, quality defects, production volume versus target, on-time delivery performance, and improvement actions. Choose leading indicators that enable proactive intervention rather than only lagging measures that report what already occurred. Target snippet style: list.
4. How often should visual management boards be updated?
High-frequency production metrics should update hourly or every shift. Daily metrics update once per day, typically during morning meetings. Weekly or monthly trends update on their respective schedules. The key is consistency—establish clear ownership and update routines. Target snippet style: how-to.
5. Can small operations benefit from lean visual management?
Absolutely. Small operations often see faster results because implementing visual management across fewer areas takes less time, and the entire team can align quickly around common metrics. Start with one simple board tracking your three most critical performance indicators. Target snippet style: definition.
6. What's the difference between visual controls and visual displays?
Visual displays show information like metrics, project status, or performance trends. Visual controls prevent mistakes and ensure standards through physical design elements like floor markings, shadow boards, or andon lights that signal status automatically. Both are essential components of complete systems. Target snippet style: definition.
7. How does digital visual management compare to physical boards?
Digital solutions offer real-time data integration, remote accessibility, and historical trending. Physical boards provide immediate shop floor visibility, tactile interaction, and no dependency on technology. Most effective lean visual management systems combine both approaches strategically.
8. What makes a visual management board effective?
Effective boards communicate status within 30 seconds, position information where teams naturally gather, use consistent colour coding, display only actionable metrics, update reliably, and integrate into daily management routines like huddles and gemba walks.
9. How do you sustain lean visual management long-term?
Long-term sustainability requires clear board ownership, regular leadership attention, integration into daily routines, continuous improvement of the boards themselves, celebration of successes, and cultural support for transparency that treats problems as improvement opportunities rather than blame opportunities.
10. What role does technology play in modern visual management?
Technology automates data collection, enables remote monitoring, provides historical trending, and delivers advanced analytics. However, technology should enhance rather than replace the immediate visibility and team engagement that physical boards create on the shop floor.

Amer Jumah, Senior Lean Consultant
Amer is co-founder of Agile Solutions and a certified Six Sigma Black Belt, Lean Black Belt, and PMP, with over nine years of experience implementing Lean, Six Sigma, and Agile principles across diverse industries. He specialises in process optimisation, waste elimination, and delivering cost savings through organisational change.