Strategy map for operational excellence: Manager’s guide
Last updated on : August 22, 2025
Whether you're leading a production line, a supply chain team, or an enterprise-wide initiative, a strategy map for operational excellence enables you to see the bigger picture and act with confidence.
A well-crafted strategy map serves as a powerful visual tool that helps managers connect the dots between strategic objectives, operational goals, and performance outcomes.
According to surveys, nearly 70% of Fortune 1000 companies had adopted the Balanced Scorecard framework by 2006, and 88% of high-performing organisations were still using it for strategic execution.
As per Phoenix Business Journal, even though setting goals and objectives is critical for success, many companies fall short. Studies show that only about half of business leaders actually define their goals—and fewer than 10% revisit them consistently. Moreover, research shows that companies using strategy maps along with Balanced Scorecards (BSC) report dramatically better alignment and operational performance.
But what exactly is a strategy map, and how can managers use it to drive operational excellence?
In this, we’ll walk you through the step-by-step process of creating and implementing a strategy map, using proven techniques such as SWOT analysis, gap analysis, and the Balanced Scorecard Framework. Whether you're new to strategic planning or looking to sharpen your strategic execution, this manager’s guide will show you how to turn your plan into a strategy map, map into actions and actions to results.
Are you a manager or operator struggling for excellence? Then this blog is for you!
What is a strategy map?
A strategy map is a visual map used in strategic planning to communicate how an organisation will achieve its strategic objectives and goals. It links key business goals across four core perspectives—financial, customer, internal processes, and learning and growth (FCIL). This helps align teams, improve decision-making, and ensure every department works toward the same vision and purpose. In short, a strategy map in strategic management is not just a planning tool; it’s a visual narrative that helps track business performance in real time.
Ever wondered how a strategy map looks like? Discover the answer
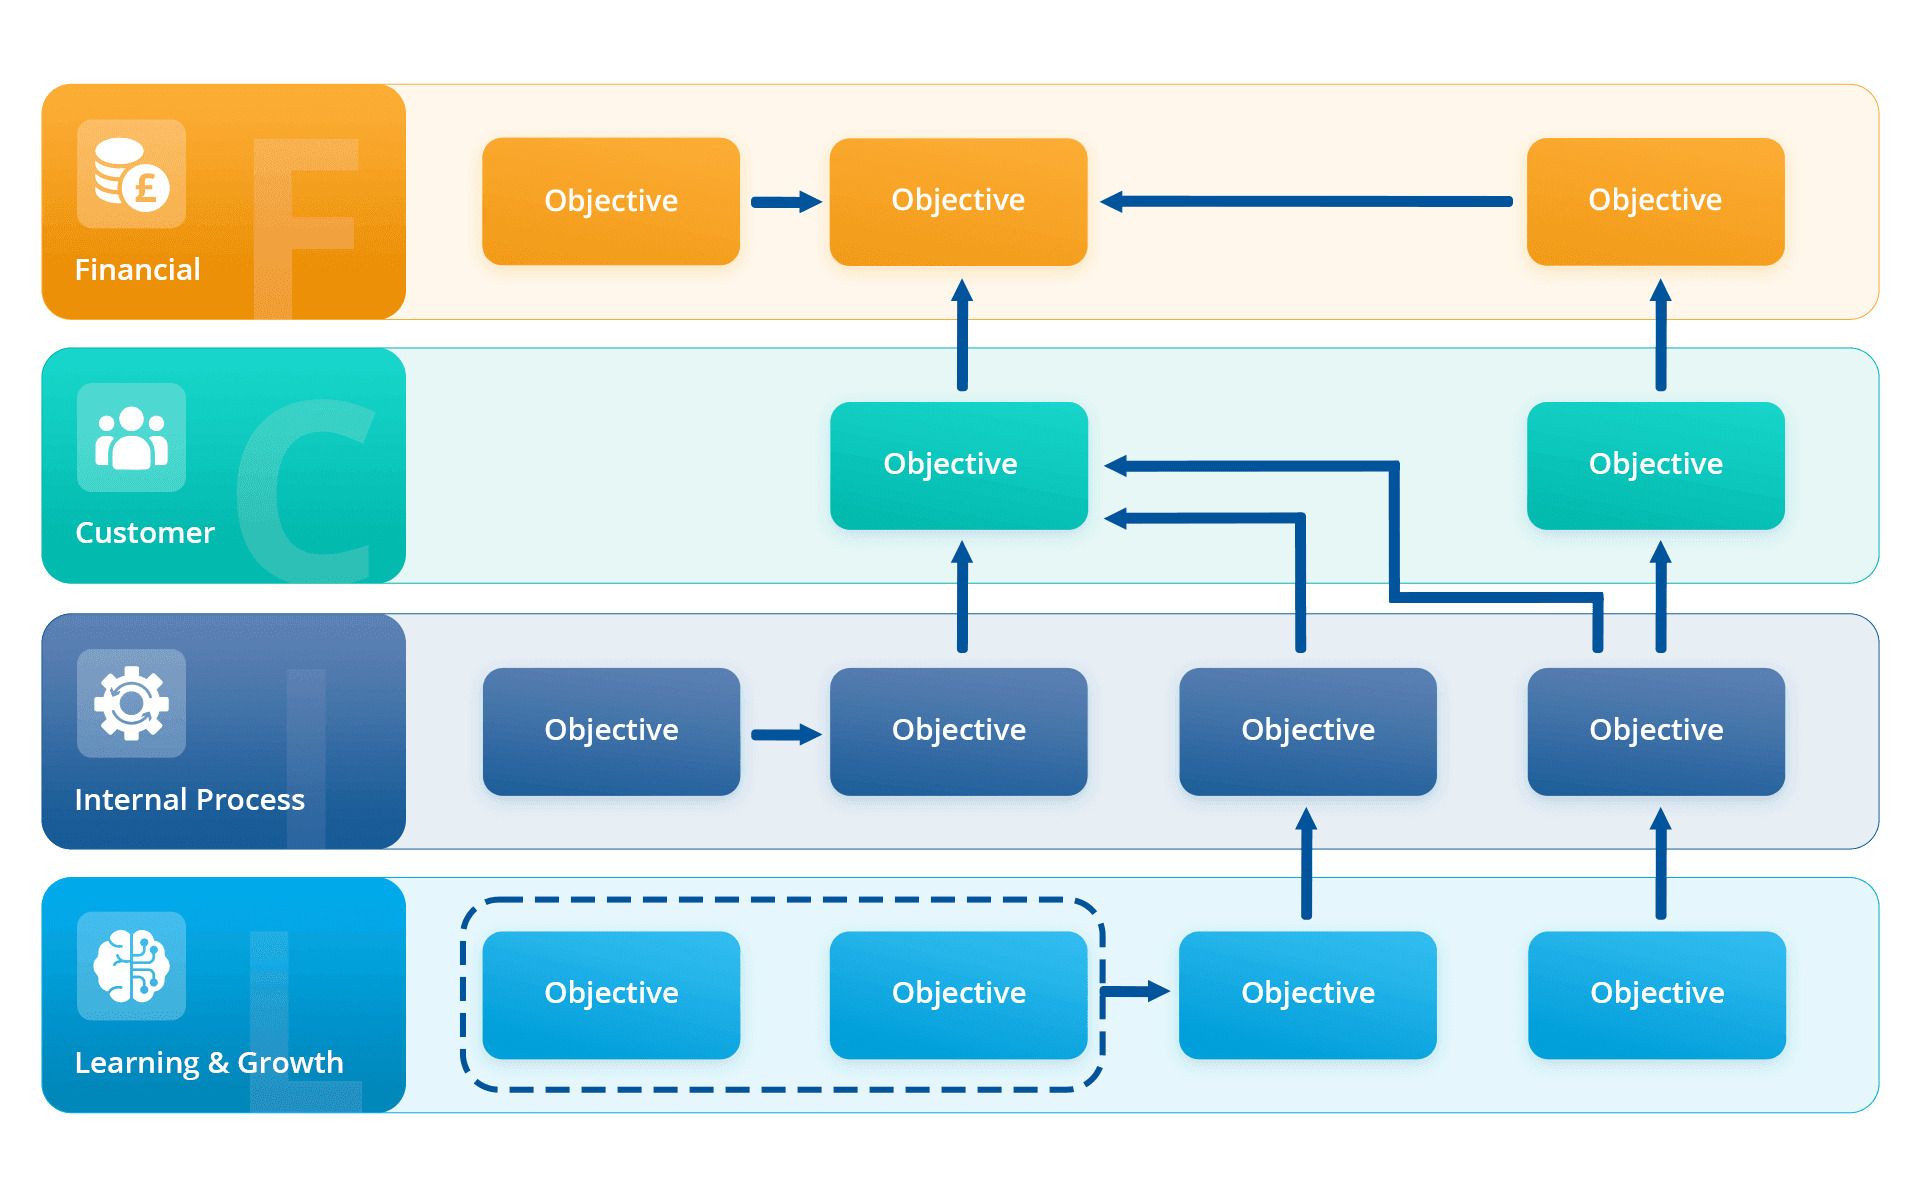
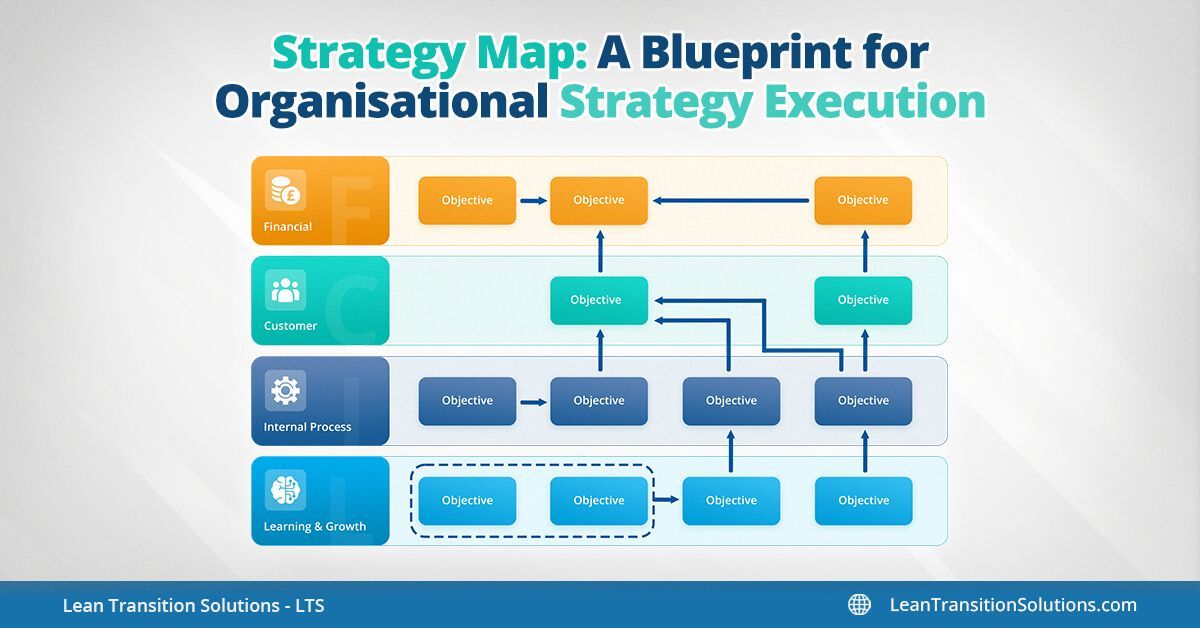
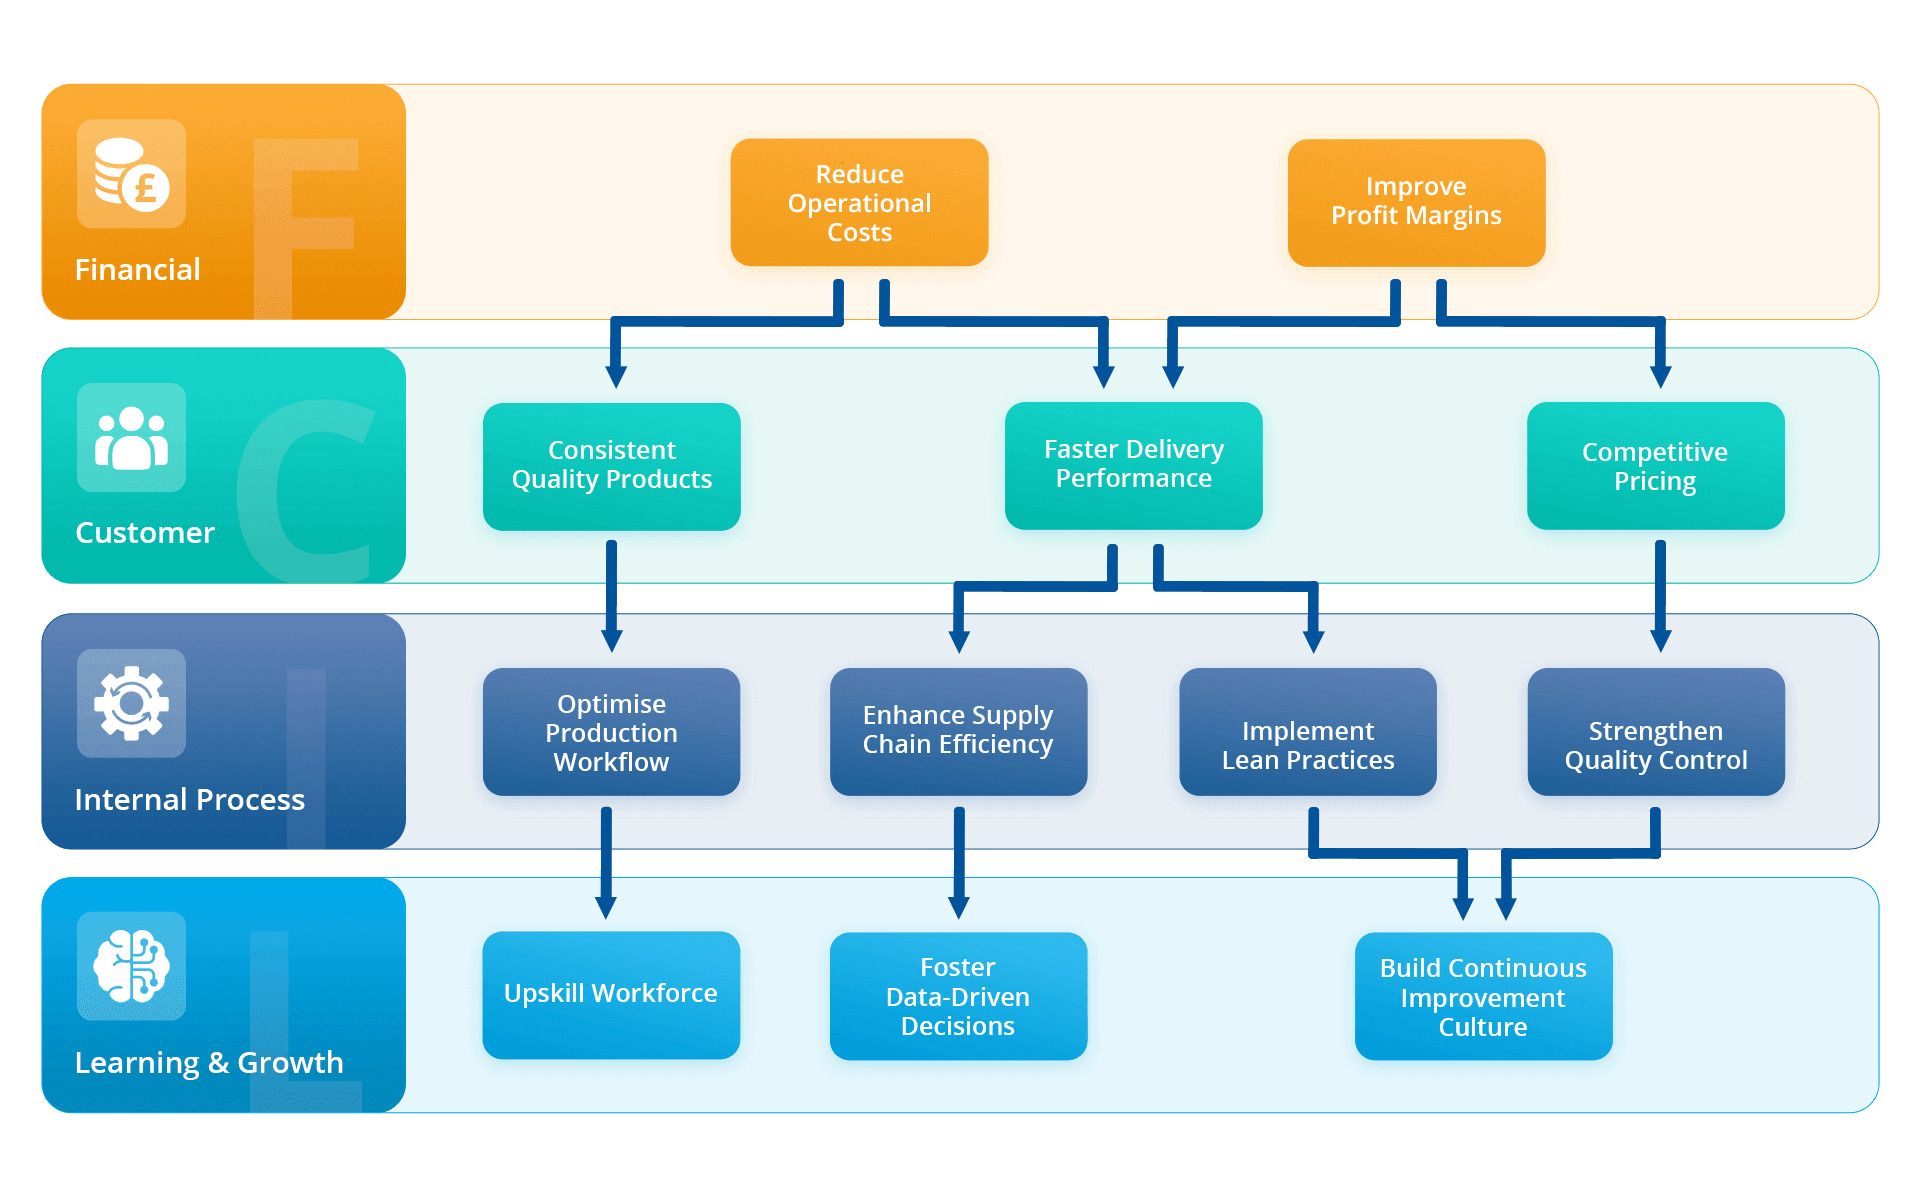
A strategy map is usually shown as a diagram with four layers (Financial, Customer, Internal Process, Learning & Growth). Each layer has goals, and arrows connect them to show cause-and-effect. Visually, it looks like a flow chart or pyramid, with learning & growth at the base, supporting processes, which improve customer outcomes, leading to better financial results.
Key elements of a strategy map
- Financial perspective – Goals focused on profitability, cost reduction, or revenue growth.
- Customer perspective – Objectives related to satisfaction, trust, or market share.
- Internal processes – Prioritised processes that drive efficiency and quality across departments.
- Learning & growth – Goals targeting employee development, skill training, culture, and innovation.
These elements create a visual structure of your end-to-end story that aligns strategy with execution.
Transform your goals into measurable wins with strategy mapping!
How to create a strategy map: Step-by-step guide
A bottom-to-top approach, i.e. from learning and growth to financial perspective, is often more effective in strategy mapping. When the basics are right, profitability and success follow naturally. Keep the number of objectives low to ensure the template or map stays simple, understandable, and easy to execute.
Define your mission, vision, and core values
Planning should come first, understanding your core values is fundamental in from planning to execution. No matter how well-defined your goals are, they won’t drive meaningful results unless they reflect your company's core beliefs.
Establish strategic goals, KPIs, and OKRs
Conduct a SWOT analysis, perform gap analysis, and gather insights via gemba walks. This helps to define focused objectives and align your KPIs and OKRs with operational truths.
Define the four perspectives
Structure your objective flow charts under the Balanced Scorecard framework: Financial, customer, internal processes, and learning & growth as per the industry needs. Align actions and resources to achieve these goals.
Set priorities and establish cause-and-effect links
Rank your goals in order of impact. Visualise how actions in one area impact another, interplay with various strategic goals and investigate ripple effects they are creating.
Assign SMART KPIs to each objective
KPIs to be Specific, Measurable, Achievable, Relevant, and Time-bound.
Finalise the strategy map
Format the map using software or templates. Validate mind map with stakeholders across levels to ensure transparency and accountability.
Implement feedback and continuous review
Collect input from shopfloor to executive levels to clarify business goals. Strategy maps are living documents—revise them regularly as priorities shift and create value.
How to link KPIs to your strategy map?
Linking KPIs to your strategy map is essential to track execution, measure progress, and drive continuous improvement. By connecting KPIs to your strategy map, you ensure your business goals are not just visualised—but measured, managed, and achieved.
Here’s how to do it effectively:
- Define specific KPIs for each strategic objective- Each goal in your strategy map should have one or more associated KPIs that clearly measure its success and create value.
- Align KPIs with strategic goals- Map the KPIs across the four Balanced Scorecard FCIL perspectives.
- Make KPIs SMART- Ensure all KPIs are Specific, Measurable, Achievable, Relevant, and Time-bound to enhance accountability.
- Use KPI action plans and dashboards- Link your KPIs to digital dashboards or strategy map software for real-time performance visibility and easy reporting.
- Review regularly- Evaluate KPI performance during tier meetings and strategy reviews to keep teams aligned and make necessary adjustments.
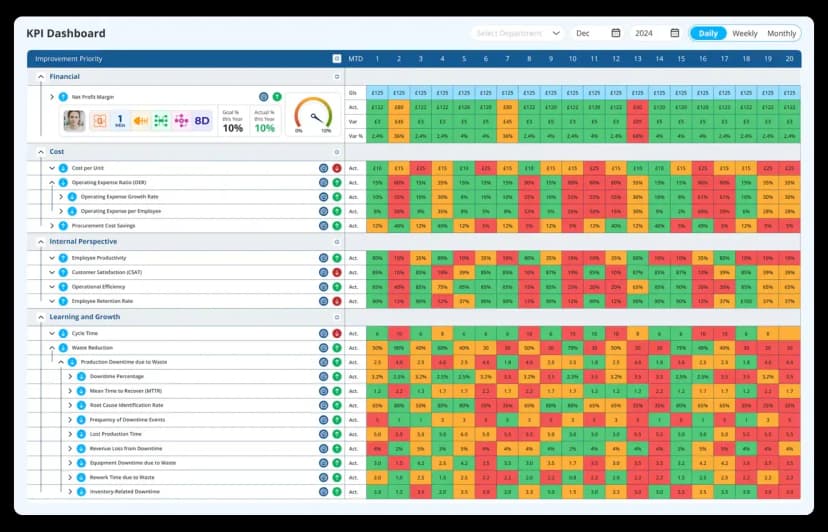
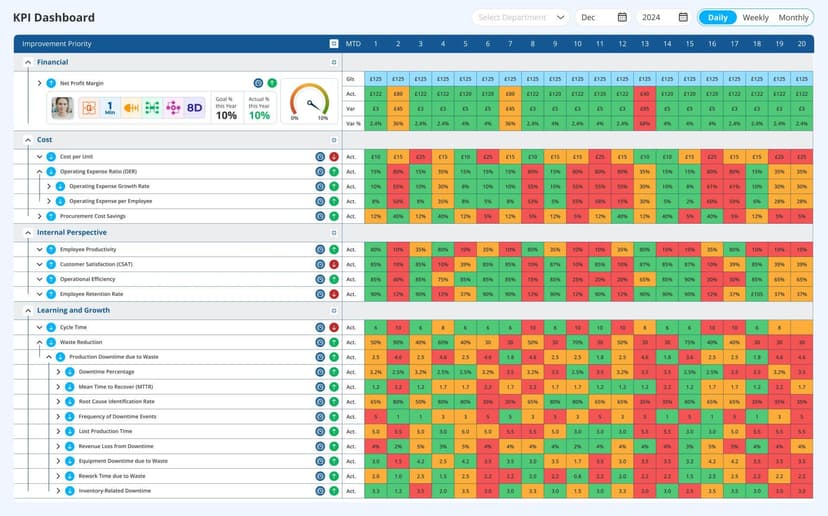
Visual strategy map for lean manufacturing teams
Lean manufacturing teams thrive on visibility, standardisation, and continuous improvement. A visual strategy map is a mixture of good and bad performance indicators which enhances strategic management and planning by offering a clear line of sight from strategic goals down to frontline execution. For Lean teams, this kind of visualisation aligns naturally with methodologies like SQDCP templates (Safety, Quality, Delivery, Cost, People), PDCA cycles, and Kaizen when integrated with Data Point.
Map your way to operational excellence with Data Point
Balanced scorecard strategy map examples
Manufacturing industry
In manufacturing, visual clarity in a strategy map helps spot production bottlenecks, streamline planning, optimise resource allocation, boost productivity, and cut costs. Along with that strategy map helps manufacturing teams aligns their overall actions in a single graphic map.
For example, reducing the cost per unit is supported by improving product quality and delivery time, minimising rework, and training teams in lean practices like continuous improvement and daily lean management.
Healthcare industry
In healthcare, strategy maps improve and help leaders with visual clarity to connect patient care goals with operational priorities. Its visual features—whether digital dashboards or physical charts—make it easier to identify bottlenecks in care delivery, track compliance, and align staff efforts. This clarity helps hospitals and clinics plan resources effectively, improve treatment outcomes, and meet both patient and regulatory expectations.
For patients, this visual map helps hospitals to reduce wait times, standardise treatments, and improve staff coordination—leading to safer care, faster recovery, and better overall experiences.
Banking sector
Strategy map provides the banking sector with clear visual clarity in both planning and execution. By aligning objectives across four perspectives, banks can easily see how different activities connect.
For example, from a financial perspective, banks focus on improving profitability through cost control and balanced lending. The customer perspective emphasises building trust and loyalty with better digital experiences and personalised services. The internal process perspective ensures efficiency by streamlining loan approvals, enhancing compliance checks, and reducing delays. Finally, the learning & growth perspective highlights the need to upskill employees in fintech tools and data-driven decision-making.
This visual flow makes it easier for banking leaders to communicate strategy, align departments, and track progress, ensuring that every initiative contributes directly to stronger customer relationships and improved financial performance.
Data Point – The best software to map your strategy
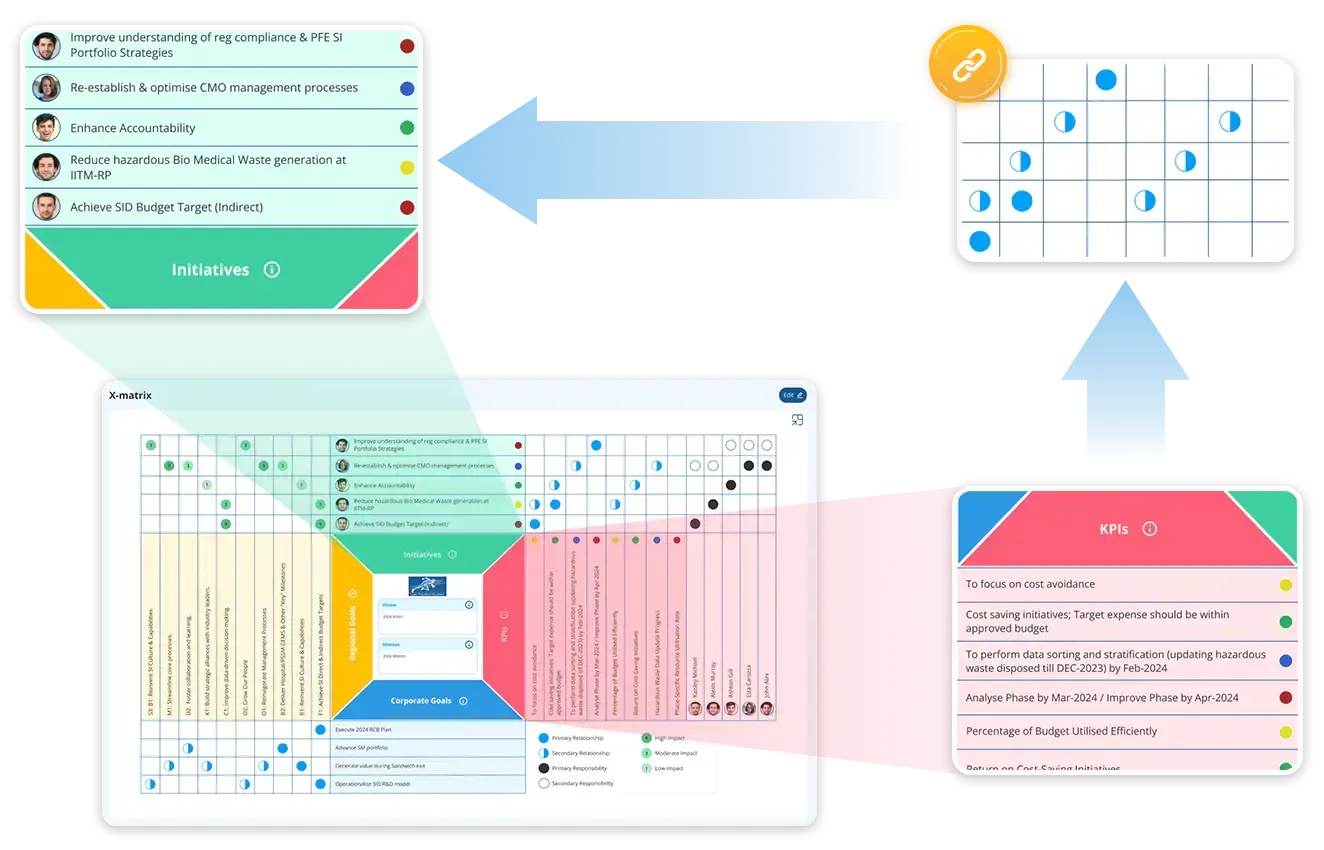
LTS Data Point is more than just a strategy map tool—it’s a comprehensive operational excellence platform designed to visually connect strategic goals, KPIs, and daily actions. As the best strategy map and planning software for manufacturing and lean-driven industries, Data Point empowers leaders to map their vision, align teams, and track real-time insights and optimise performance with unmatched clarity.
With interactive mind maps and x-matrix integration, managers can link SMART goals, KPIs, OKRs, and key focus areas of FCIL. The software seamlessly incorporates SWOT and gap analysis template, making it ideal for robust strategic planning. Data Point creates a visual strategy map that transforms abstract objectives into actionable plans using intuitive drag-and-drop functionality and color-coded goal tracking.
Key features include:
- Visual representation of goals, KPIs, OKRs, and strategic priorities
- Multi-user access across departments for collaborative planning
- Real-time KPI tracking with WIP dashboard, OEE (overall equipment efficiency) dashboard, Super dashboard, Scorecard dashboard
- Integrated daily digital huddle tools for frontline strategic alignment
- Team leader dashboard and one minute manager for quick status reviews
- Daily lean management boards for SQDCP frameworks, SQDCM templates for continuous improvement
- Seamless linkage with Hoshin Kanri X-matrix for top-down strategy execution
- Performance dashboards to monitor departmental, individual, and cross-functional performance
LTS Data Point provides a complete strategy to execution mapping. From high-level goal mapping to on-the-ground performance tracking, it ensures your entire organisation is moving in one direction—towards operational excellence. This makes Data Point -the best software for strategy mapping.
Benefits of using a strategy map
- Strategic alignment across teams- strategy maps visually connect company-wide objectives with departmental and individual goals, ensuring everyone works toward the same mission.
- Enhanced decision-making- with clear root cause analysis techniques, managers can better prioritise resources and choose actions that drive measurable results.
- Improved communication- strategy maps simplify complex goals, making them easier to communicate across leadership, shop floor teams, and support functions.
- Performance visibility- when combined with KPIs and dashboards, strategy maps help track progress in real time and identify gaps before they escalate.
- Supports continuous improvement- strategy maps integrate well with lean tools like PDCA and Hoshin Kanri matrix, reinforcing a culture of ongoing performance improvement.
- Cascade goals and streamline execution- it turns strategic planning into actionable steps by clearly defining goals across financial, customer, process, and learning perspectives.
- Drives accountability, transparency and traceability- by linking strategic objectives to individual and team responsibilities, ensuring ownership and accountability at every level.
Close the gap between planning and performance – Visualise your strategy now!
Common mistakes and tips to keep in mind while planning strategic objectives
1. Skipping core values
Many companies rush into setting goals without grounding them in core values. Without this foundation, even well-designed KPIs and OKRs may drive the wrong behaviors or priorities.
2. Overloading the strategy map
Including too many objectives makes execution confusing. Stick to a manageable number—fewer but clearer goals help teams stay focused and aligned.
3. Ignoring feedback from the shop floor
Strategic objectives should be informed by real-world challenges. Excluding shopfloor insights leads to impractical goals and lack of ownership at the operational level.
4. Unclear or vague KPIs
Vague metrics lead to vague results. KPIs should be SMART—Specific, Measurable, Achievable, Relevant, and Time-bound—to effectively track performance.
5. Failing to link objectives across perspectives
Each objective in one perspective should support goals in others. Many maps fail to show this connection clearly.
6. No built-in review cycle
A strategy map isn’t a one-time plan. Without regular reviews and updates, it quickly becomes outdated and disconnected from current business realities.
7. Not using visual tools
Relying on documents or slides instead of interactive visual software can limit clarity and team engagement. Visual strategy tools improve understanding and tracking.
8. Top-down only planning
Only involving top management often results in disconnected goals. A bottom-up approach encourages realistic objectives and stronger execution.
Operational excellence doesn’t happen by accident—it’s the result of clear direction, focused execution, and continuous alignment across all levels of your organisation. A well-planned strategy map transforms vague ambitions into visual, trackable goals, empowering managers to lead with clarity and purpose.
By integrating tools like SWOT analysis, gap analysis, KPI dashboards, and Balanced Scorecards with a smart software like Data Point, you ensure that every objective is actionable, every metric is meaningful, and every team member is rowing in the same direction.
Ready to align your vision with daily execution?
FAQs
1. What is a strategy map?
A strategy map is a visual tool that outlines an organisation’s strategic objectives and shows how they interconnect across key business areas to drive performance and alignment.
2. What are the four perspectives of a strategy map?
The four perspectives are:
- Financial
- Customer
- Internal processes
- Learning and growth
These align short-term actions with long-term goals.
3. What are the 7 elements of a strategy map?
The seven key elements are:
- Vision
- Mission
- Core Values
- Strategic Objectives
- Four Perspectives
- Cause-and-effect Relationships
- KPIs or Performance Metrics
What is the difference between a Balanced Scorecard and a strategy map?
A Balanced Scorecard is a performance measurement system, while a strategy map is a visual representation of strategic objectives within the Balanced Scorecard framework.
5. How do you create a strategy map?
To create a strategy map:
- Define mission, vision, and core values
- Conduct SWOT and gap analysis
- Identify objectives across the four perspectives
- Link goals using cause-effect logic
- Assign KPIs and review regularly
6. What are the 5 key points of a business strategy?
The five points are:
- Vision and Mission
- Goals and Objectives
- Core Competencies
- Competitive Advantage
- Execution Plan
7. What is the difference between a roadmap and a strategy map?
A roadmap outlines the timeline and sequence of actions, while a strategy map shows the relationships between strategic objectives across business areas.
8. When should you use a strategy map?
Using a strategy map during strategic planning, OKR/KPI development, lean transformation, performance reviews, or any time alignment across teams is critical.
9. What should a strategy map include?
A strategy map should include:
- Strategic goals
- Four perspectives
- Linked objectives
- Performance indicators (KPIs/OKRs)
- Clear visual structure for alignment and tracking
10. What are the 7 C' s of strategic planning?
The 7 C' s of strategy planning are key principles that guide effective strategic thinking and execution:
- Clarity – define clear mission, vision, and objectives.
- Consistency – align goals across departments and timeframes.
- Commitment – secure leadership and team buy-in for execution.
- Competence – ensure your team has the skills and tools to deliver.
- Creativity – encourages innovation in goal setting and problem solving.
- Coordination – align teams, processes, and resources.
- Control – use KPIs and reviews to track progress and adjust.
11. Give an example of strategy map template
It follows the simple flow: People → Processes → Customers → Finance (bottom-up cause and effect).
And they focus on:
- Financial: Increase revenue and profit
- Customer: Improve customer satisfaction and loyalty
- Internal Process: Streamline workflows and reduce delays
- Learning & Growth (People): Train employees and build new skills

Abel Jiménez, Lean Consultant
Abel is a Lean Consultant with over 30 years of expertise in operational analysis, process improvement, and organisational change across Mexican industries. Currently serving as Director of Insurance Promotions at CESCEMEX, he helps organisations leverage technology and lean practices to improve efficiency and manage change with continuity.