Turn Strategy into Measurable Results with Strategic Alignment Software
Data point ensures every organisational goal, initiative, resource, and operation is in sync with the overarching strategy.
Achieve organisational harmony with Strategic Alignment
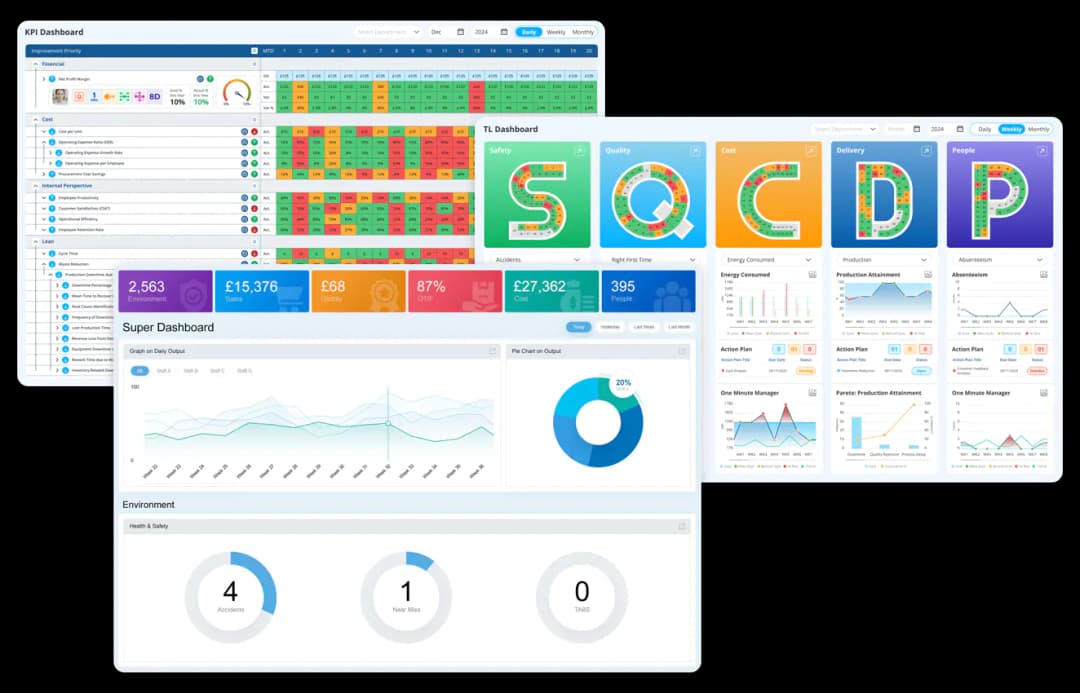
The advanced visual dashboards of Data Point turn complex data into clear, actionable insights fostering better collaboration.
- Unified data representation
- Customisable templates and data views
- Drag-and-drop dashboard builder
- Multi-user data sharing
- Instant decision-ready analytical insights
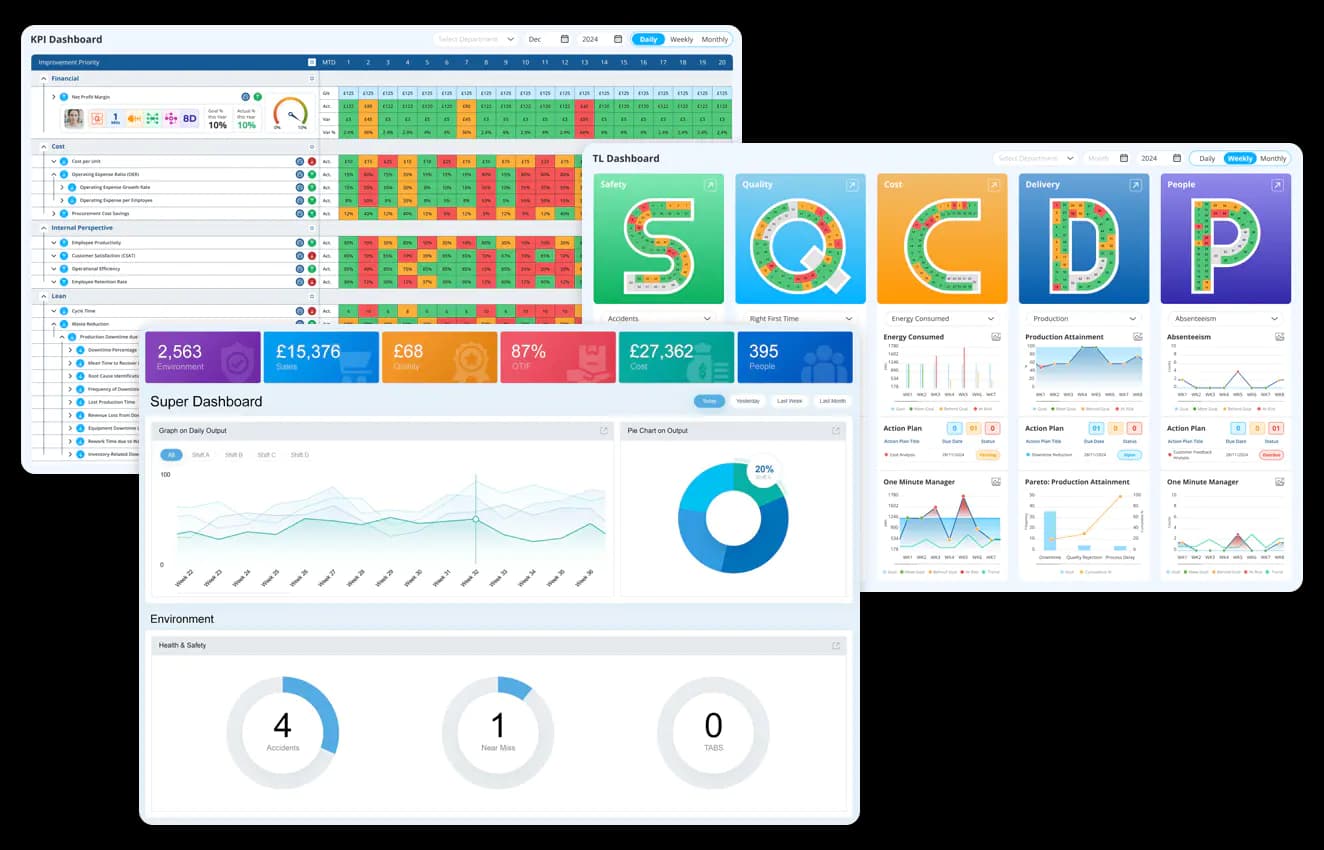
Align teams and strategies effortlessly with Data Point's visual dashboards.
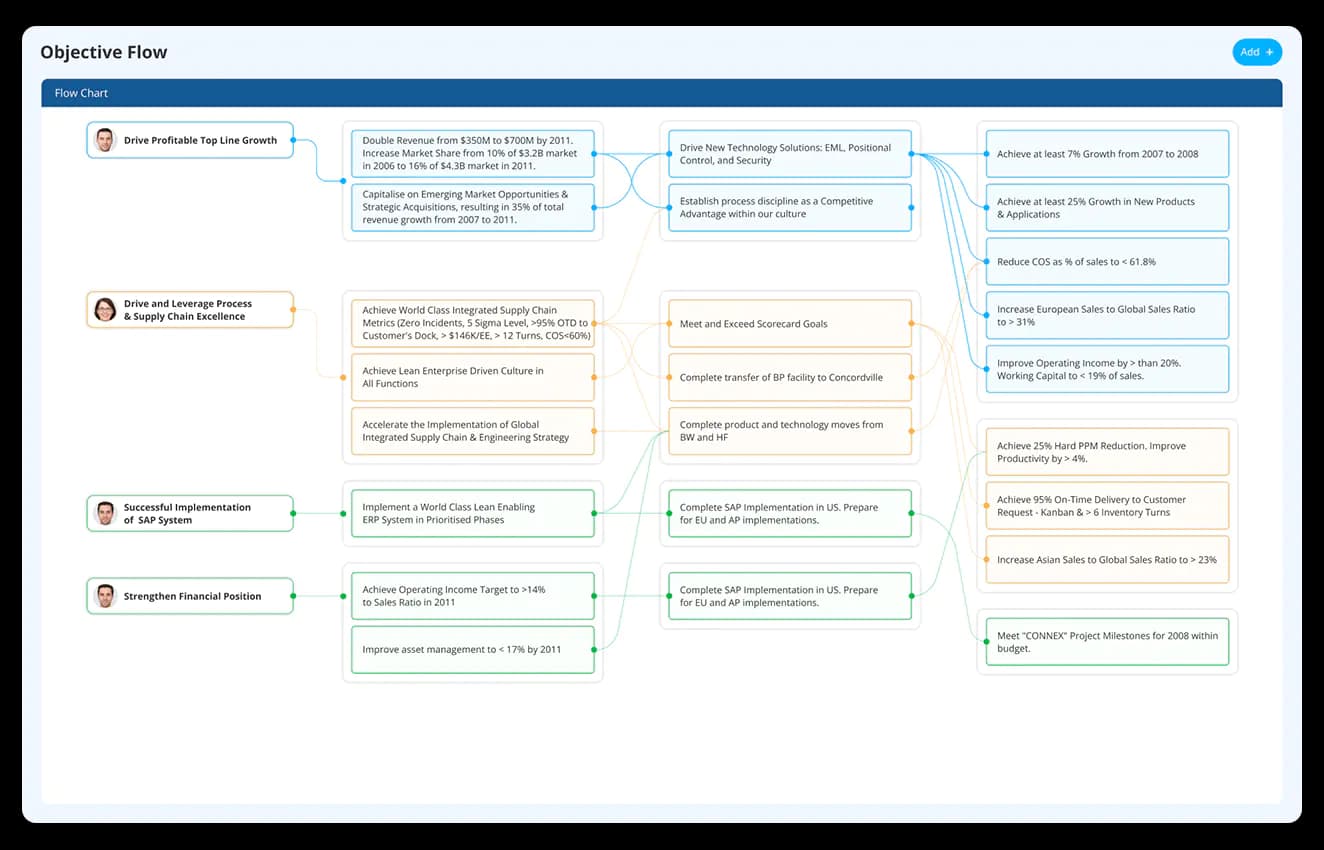
Visualise how your strategic objectives interconnect using an intuitive flow chart. This ensures that every goal contributes to the broader business mission.
- Clear objective hierarchy
- Direct links between goals
- Centralised strategy mapping
Dive deeper into goal alignment with detailed representations of each objective, outlining responsible teams, timelines, and expected outcomes.
- Comprehensive goal breakdown
- Clear accountability and timelines
- Full visibility into progress
- Role clarity

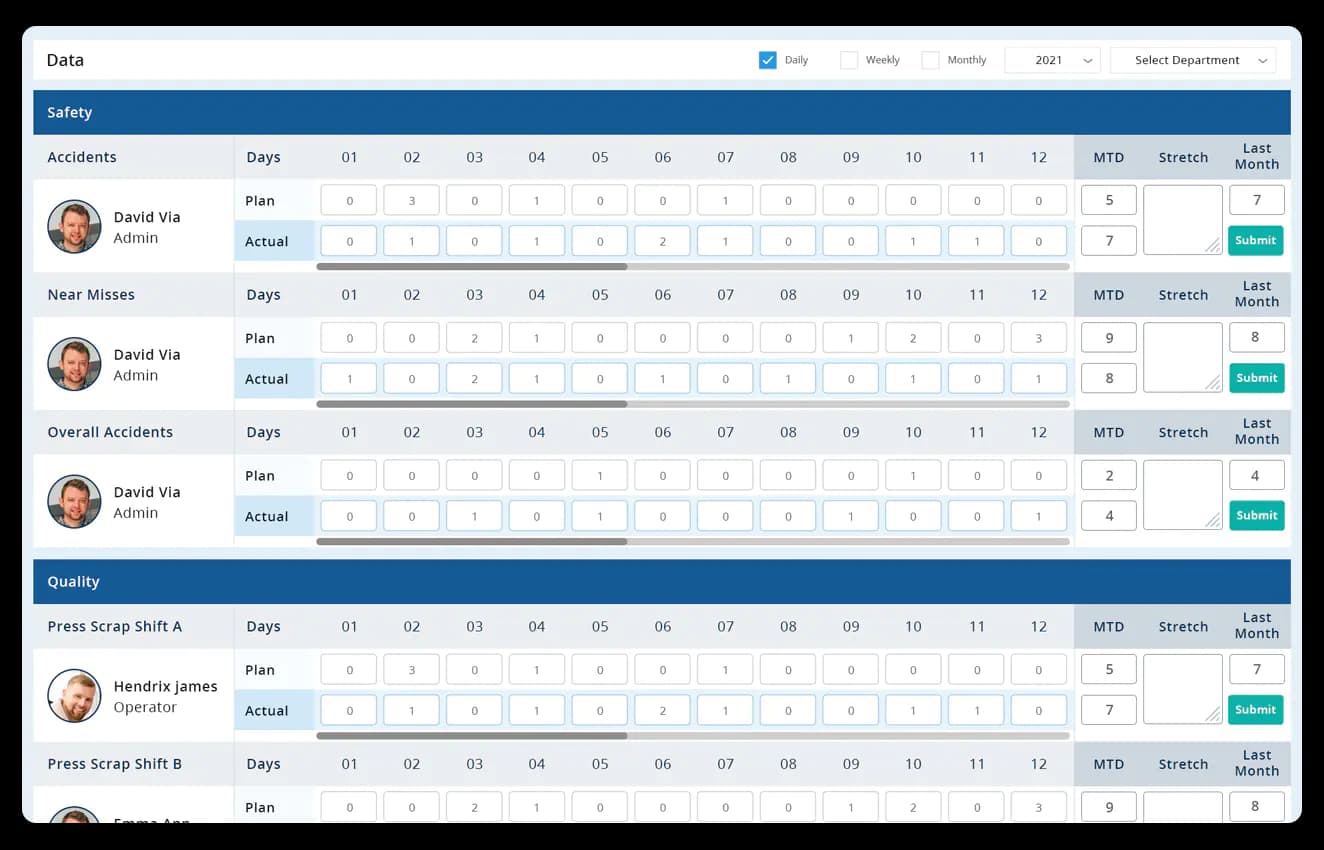
Define Key Performance Indicators (KPIs) that align directly with your strategic goals. Ensure that every team understands how their metrics impact overall success.
- Custom KPI creation and layouts
- Relevant metric assignment
- Role-specific KPI tracking
Data Point monitors Key Performance Indicators (KPIs) to ensure that all teams remain focused, aligned, and driven by measurable results.
- Customised KPI layouts
- Historical and live KPI tracking
- Trend analysis insights
- Early issue detection
- Data-based forecasting
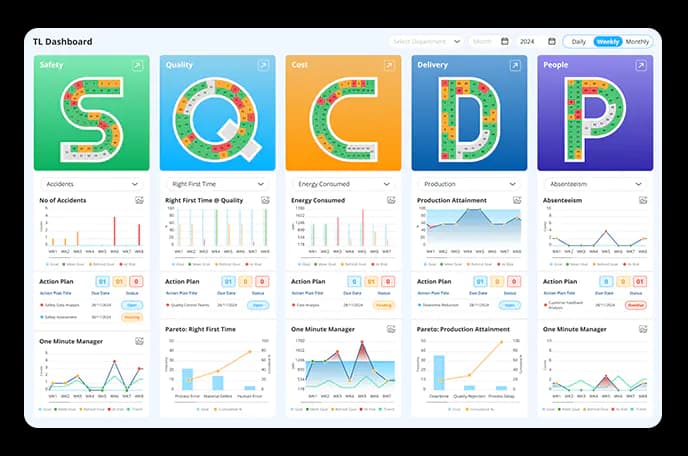
Define, track, and achieve KPIs that matter – all in one platform.
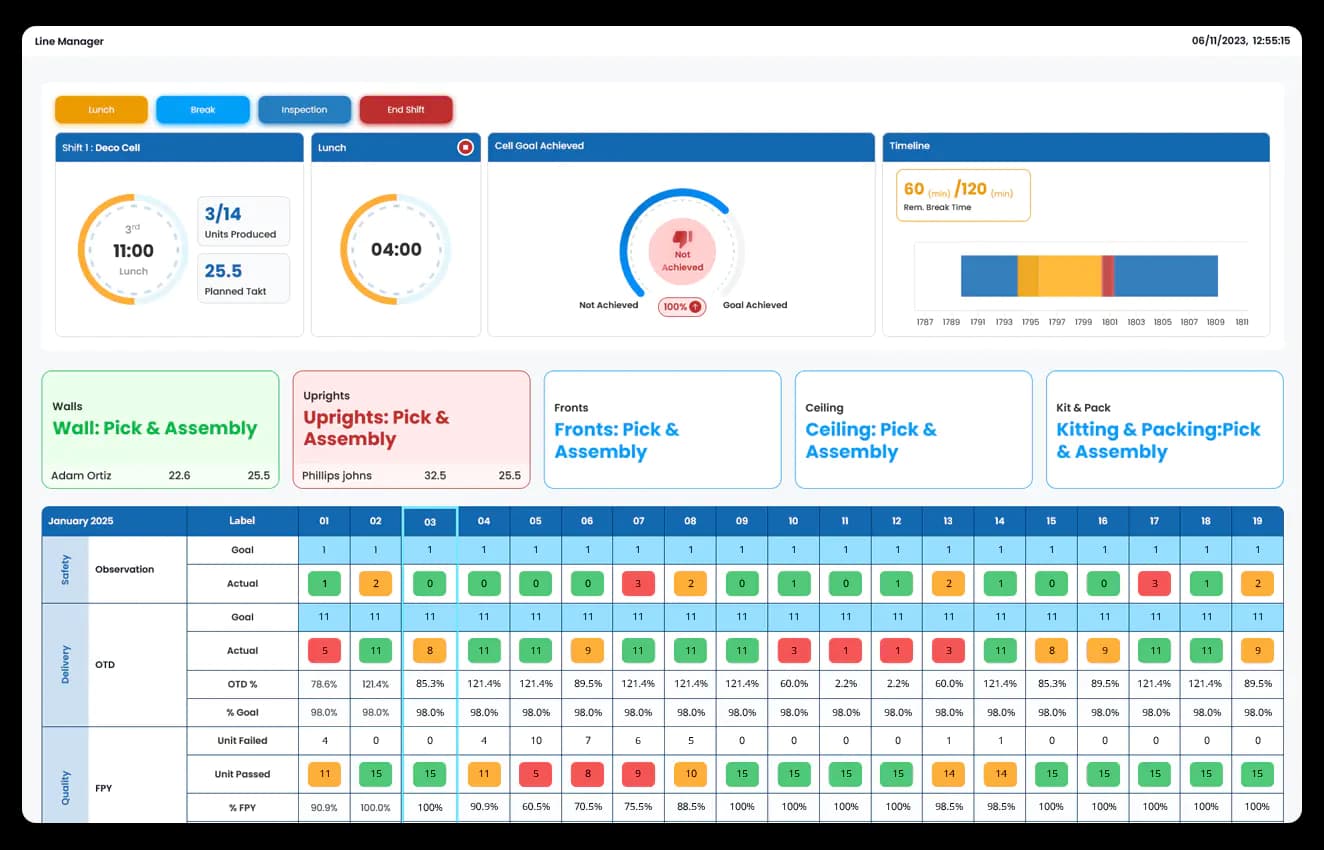
Data Point ensures continuous improvement by effective performance monitoring through real-time updates and actionable insights.
- Live performance tracking
- Instant data refresh
- Automated performance alerts
- Historical performance comparisons
- Data-driven performance evaluations
Resource optimisation features in Data Point ensures consistent resource usage directed toward achieving organisational strategic goals while maintaining operational efficiency.
- Centralised resource visibility
- Resource capacity planning
- Dynamic resource adjustments
- High-priority project support
- Continuous tracking of usage
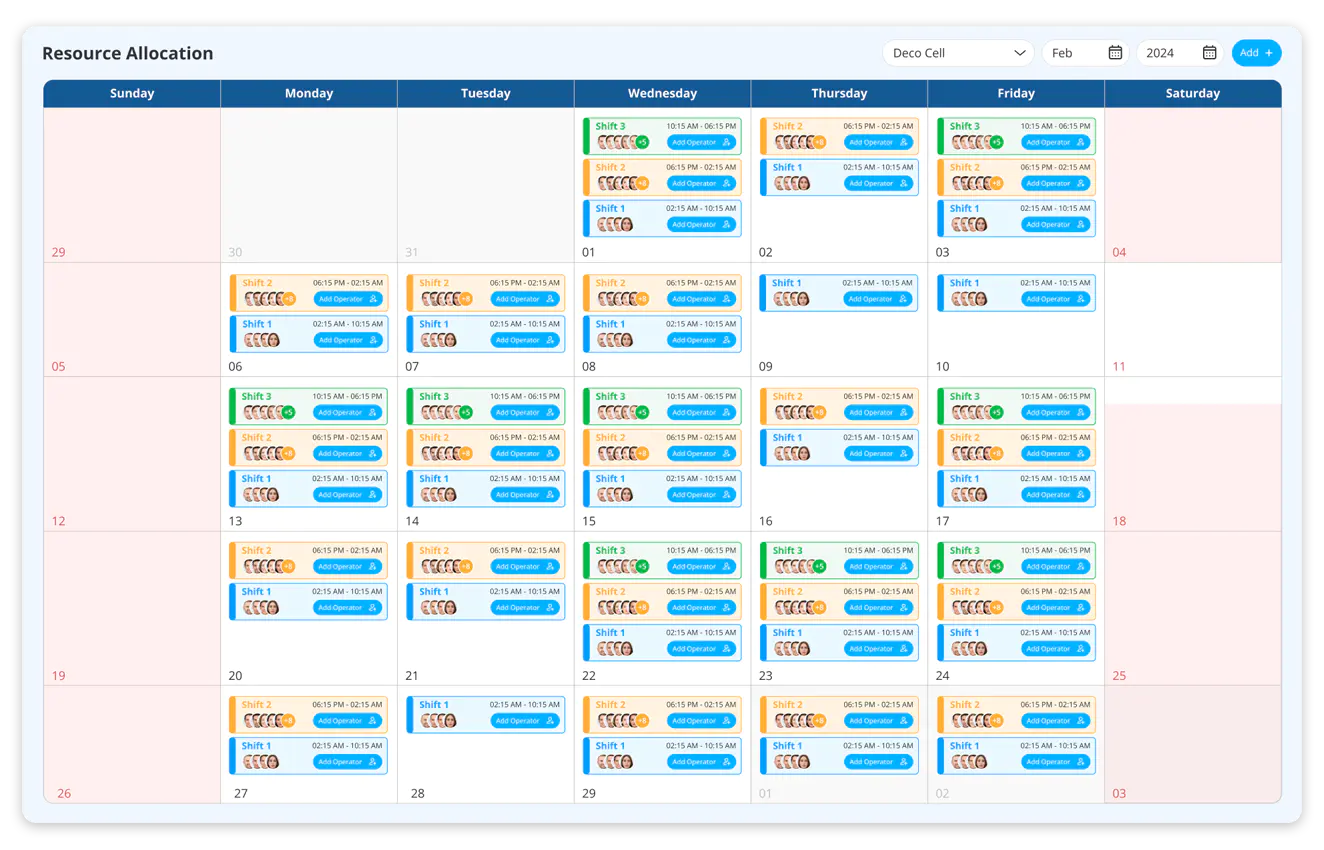
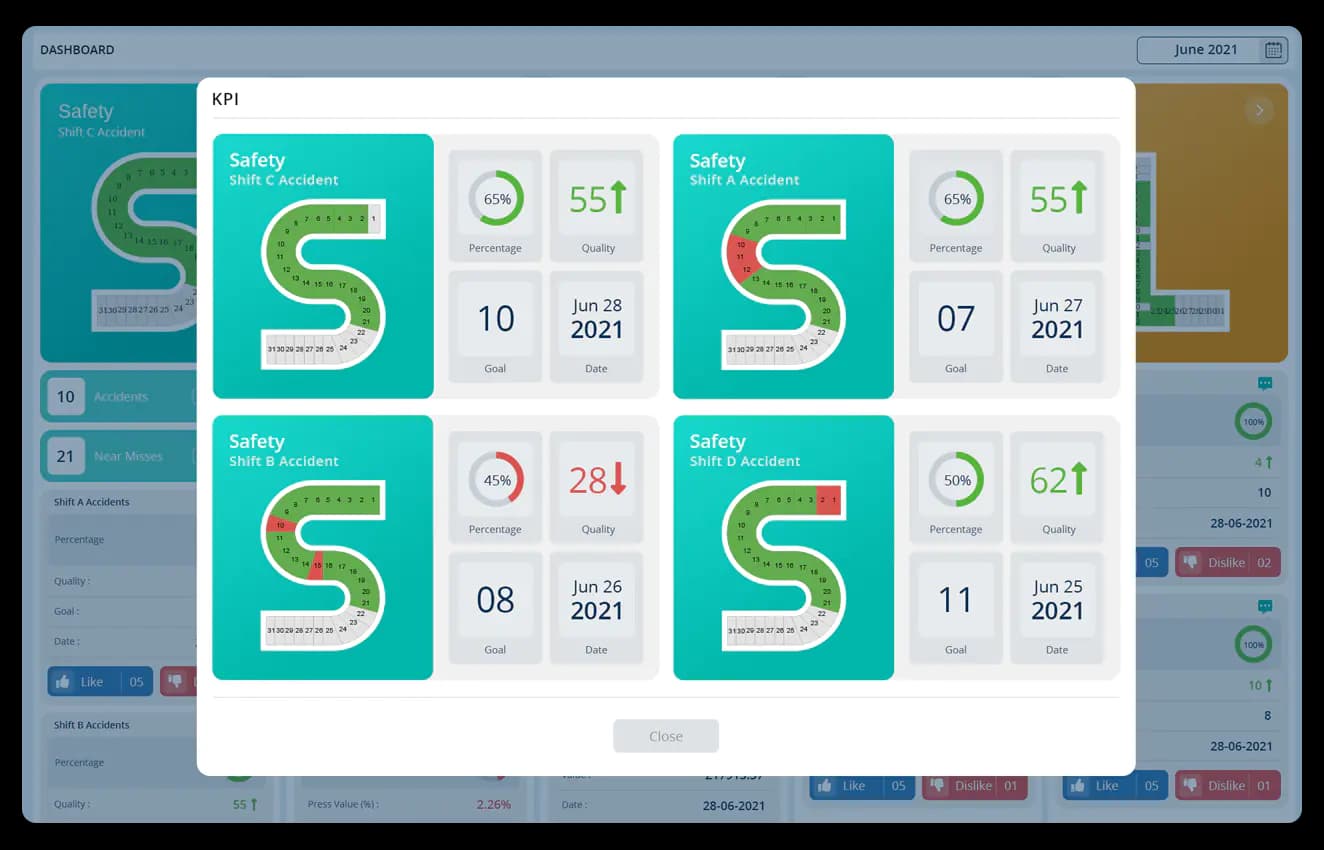
Data Point measures and tracks the results of your strategic initiatives to ensure alignment with your long-term business objectives.
- Consistent review cycle for measuring outcomes
- Customisable outcome reports
- Align results with strategic KPIs
- Drive informed decisions
- Regular feedback loops
Data Point empower your teams with clear strategic alignment.
Choice of industry leaders and Fortune 500 companies


















How can a Balanced Scorecard enable cross-functional collaboration?

Unified strategic vision
Aligns various departments with the strategic goals and key metrics.

Clear communication of priorities
Simplified communication with clarity in team roles and expectations.

Accelerated strategic execution
Quick adjustments or strategies with greater speed and precision.
Ready to align your teams for strategic success? Data Point is your key!
Strategic Alignment Software: The Complete Guide to Connecting Goals, Resources, and Performance
Learn how strategic alignment software helps organisations align objectives, manage resources, track KPIs, measure outcomes, monitor performance, and maintain clear accountability from strategy to execution.
How does a drag-and-drop dashboard builder change who can create a useful strategic view, not just who can consume one?
Most dashboard tools are built by a technical team once and then used, largely unchanged, by everyone else. If a department head needs a different view of the same underlying data, that request usually goes into a queue and waits for whoever manages the reporting tool to build it.
A drag-and-drop builder shifts that capability to the person who actually needs the view. Customisable templates and data views mean a department head can construct a dashboard relevant to their specific objectives without submitting a request and waiting for it to be built by someone else. This matters most in organisations where different teams genuinely need different combinations of the same underlying metrics, since a one-size dashboard forces every team to work around a layout that was designed for someone else's priorities.
How does continuous tracking of resource usage differ from a one-time resource allocation plan set at the start of a project?
A resource plan set at the start of an initiative reflects an estimate made before the work began. It rarely gets revisited unless something goes visibly wrong, which means the gap between planned and actual usage can grow for months without anyone formally checking whether the original allocation still makes sense.
Continuous tracking of resource usage against the plan means the gap is visible throughout, not just discovered at project close. This is what allows a resource reallocation decision to happen while it can still make a difference to the outcome, rather than being made retrospectively as an explanation for why an initiative underperformed.
How do customisable outcome reports support different stakeholders who need to see the same result presented differently?
A board member reviewing the outcome of a strategic initiative needs a different level of detail from an operations manager who was responsible for executing it. A single fixed report format forces one of them to work harder than necessary, either wading through detail they do not need or missing context that would have been useful.
Customisable outcome reports allow the same underlying result to be presented at the level of detail relevant to whoever is reviewing it. This is not about hiding information from either audience. It is about presenting the same verified outcome in a format that matches what each stakeholder needs from the review.
How does connecting objectives, KPIs, and resource planning in one platform support the specific dependencies that Objective Flow Chart and Line-of-Sight tools are built to visualise?
Strategic alignment depends on being able to trace a connection from a high-level objective down to the specific resource and metric supporting it. That connection is only useful if the underlying data behind each layer, the objective, the KPI, and the resource allocated to it, is linked in the same system rather than existing in three separate tools that each show one piece.
This is where the Objective Flow Chart and Line-of-Sight alignment tools become genuinely functional rather than illustrative. The flow chart can show how objectives interconnect because the underlying objective data is shared with the resource planning and outcome measurement features described here. Without that shared foundation, a flow chart is just a diagram, disconnected from whether the resources and outcomes it implies are being tracked.
How does resource capacity planning within a strategic alignment tool prevent the same team being over-committed across multiple initiatives?
When resource allocation decisions are made independently for each strategic initiative, without visibility into what else that team or individual is already committed to, over-commitment happens quietly. Each initiative looks adequately resourced in isolation. The person doing the work is stretched across three initiatives that were each approved without reference to the other two.
Centralised resource visibility means capacity planning happens against the full picture of what a team or individual is already committed to, not just the initiative currently being planned. Dynamic resource adjustments allow allocation to shift as priorities change mid-cycle, and high-priority project support ensures that when something urgent emerges, resource can be pulled toward it deliberately rather than informally, in a way that leaves the deprioritised work invisible until it quietly falls behind.
How does a consistent review cycle for outcome measurement avoid initiatives being marked complete without confirming they worked?
An initiative can be executed exactly as planned and still fail to produce the intended strategic outcome, if the assumption connecting the activity to the outcome was wrong to begin with. Marking an initiative complete based on whether the planned actions were taken, without separately checking whether those actions produced the intended result, misses that distinction entirely.
A consistent review cycle for measuring outcomes checks the actual result against the original strategic KPI the initiative was meant to move, not just whether the activities were completed. Regular feedback loops built into that review cycle mean a gap between planned outcome and actual outcome is fed back into future planning decisions, rather being noted once and forgotten.
How does automated performance alerting change the pace at which strategic drift gets noticed?
Strategic drift, where day-to-day execution slowly moves away from the original strategic intent, rarely announces itself with a single dramatic event. It accumulates gradually, through small decisions that each seem reasonable in isolation, until the cumulative effect is only visible once it has become significant.
Automated performance alerts triggered by live data means a KPI moving outside expected range is flagged as it happens, rather than being noticed only when someone happens to review historical performance comparisons and spots the trend. This shortens the distance between drift beginning and drift being addressed, which is exactly the window where course correction is still relatively low-cost.
How does defining KPIs within the same platform as resource planning keep metric ownership tied to who is accountable for delivering it?
A KPI assigned to a team without visibility into whether that team has the resource capacity to influence it sets up an accountability gap from the outset. The team is being measured against an outcome they may not have been resourced to achieve.
Defining KPIs through the KPI management capability within the same environment where resource allocation is visible means that gap can be checked before a KPI is assigned, not discovered after a review shows the team missed a target it was never realistically resourced to hit. Role-specific KPI tracking then keeps that ownership clear throughout execution, so accountability is tied to someone who has the resource and authority to affect the outcome.
Hear it from our customers

MARC ROBINSON
Director, Global Operational Excellence

“By providing a central location to input, analyse and share our KPIs, 'Data Point' enables site management to more easily focus on the entire business as a team. Its ability to allow automated data entry and trend analysis gives us more time for improvement rather than just reporting numbers. Combined with a disciplined approach within our SQDC meeting process, I believe 'Data Point' will help us continually focus on key issues and drive business excellence in all areas.”
Achieve Strategic Alignment with Data Point
Align your teams and goals with Data Point’s real-time KPI tracking and strategic planning tools.