Map and Connect Organisational Goals with Objective Flow Chart
Network, communicate and lead people towards your organisational objectives.
Objective Flow Charts can streamline your strategic alignment
Layout the objectives and processes visually to create a seamless connection between strategic objectives and operational activities. Ensure every task or decision is tied to broader strategic priorities to make the process smoother and more aligned.


Data Point enables users to explore processes at multiple levels by enabling them to click through different elements of the process. Integrates directly with live data sources to adjust the flow. As data changes, the flow chart adapts, providing real-time insights.
Map your Strategies with Data Point Objective Flow Chart!
Automatically update in real-time based on changes in data for quick adjustments of strategies. Allow users to simulate different scenarios to predict how processes might behave under varying conditions.


Data points present organisational objectives in a visually engaging manner, offering a clear roadmap for employees to follow. Aligning the objectives in an easily understandable manner creates a seamless execution framework.
Pre-built frameworks designed to fit specific business processes, industries, or project goals reduce the time spent creating flow charts from scratch. Ensure standardisation of processes and faster project initiation.
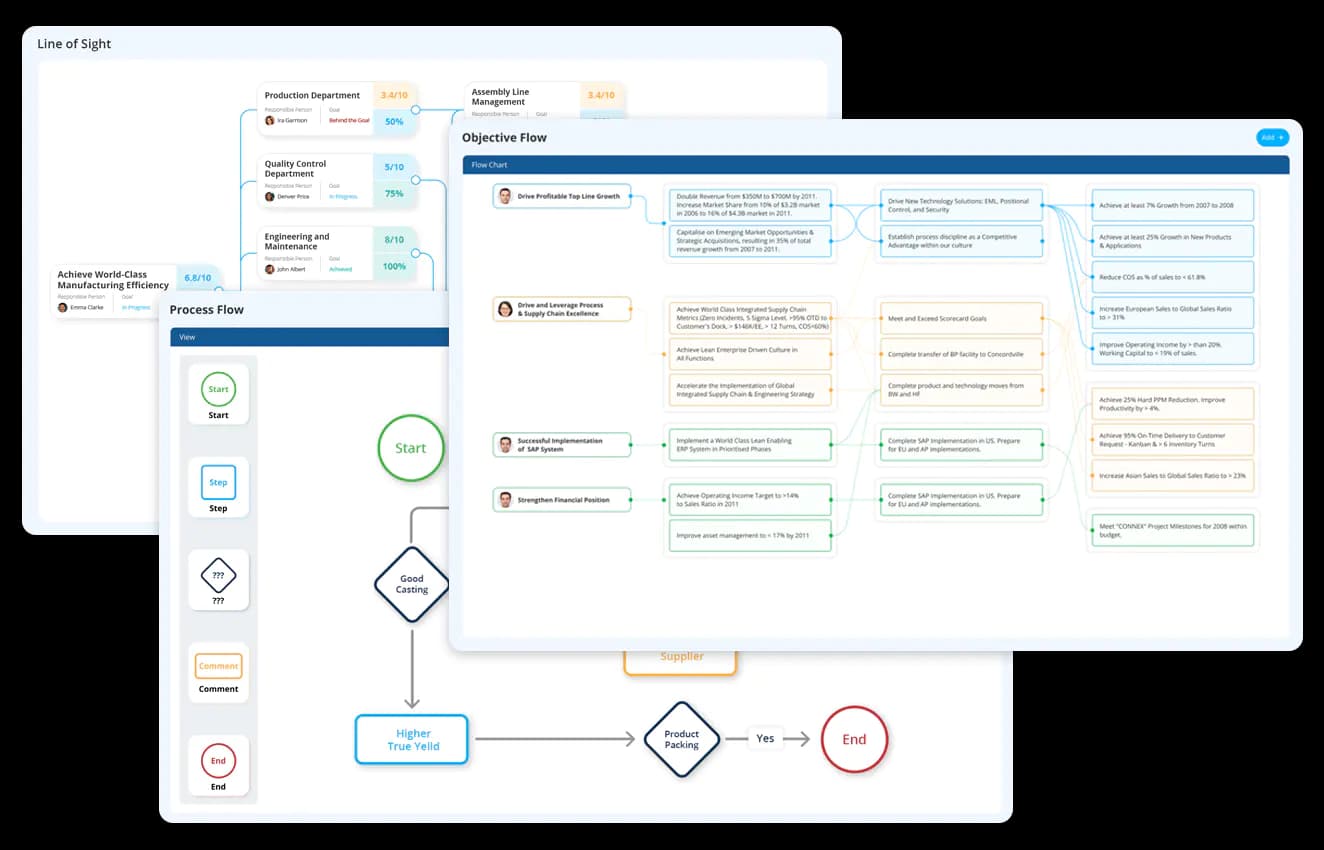
Explore how Data Point brings clarity to your objectives!
Choice of industry leaders and Fortune 500 companies


















How can Data Point streamline strategic alignment with Objective Flow Chart?
Data Point enhances strategic alignment by visually mapping out organisational goals effectively by process automation, combining real-time data tracking and collaborative management.

Clear goal definition
Visually defines organisational goals and breaks them into actionable steps.

Consistent communication
Organise strategic goals into a unified framework that teams can easily interpret.

Performance monitoring and adjustment
Tracks logical progression toward an objective
Discover how Data Point powered flow charts can streamline your goal setting
Objective Flow Chart: The Complete Guide to Visualising Goals, Dependencies and Strategic Alignment
Learn how Objective Flow Chart software helps organisations map goals, connect strategic objectives, integrate live data, simulate scenarios, and improve alignment across teams and processes.
How does a click-through, multi-level flowchart differ from a single static diagram of organisational objectives?
A static objective diagram, typically a single slide or page, forces every level of detail onto one view. Zoom out enough to fit the whole organisation's objectives and the detail at any single objective becomes too small to be useful. Zoom in far enough to show the detail and the broader structure disappears.
An interactive flowchart that supports clicking through different elements avoids that trade-off entirely. A viewer starts at the top-level structure and moves into a specific objective's detail only when they need to, without the diagram needing to compromise between overview and depth. This matters for organisations with genuinely complex, multi-tier objective structures, where the line-of-sight between a board-level goal and a team-level task needs to be traceable without collapsing into an unreadable single diagram.
How does process simulation within an objective flowchart support decision-making before a change is committed?
Changing how objectives connect, or how a process feeding into them is structured, carries risk if the only way to find out whether the change works is to implement it and observe the outcome. By the time a poor decision becomes visible in the data, the cost of reversing it has already been incurred.
Simulating different scenarios within the flowchart lets a team see how a process might behave under varying conditions before that change is made. This is particularly valuable when a proposed change to one part of the objective structure has unclear downstream effects on the objectives connected to it. Testing the scenario in the flowchart first surfaces those effects without the organisational cost of testing them live.
How does integration with ERP and MES systems keep an objective flowchart accurate without manual updates?
An objective flowchart that relies on someone manually updating it whenever underlying operational data changes will drift out of accuracy the moment that person is busy, on leave, or simply forgets. The chart's usefulness depends entirely on it reflecting current reality, and manual maintenance is not a reliable way to guarantee that.
Integrating with ERP and MES systems means the flowchart reflects accurate information sourced directly from the systems already recording operational activity. This removes the dependency on manual updates entirely for the data points that are already being captured elsewhere, in the same way production planning draws on live MES and ERP data rather than a manually maintained schedule.
How quickly can an objective flowchart actually be updated as strategy changes, and why does that speed matter?
Strategy rarely stays completely static for a full year. Priorities shift, a new objective is added, an existing one is reprioritised or dropped. If updating the documentation that reflects those changes is a slow, multi-step process, the flowchart becomes outdated faster than it can be corrected, and teams start working from a document that no longer matches the actual current strategy.
Modifications that can be made in a few clicks mean the flowchart can be kept current as fast as the strategy itself changes. This is what keeps the tool trustworthy over time. A flowchart that lags strategic changes for weeks at a time is worse than no flowchart at all, since it actively communicates an outdated picture with the same confidence as an accurate one.
How does live data integration change what a flowchart is showing you at any given moment?
A flowchart built once to represent a process, or a set of dependencies is a plan. It shows how objectives were understood to relate to each other at the point the diagram was drawn. It says nothing about whether that relationship still holds or whether the underlying data has since moved.
Integrating live data sources means the flowchart adapts as the data changes, rather than requiring someone to manually redraw it each time. This is the distinction between a flowchart as documentation and a flowchart as a monitoring tool. The second version tells you something current. The first only tells you what was true when it was made.
How do customisable templates by industry or process reduce the setup time for a new objective structure?
Building an objective flowchart from a blank canvas each time a new initiative or department needs one means re-deriving a structure that, in practice, follows recognisable patterns across similar processes or industries. That repeated effort adds time to project initiation without adding any real value, since the underlying structure is rarely unique.
Pre-built templates designed to fit specific business processes, industries, or project goals remove that repeated effort. A team starting a new initiative begins from a structure already suited to their context rather than building the logical flow from first principles. This also supports standardisation across an organisation, since teams using the same template category are working from a consistent structural approach rather than each inventing their own.
How does an objective flowchart support faster decision-making compared to reviewing objectives through a written report?
A written report describing progress against several interconnected objectives requires the reader to hold the relationships between those objectives in their head while reading, since text is not well suited to representing multiple simultaneous dependencies clearly.
Because processes and dependencies are represented visually rather than described in prose, a team leader can see the current state of progress and the connections between objectives briefly. This is what allows a quicker, better-informed decision. The visual format removes the cognitive step of translating a written description into a mental map, since the map is already what is on screen.
How does keeping team members informed of flowchart changes support alignment when strategy shifts mid-cycle?
A strategic change made at leadership level does not automatically reach every team member who needs to adjust their work in response. Communication of that change often happens through separate channels, email, a meeting, a memo, which introduces delay and inconsistency in who receives the update and when.
When updates to the objective flowchart keep all team members informed of changes as they happen, the communication of a strategic shift and the documentation of that shift happen simultaneously. This is the same accountability gap that KPI action plans are designed to close at the task level, applied here at the level of the broader objective structure that those action plans ultimately support.
Hear it from our customers

MARC ROBINSON
Director, Global Operational Excellence


“By providing a central location to input, analyse and share our KPIs, 'Data Point' enables site management to more easily focus on the entire business as a team. Its ability to allow automated data entry and trend analysis gives us more time for improvement rather than just reporting numbers. Combined with a disciplined approach within our SQDC meeting process, I believe 'Data Point' will help us continually focus on key issues and drive business excellence in all areas.”
Transform strategies into action with Data Point
Visualise, track, and adapt your organisational goals in real-time with Data Point’s interactive Objective Flow Charts.
