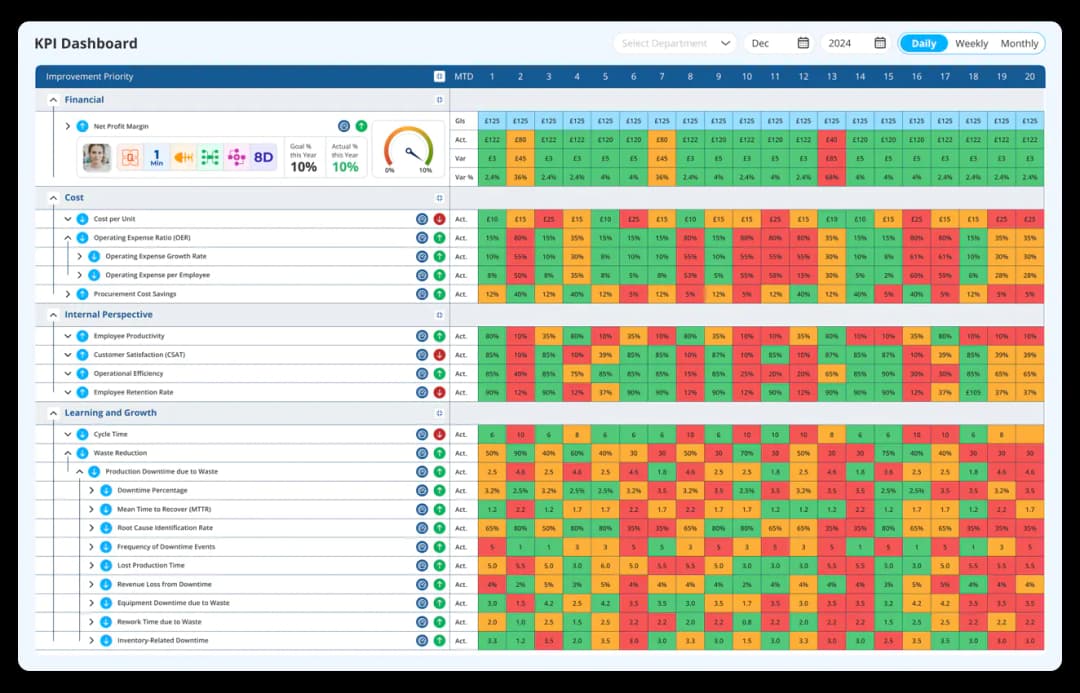
Empower your team with data-driven KPI Action Plans
Implement, use, and adopt Key Performance Indicators with customisable action plans to quickly act before incidents become critical.
Transform underperforming KPIs into success stories
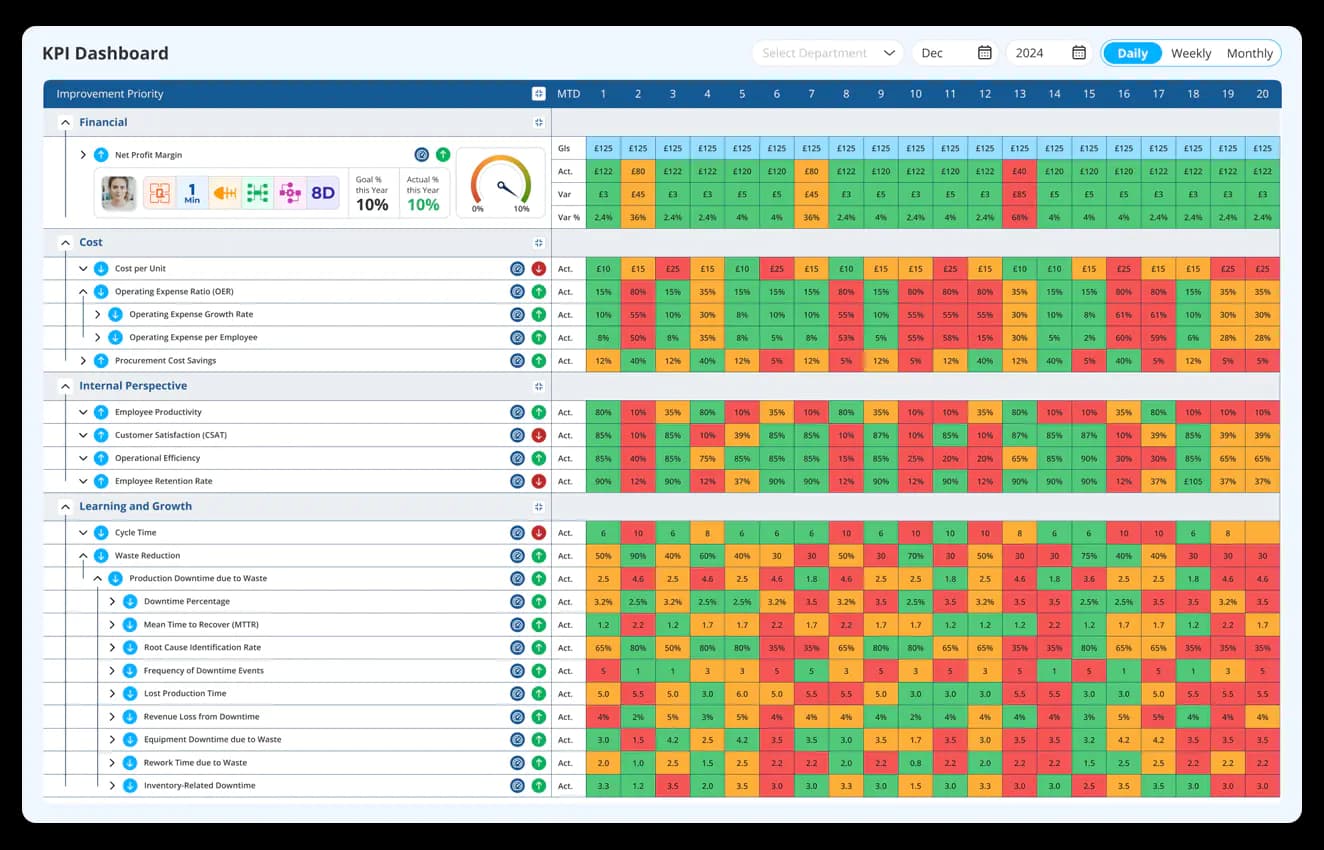
Visually compare actual performance against targets to drive aligned progress.
- Visualise the alignment of current performance
- Highlight targets
- Ensure cohesive progress
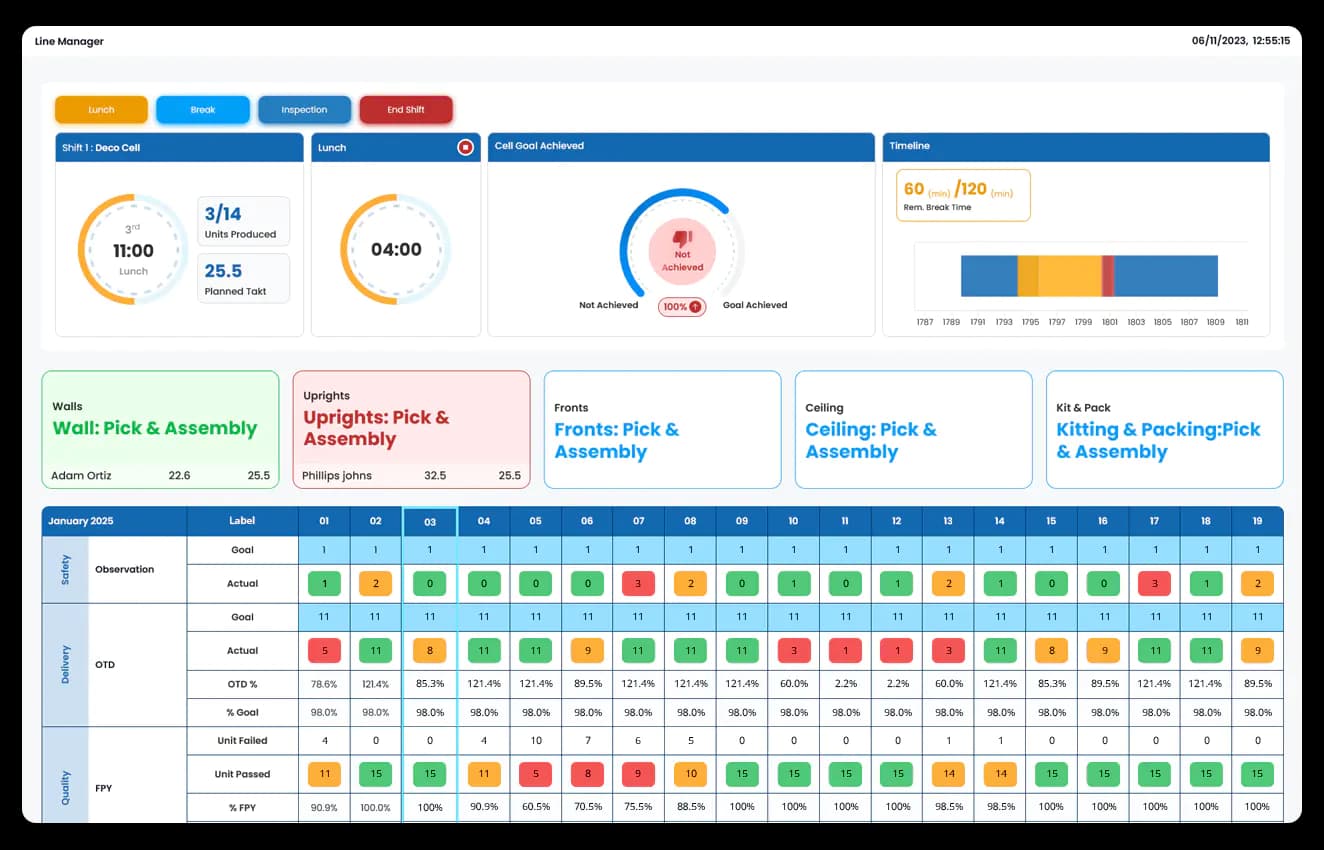
Analyse real-time results to adjust strategies and refine processes continuously.
- Compare actual results with targets
- Adjust strategies and processes based on real-time evaluation
- Incorporate feedback and results to refine the action plan
Refine your KPIs with actionable insights
Create structured improvement strategies for underperforming KPIs with tailored action plans.
- Structured solutions for underperforming KPIs
- Formulate effective strategies for improvement
- Customised plans
- Performance validation
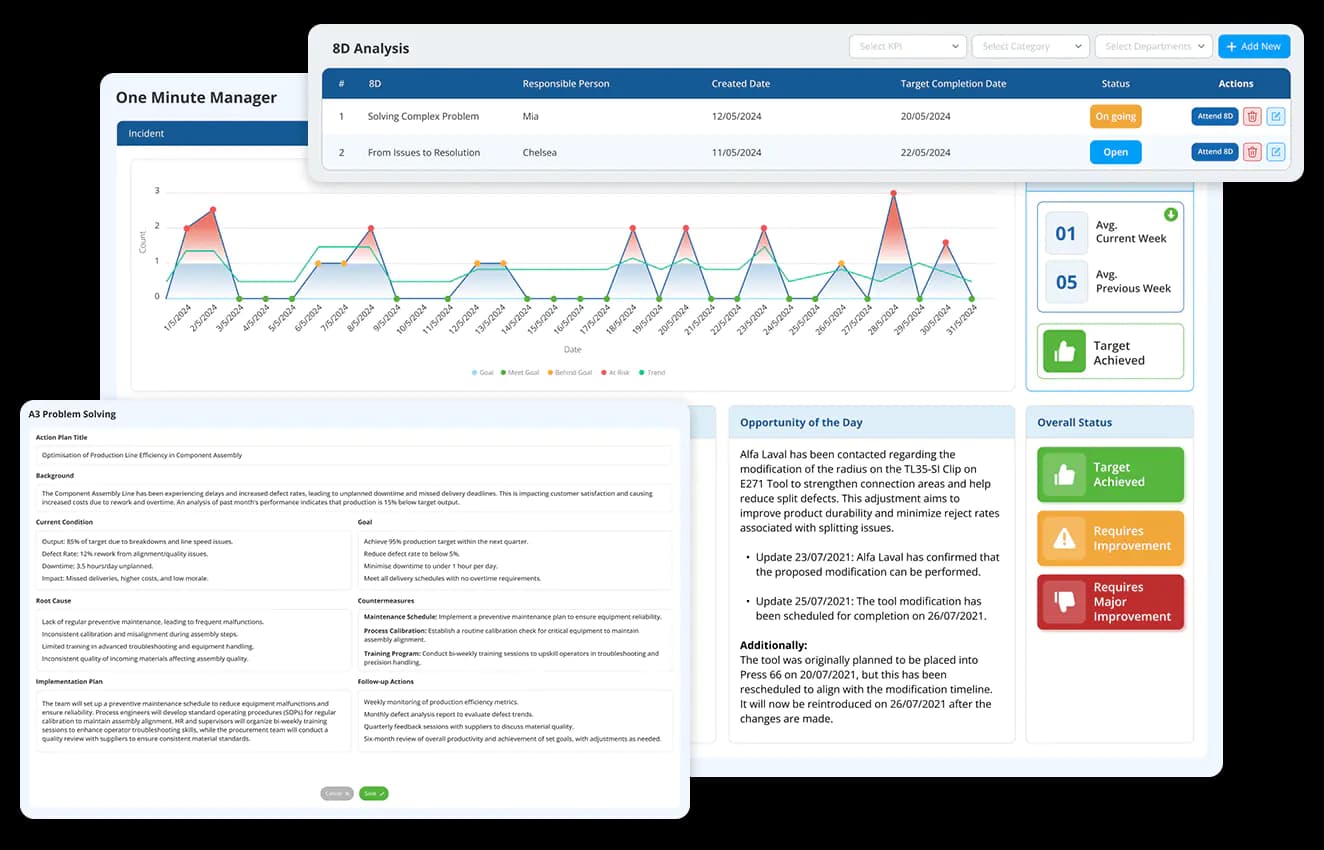
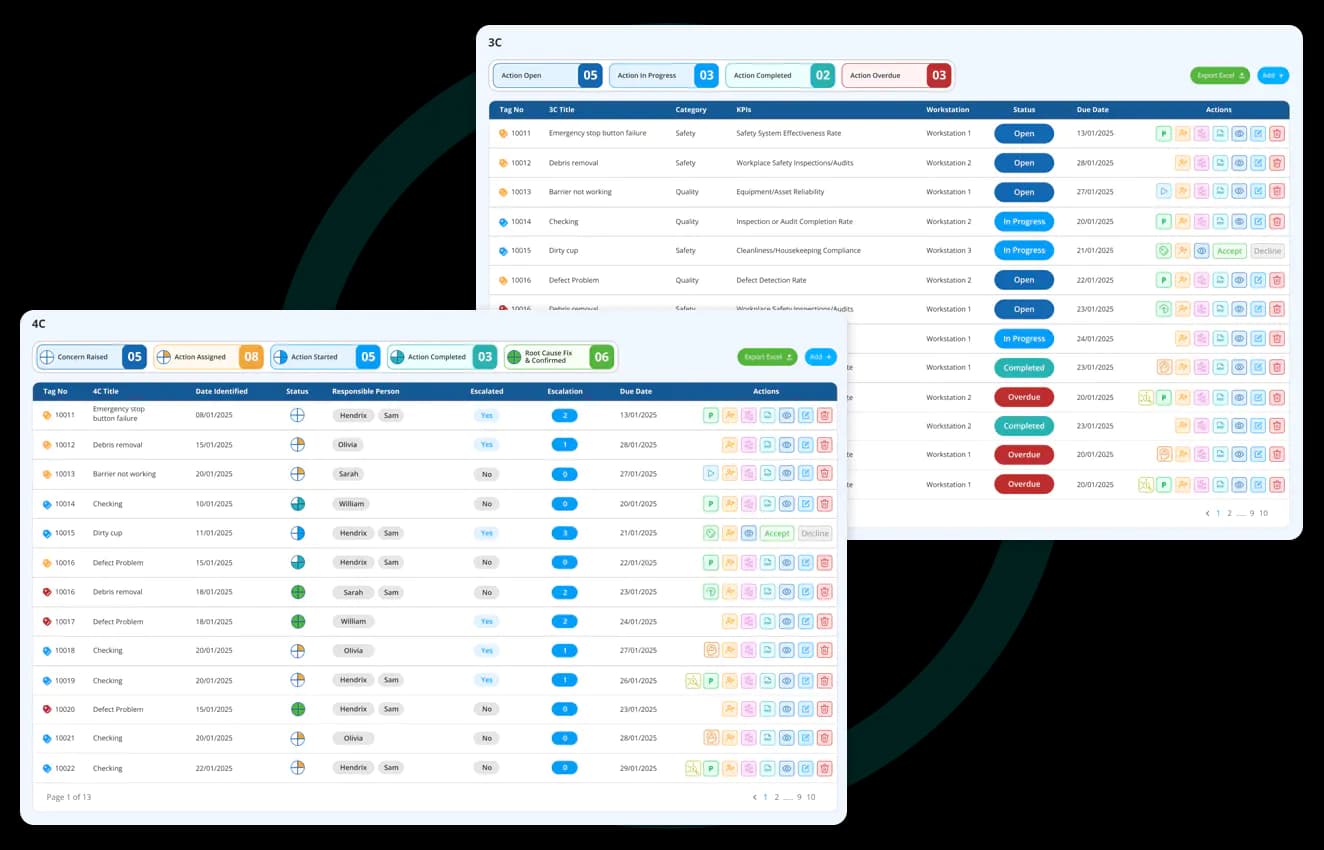
Apply proven frameworks to systematically address concerns and implement corrective actions.
- Structured problem-solving frameworks.
- Definitive checklist of tasks.
- Concerns, causes, countermeasures, and corrective actions to address performance gaps.
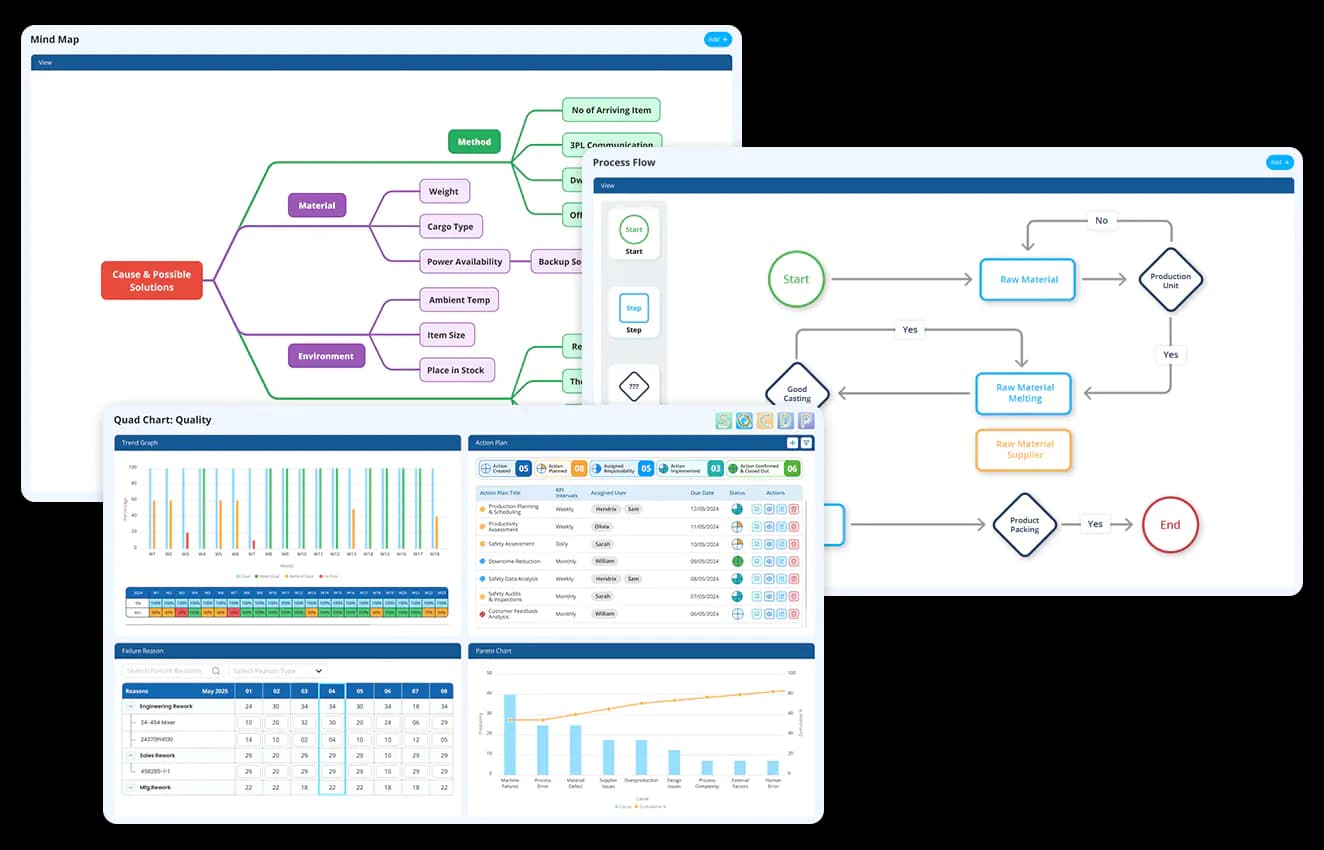
Use powerful visual tools to uncover root causes and streamline process improvements.
- Interactive Quad charts and bar charts
- Process flow diagrams to identify inefficiencies
- Pareto graphs and Fishbone diagrams
Simplify your KPI action plans and drive measurable success - Get Data Point today!
Choice of industry leaders and Fortune 500 companies


















How Data Point tackle the root causes of KPI failures?

Advanced data analytics
Uncovers discrepancies and highlights attention required areas.

Actionable insights for targeted solutions
Offers actionable insights and recommended actions.

Comprehensive data visualisation
Spot performance gaps contributing to KPI failures.
Create strategies to effectively address KPI shortfalls!
Data-Driven KPI Action Plans for Faster Problem Resolution
Learn how KPI Action Plan software helps teams identify performance gaps, choose the right problem-solving method, analyse root causes, assign corrective actions, validate results, and close KPI issues faster.
What is the practical difference between a Simple action plan, a 3C plan, and a 4C plan, and how do you choose which to use?
Not every underperforming KPI needs the same depth of investigation. A minor, one-off deviation with an obvious cause does not warrant the same structured process as a recurring, complex failure with an unclear origin. Applying the same heavy framework to every KPI gap wastes time on simple issues and under-investigates complex ones.
A Simple action plan suits a straightforward gap where the cause is already known and only an owner and deadline are needed. The 3C and 4C problem solving frameworks introduce progressively more structure around identifying concerns, confirming causes, and defining countermeasures and corrective actions, offering more rigour for KPI gaps that are recurring or where the cause is not yet clear. Choosing the right level of structure for the specific KPI gap is what keeps the process proportionate rather than either too light or unnecessarily heavy for what the situation needs.
How does the evaluate-and-adjust step keep an action plan from becoming a fixed document that gets executed regardless of whether it is still working?
Most action plans are built once, based on the best understanding available at the time, and then executed as originally written. If the corrective action is not producing the expected improvement, that gap between plan and result often does not surface until a scheduled review, well after the plan should have been adjusted.
Comparing actual results against targets in real time and incorporating that feedback into the plan as it runs, means the plan can be adjusted mid-course rather than only at a formal checkpoint. This distinguishes an action plan that stays responsive from one that is simply followed to completion regardless of whether the early results suggest it is working.
How do comprehensive analysis tools bundled into the action planning process reduce the time between spotting a KPI failure and understanding its cause?
investigating a KPI failure typically requires moving between several different types of analysis: a visual comparison of performance over time, a breakdown of failure reasons by frequency, a Pareto ranking of the most significant causes, and a structured map of contributing factors. If each of these lives in a separate tool, the investigation is slowed by the need to move between them.
Having interactive Quad Charts, Pareto graphs, fishbone diagrams, and process flow diagrams available directly within the action planning workflow means a team investigating a KPI failure has every relevant analysis tool in the same environment where the action plan itself is being built. This is what shortens the gap between noticing a KPI has failed and having enough structured evidence to commit to a specific countermeasure.
how does building an action plan directly from a KPI failure differ from investigating the failure separately and then deciding what to do?
Investigating a KPI failure and building the response to it as two separate steps, in two separate tools, introduces a handoff point where context can be lost. The person or team doing the investigation may not be the same person building the action plan, and details from the investigation do not always transfer completely into the plan that follows.
Advanced data analytics that uncover discrepancies and highlight where attention is required feed directly into the action plan being built, rather than existing as a separate diagnostic step disconnected from the response. This is the same closed-loop principle behind 8D problem solving, where the investigation and the corrective action stay linked rather than being handed off between separate tools or teams.
How does a goal-actual target display change the way a team engages with a KPI gap compared to a number on its own?
A KPI reported as a single figure tells you the current state. It does not immediately show how far that figure is from where it needs to be, or whether the direction of travel is closing the gap or widening it. That context must be mentally reconstructed by whoever is looking at the number.
Visualising the goal and the actual side by side removes that reconstruction step. The gap is visible immediately, and cohesive progress toward the target becomes something the team can track a glance rather than something they calculate each time they check. This is what keeps a KPI gap visible as an ongoing concern rather than something that only registers when someone specifically stops to compare the two figures.
How does developing countermeasures with built-in performance validation differ from implementing a fix and assuming it worked?
A corrective action implemented without a defined validation step is often assumed to have worked simply because it was completed. The team executed the plan, the task is marked done, and the underlying assumption is that the KPI will now improve, without a specific check confirming that it has.
Performance validation makes that check an explicit part of the countermeasure rather than an assumption. The plan does not close until the KPI has moved in the expected direction, not just until the corrective activity has been carried out. This is the same principle behind CAPA verification, applied here at the individual KPI level rather than across a broader quality investigation.
How does structured problem-solving with a definitive checklist of tasks prevent an action plan from stalling partway through execution?
An action plan described only in narrative form, a paragraph explaining what needs to happen, leaves room for ambiguity about exactly what has and has not been completed. Partial progress can look complete if nobody is checking each specific task against a defined list.
A definitive checklist tied to the concerns, causes, countermeasures, and corrective actions in a 3C, or 4C plan removes that ambiguity. Each task either has been completed and verified, or it has not. This structure is what prevents an action plan from being reported as progressing when, in practice, only the easier or more visible tasks have been addressed.
How does the speed of building and launching an action plan affect whether a KPI gap gets addressed while it still matters?
A KPI failure identified today loses less value if the response begins today than if the response is built over a period of days or weeks while the underperformance continues unaddressed. The cost of a delayed response compounds the longer the gap between identifying the failure and beginning corrective action.
Building and implementing an action plan within hours of a KPI failure being flagged, rather than over a multi-day planning cycle, keeps the response timeline proportionate to how quickly the underlying problem is costing the organisation. This is particularly relevant for KPIs tied to daily production or delivery targets, where a root cause analysis that takes a week to complete has already let a week of underperformance accumulate before any countermeasure begins.
Hear it from our customers

MARC ROBINSON
Director, Global Operational Excellence


“By providing a central location to input, analyse and share our KPIs, 'Data Point' enables site management to more easily focus on the entire business as a team. Its ability to allow automated data entry and trend analysis gives us more time for improvement rather than just reporting numbers. Combined with a disciplined approach within our SQDC meeting process, I believe 'Data Point' will help us continually focus on key issues and drive business excellence in all areas.”


Turn your KPI Insights into actions with Data Point
Unlock real-time insights, build action plans, and turn your KPIs into measurable success with Data Point.