2026 Organisational Strategy Kit by LTS Data Point: Drive Innovation and Results
Last updated on : January 8, 2026
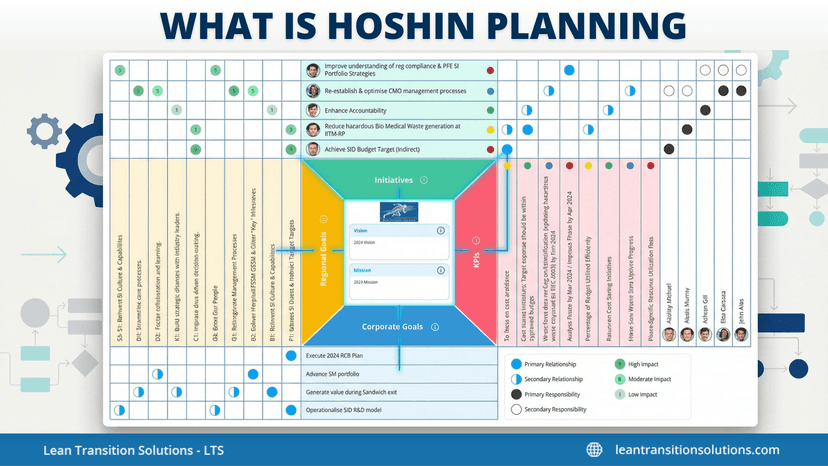
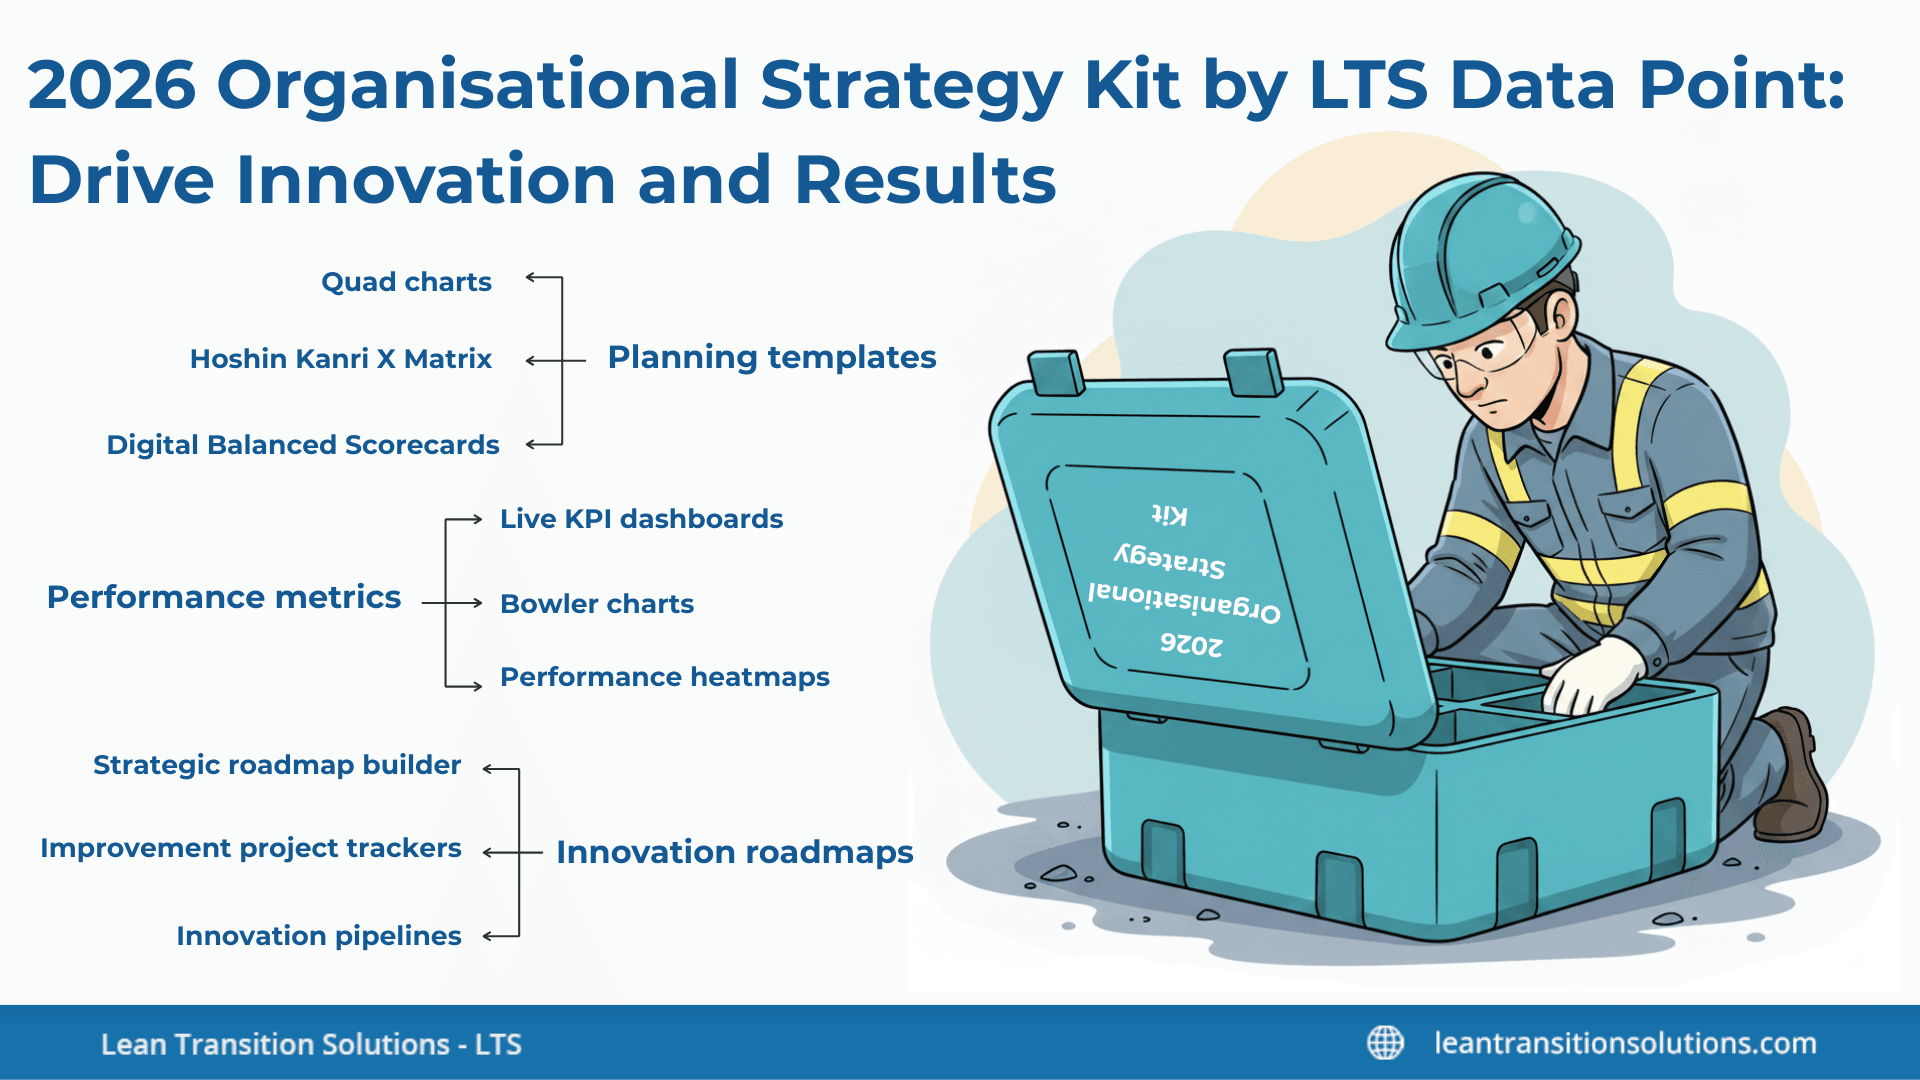
Want to stay ahead in 2026? The Strategy Kit from LTS Data Point makes planning easy and effective. Inside, you’ll find practical tools like planning templates, performance metrics, and innovation roadmaps – everything you need to turn ideas into action. Whether you’re managing change or driving growth, this kit helps you keep your strategy clear, focused, and on track. In this blog, we’ll walk you through how the LTS Data Point Strategy Kit works, who it’s for, and why it’s the smart choice for any organisation looking to succeed. This kit brings together tools for everything from strategic planning to execution, along with proven methods and techniques to help you use them effectively.
Want to experience all the tools in real?
What’s inside the LTS Data Point strategy kit?
A makeup kit includes basic categories like eye makeup, face products, and lip products – surface-level categorisation. But this surface-level categorisation fails to deliver the desired answers to your questions, right?
Similarly, the LTS Data Point strategy kit includes practical tools like planning templates, performance metrics, and innovation roadmaps. But this is again, a general categorisation and it’s obvious you have numerous unanswered questions related to these umbrella categories.
How about we see what’s in this strategy kit that makes you an exceptional leader?
Planning templates
Planning templates are those tools that assist industries design, structure, and communicate strategic plans with clarity, alignment, and measurable execution.
Digital Balanced Scorecard (BSC) is an organised framework that arranges strategic objectives across Financial, Customer, Internal processes, and Learning and growth perspectives.
Key features:
- Customisable scorecard layouts
- Automated KPI updates
- Objective-metric-initiatives linkage
- Live status indicators and variance alerts
LTS Data Point version:
- Offers ready-made or digital Balanced Scorecard frameworks that guide users in defining goals, Key Performance Indicators (KPIs), targets, and initiatives.
- Connects each objective to quantifiable indicators so that strategy isn’t just recorded – it's traceable.
- Supports drilldown from high-level aims to department-level scorecards, assuring alignment.
- Shows KPIs in real-time dashboards, updating automatically with integrated data sources.
2. Hoshin Kanri X Matrix
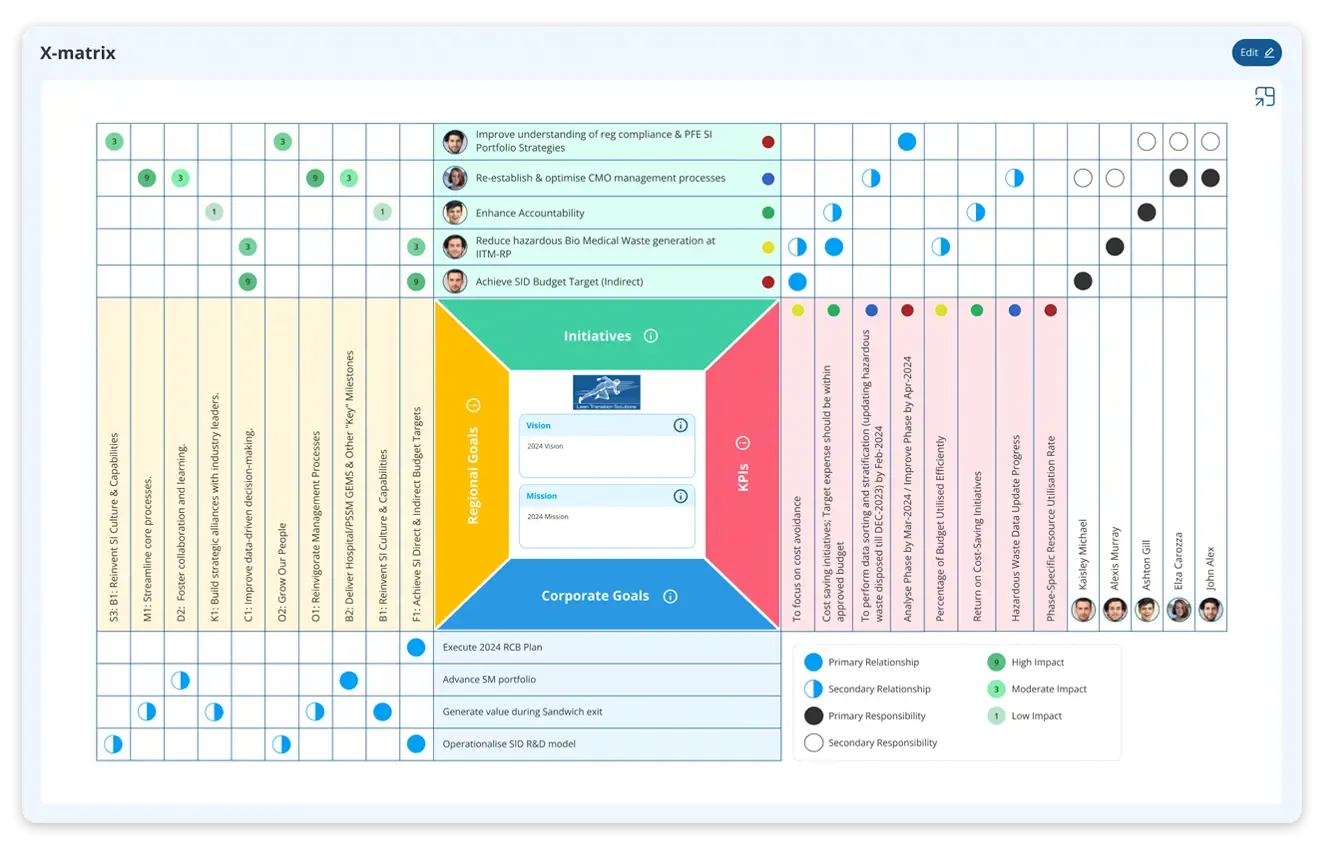
Hoshin Kanri X Matrix is a strategic planning system that links long-term breakthrough goals to annual tasks and the daily actions required to achieve them.
Key features:
- Digital X Matrix with relationship mapping
- Full strategy-to-execution linkage
- Owner assignment and responsibility monitoring
- Progress dashboards connected to KPIs
LTS Data Point version:
- Provides a digital X Matrix that displays targets, calculations, owners, and interdependencies in one view.
- Enables cascading of organisational priorities down to departments, teams, and individual roles.
- Secures visibility of who owns what, lowering ambiguity and enhancing accountability.
- Monitors progress against each element of the X Matrix with automated performance updates.
Download your free Hoshin Kanri X Matrix template
3. Strategy maps
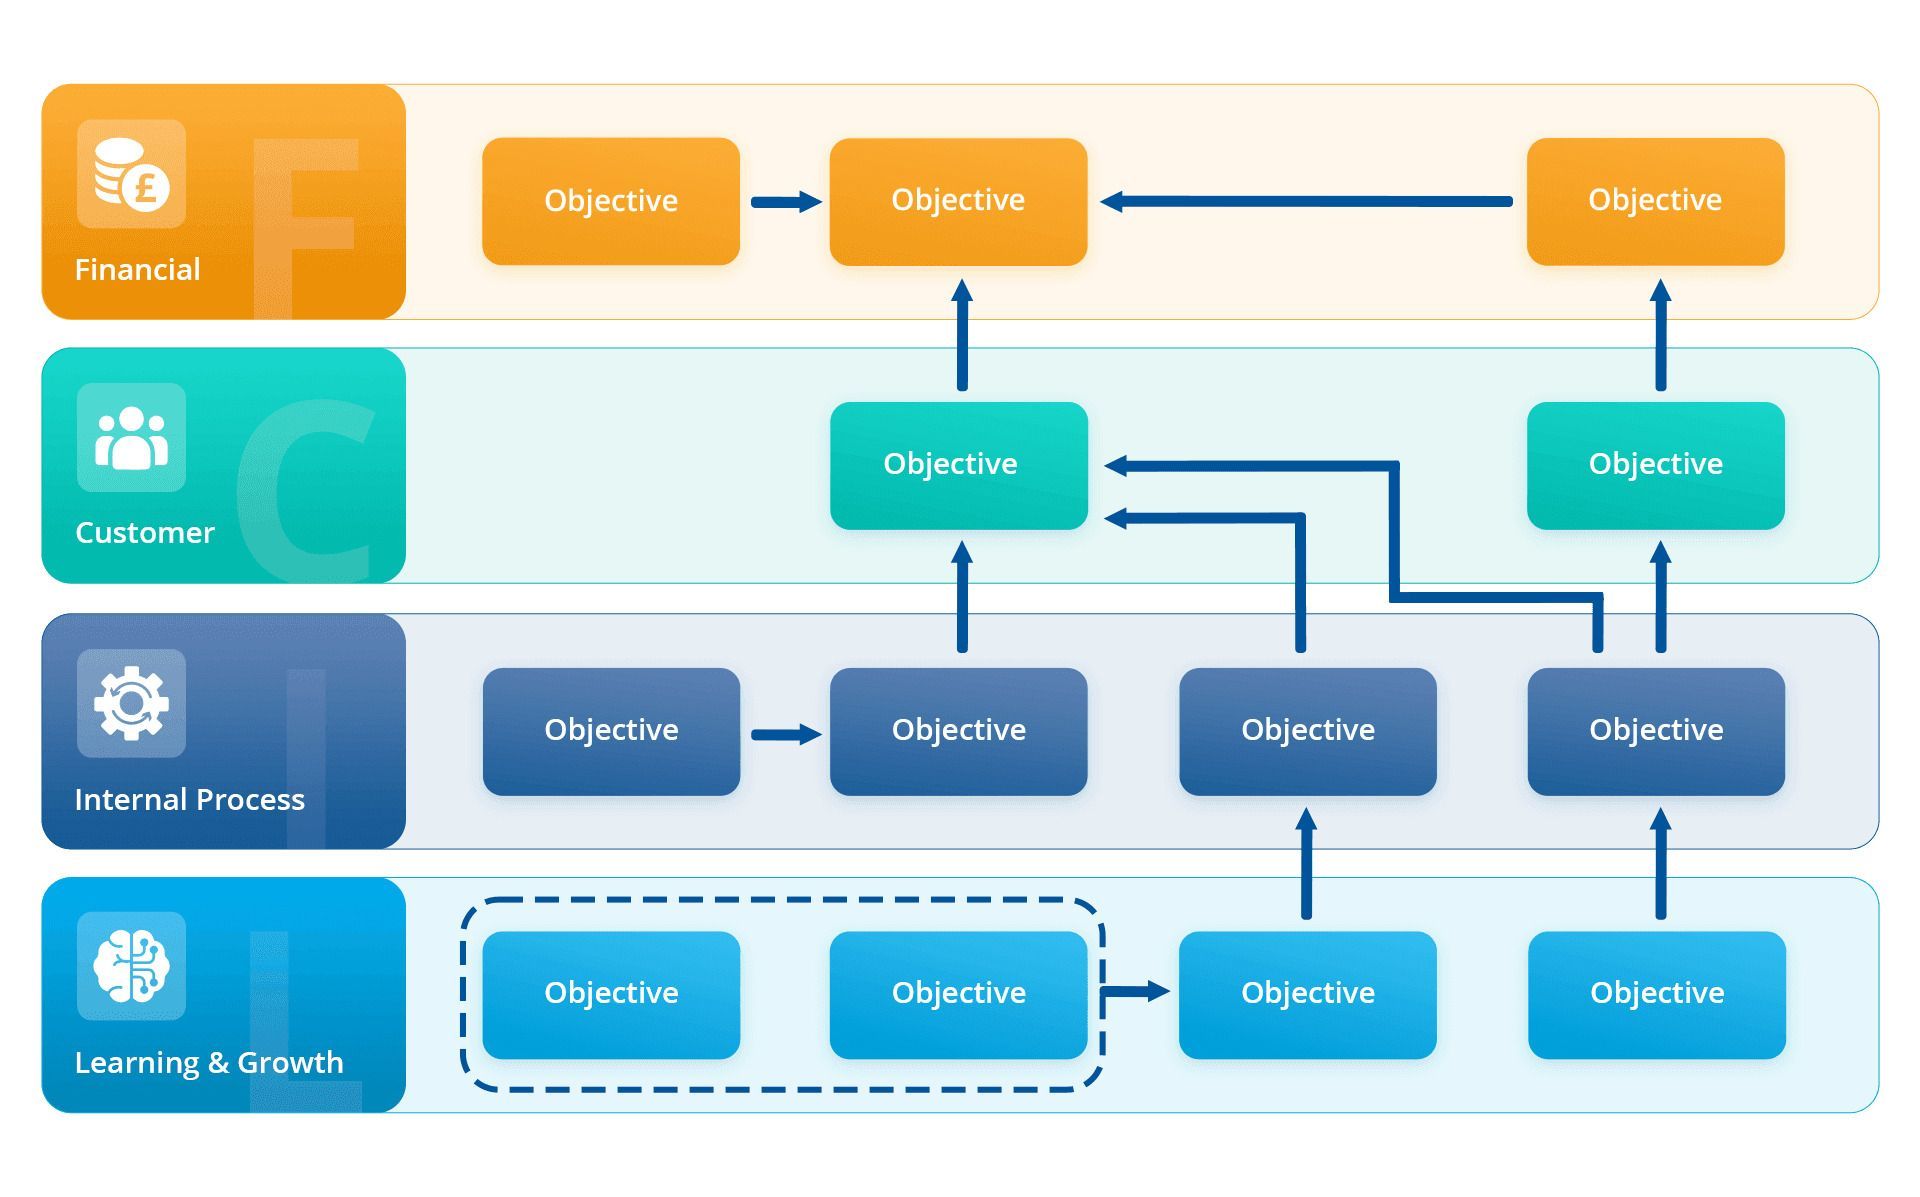
Strategy maps refer to visual diagram that displays how goals across different perspectives influence one another in a cause-effect chain.
Key features:
- Drag-and-drop strategy mapping
- Objective linking to KPIs, owners and actions
- Cause-effect pathway visualisation
- Interactive, drillable diagrams
LTS Data Point version:
- Allows users to build drag-and-drop strategy maps that convert long-term goals into practical pathways.
- Links each node (objective) directly to a KPI or initiative within the platform.
- Helps leadership visually communicate strategic intent to the entire organisation.
- Operates as an interactive map where clicking any task reveals its metrics and owners.
4. Mind map and process flow templates
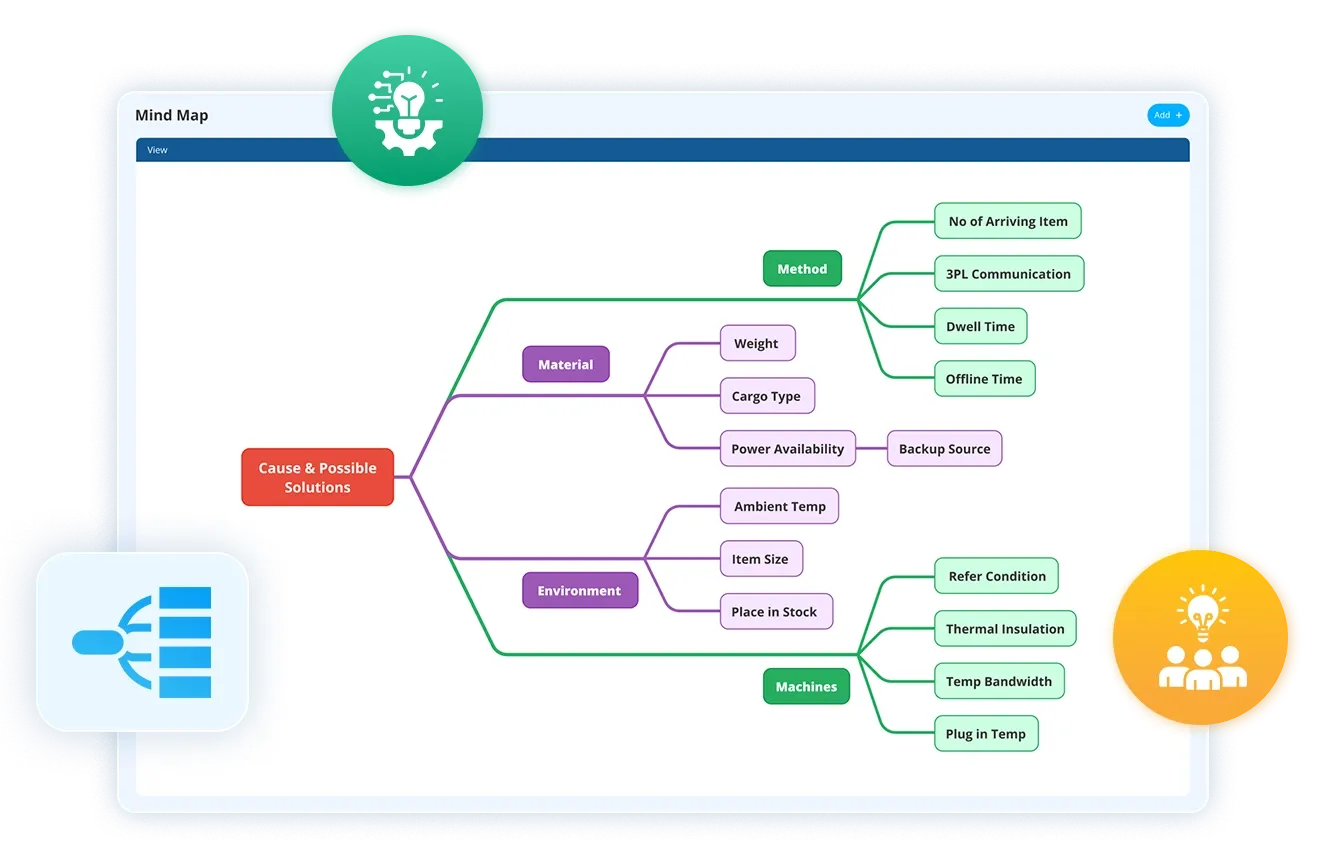
Mind map and process flow diagram templates that help teams chart ideas, functions, workflows, relationships, and strategic themes.
Key features:
- Simple, visual template builder
- Branch-level linkage to tasks or KPIs
- Workflow and process flow mapping
- Exportable and sharable views for teams
LTS Data Point version:
- Offers built-in mind-mapping for brainstorming strategic themes, improvement ideas, or capability roadmaps.
- Includes process-flow builders to outline workflows, value streams, or change-management stages.
- Connects each branch or process stage to actions, reports, or performance metrics.
- Supports cross-functional planning by illustrating how activities associate across teams.
5. Project and action plan templates
These are structured templates that convert strategic goals into specific tasks, with timelines, owners, dependencies, and measurable outcomes.
Key features:
- Action plan creation and tracking
- Owner assignment workload visibility
- KPI-aligned task management
- Timeline and status automation
LTS Data Point version:
- Provides ready-to-use action-plan layouts for strategic projects, improvement activities, or transformation initiatives.
- Enables assigning of actions to individuals with due dates, priority levels, and status tracking.
- Integrates action plans with KPIs so every task contributes to quantifiable strategy execution.
- Visualises colour-coded progress indicators to underline delays, risks, or escalations.
6. Quad charts
Quad charts are compact, four-section visual tool summarising a project or initiative's aims, approach, results, and risks.
Key features:
- Auto-populated quadrants (objective, plan, results, risks)
- Integration with KPI and project dashboards
- Exportable for reviews and presentations
- Perfect for stage-gate and continuous improvement reviews.
LTS Data Point version:
- Offers standardised quad chart templates for presenting project summaries, improvement cases, or strategy assessments.
- Automatically pulls project data, KPI results, and risk indicators into the chart.
- Aids leadership quickly review project progress without reading lengthy documents.
- Useful for Lean, Six Sigma, or executive-level decision-making routines.
Performance metrics
Performance metrics include tools for monitoring, analysing, and managing execution against the strategy.
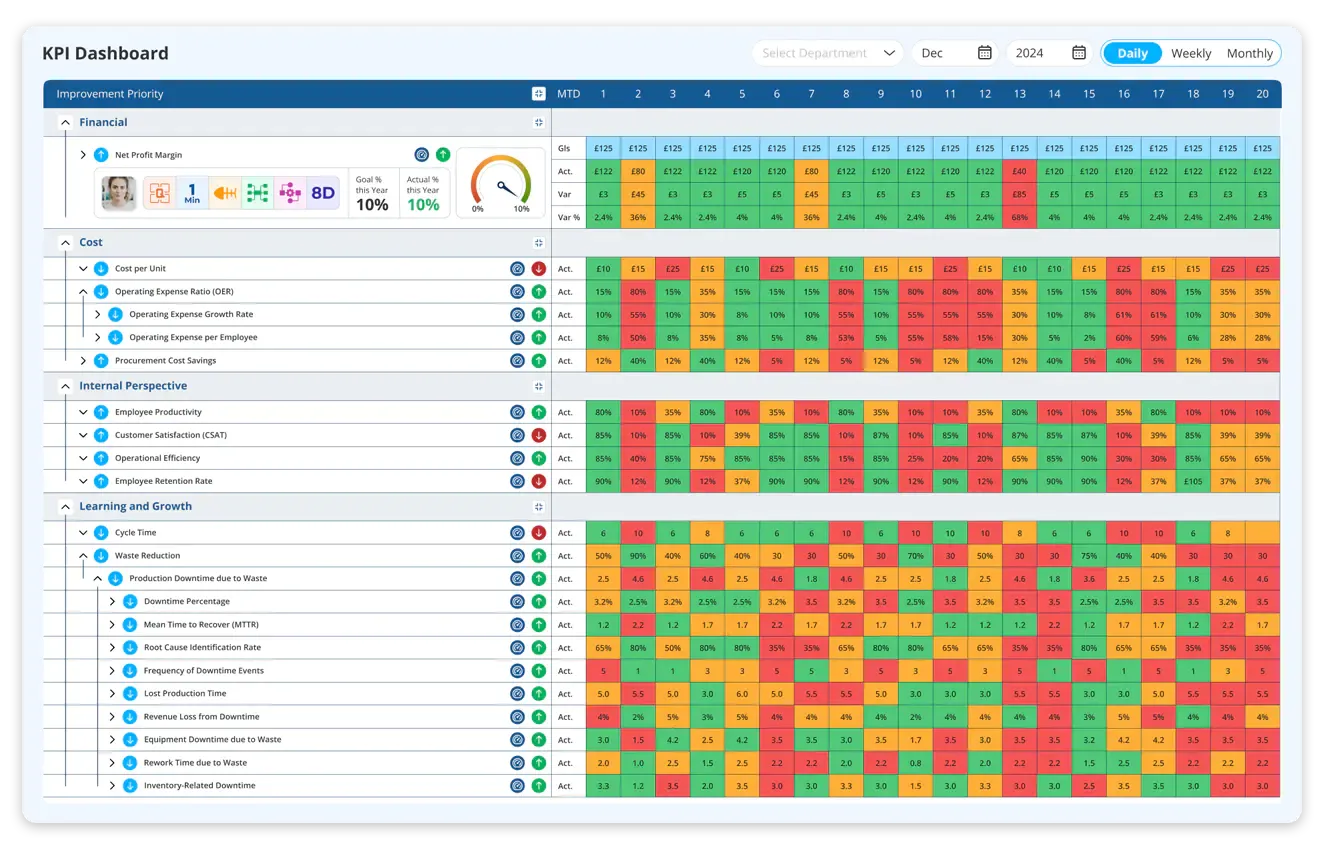
1. Real-time KPI dashboards
It is a live, centralised view of all key performance indicators that updates automatically as data flows in from operations, systems, and frontline activities.
Key features:
- Live data refresh
- Target vs actual visualisation
- Custom dashboard builder
- Drilldown analytics
LTS Data Point version:
- Integrates with ERP, MES, shopfloor information, and manual inputs to display live performance.
- Provides role-based dashboards so executives, managers, and operators see the metrics that matter to them.
- Spotlights deviations from aims instantly with alerts and visual cues.
- Allows drilldown from high-level KPIs to department, process, or even task-level metrics.
It is a structured measurement framework that monitors both leading and lagging indicators across strategic perspectives such as Financial, Customer, Internal Process, and Learning and growth.
Key features:
- Multi-level scorecard views
- Automatic status calculations
- Leading vs lagging indicator mapping
- KPI-to-objective linkage
LTS Data Point version:
- Enables industries to allot KPIs to each strategic objective within the Balanced Scorecard.
- Automatically computes performance status using colour coding, thresholds, and trend lines.
- Links each KPI to initiatives, improvement actions, and owners for full accountability.
- Synchronises metrics at organisational, departmental, and team levels for clear alignment.
3. Operational performance system
SQDC / SQDCP operational performance framework calculates Safety, Quality, Delivery, Cost, and People (with optional Productivity / People) to confirm frontline activities align with organisational objectives.
Key features:
- Digital SQDC / SQDCP scoreboards
- Live pass / fail status visibility
- Automatic escalation to CAPA or root cause workflows
- KPI integration and trend analytics
- Shift-to-shift and team-to-team comparison views
LTS Data Point version:
- Offers fully digital SQDC / SQDCP boards that frontline teams update during shifts, daily meetings, and Gemba walks.
- Monitors live performance against each pillar, exhibiting green or red status for immediate visibility of issues.
- Connects each failed metric (e.g., a Quality miss or Delivery delay) directly to root cause tools, CAPA, or improvement projects.
- Rolls up SQDC / SQDCP results into organisational KPI dashboards, allowing alignment between daily performance and strategic goals.
- Enables cross-shift and cross-department comparison to spot trends, repeating issues, and improvement opportunities.
4. Daily management frameworks
It is a structured set of boards and routines that help daily operational reviews, updates, escalations, and team alignment.
Key features:
- Tiered daily management boards
- Issue escalation and tracking
- Integrated KPI and SQDCP display
- Automated meeting summaries and actions
LTS Data Point version:
- Offers digital tier boards (Tier 1, Tier 2, Tier 3) that combine SQDCP data, KPIs, team tasks, and issues into the daily meeting flow.
- Supports visual escalation paths so problems can be elevated quickly to leaders or cross-functional teams.
- Links operational issues to strategic KPIs to assure frontline activities support long-term goals.
- Allows automated meeting reports and follow-up action monitoring.
5. Gemba walk and audit frameworks
These are structured tools for conducting shopfloor walks, audits, and frontline reviews to observe performance, spot problems, and verify standards.
Key features:
- Customisable Gemba and audit templates
- Mobile logging and photo capture
- Issue tagging and RCA linkage
- Digital audit reports and follow-up tracking
LTS Data Point version:
- Provides mobile-friendly Gemba and audit templates aligned with the SQDCP model.
- Captures observations, risks, non-conformities, and opportunities for improvement in real time.
- Connects findings directly to action plans, KPIs, and problem-solving workflows.
- Generates digital audit trails and assures accountability for follow-up actions.
6. Visual production metrics
These are operational metrics (OEE, Downtime, Throughput) that calculate equipment effectiveness, downtime losses, and daily production performance.
Key features:
- Automated OEE capture
- Downtime category dashboards
- Production target vs actual display
- Loss analysis and improvement linking
LTS Data Point version:
- Connects machines, sensors, or manual inputs to automatically capture OEE and downtime.
- Shows live performance next to SQDCP and Balanced Scorecard indicators for full visibility.
- Converts equipment losses into improvement actions and root cause tasks.
- Allows comparisons of performance across lines, cells, or shifts.
7. Performance heatmaps
It is a visual grid that underlines performance levels – good, average, or critical – using colour gradients to make issues easy to detect.
Key features:
- Colour-coded performance zones
- Departmental or functional filtering
- Trend and pattern visibility
- One-click drilldown to metrics
LTS Data Point version
- Displays high-risk areas, underperforming KPIs, and bottlenecks in a single snapshot.
- Enables filtering by departments, roles, functions, or time periods to assess patterns.
- Assists leadership prioritise actions based on severity and impact.
- Connects each heatmap cell to the underlying KPI or initiative for deeper inspection.
Curious how the 2026 Strategy Kit works in real life?
Innovation roadmaps
Innovation roadmap tools support long-term transformation, adaptability, and continuous improvement.
1. Strategic roadmap builder
It is a long-term planning tool that visually outlines multi-year initiatives, timelines, dependencies, and transformation priorities across the industry.
Key features:
- Drag-and-drop roadmap creation
- Timeline and milestone visibility
- KPI-linked strategic initiatives
- Cross-functional alignment views
LTS Data Point version:
- Allows organisations chart technology upgrades, operational improvements, capability development, and strategic themes over 1-5 years.
- Links each roadmap item to KPIs, owners, budgets, and milestones for accountability.
- Supports scenario planning by enabling teams to change timelines or priorities based on business conditions.
- Offers a unified view of strategic projects across multiple operations, ensuring alignment and resource clarity.
2. Innovation pipelines
It is a structured pipeline that monitors ideas from initial submission through assessment, prioritisation, approval, development, and implementation.
Key features:
- Idea submission portal
- Impact-effort scoring tools
- Stage-gate progression tracking
- Conversion of ideas into practical projects
LTS Data Point version:
- Allows employees at all levels to submit innovation ideas through a digital portal.
- Uses scoring models and examination criteria to rank ideas based on impact, feasibility, cost, and strategic fit.
- Automatically moves ideas through defined stages (e.g., Submitted -> Reviewed -> Approved -> In Progress -> Implemented).
- Connects approved ideas to improvement projects, KPIs, and success metrics.
3. Improvement project trackers
They are digital tools for planning, executing, monitoring, and analysing improvement and innovation projects.
Key features:
- End-to-end project lifestyle tracking
- Integration with KPI dashboards
- Risk and dependency monitoring
- Progress visualisation and monitoring
LTS Data Point version:
- Supports Lean, Kaizen, Six Sigma, and digital-transformation projects with designed templates.
- Links each project to relevant KPIs, strategic goals, and problem statements.
- Monitors tasks, deadlines, owners, risks, and outcomes in real time.
- Offers visual summaries for leadership reviews, audits, or continuous improvement meetings.
4. Capability-building roadmaps
It is a strategic plan that outlines how workforce skills, competencies, and capacities will evolve to support long-term organisational objectives.
Key features:
- Skill matrix integration
- Role-based capability pathway design
- Training need identification
- Workforce-readiness dashboards
LTS Data Point version:
- Integrates directly with Skill Matrix module to spot skill gaps and future capability needs.
- Creates development pathways that indicates training, certifications, rotations, and digital-skills progression.
- Links capability development to role requirements, strategic priorities, and innovation initiatives.
- Monitors completion rates and readiness levels to ensure the workforce can support upcoming changes.
5. Integration roadmaps
It is a structured plan that traces when, how, and where digital systems like MES, ERP, IoT sensors, or automation tools will be connected across the organisation.
Key features:
- System integration timeline mapping
- Dataflow and dependency visualisation
- Cross-functional integration planning
- Impact tracking through digital KPIs
LTS Data Point version
- Maps integration priorities, dependencies, cost stages, and dataflow needs.
- Links integration milestones to digital KPIs to shows how system improvements impact performance.
- Gives a clear view of which plants, lines, shifts, or functions will be digitised and in what sequence.
- Aids teams coordinate with IT, operations, engineering, and leadership for seamless rollout.
6. Continuous improvement loops
It is a feedback-driven system that updates targets, KPIs, and actions based on live performance trends and learning cycles.
Key features:
- Built-in PDCA and CI workflows
- Trend-based performance alerts
- Integration with CAPA and root cause tools
- Automatic feedback loops into strategic plans
LTS Data Point version:
- Embeds PDCA (Plan-Do-Check-Act) loops directly into dashboards and performance boards.
- Utilises automated alerts and trends to spot when goals need to be revisited or enhanced.
- Connects root cause analysis and CAPA processes to long-term improvements.
- Assures strategy, processes, and innovation stay aligned and evolve continuously.
Get your strategy kit now
How the 2026 organisational strategy kit helps you achieve your goal
The 2026 strategy kit provides organisations a whole, organised, and data-driven approach to planning, executing, and sustaining strategic performance, it turns high-level ambitions into clear actions, quantifiable results, and continuous improvement across the business. By merging planning tools, performance metrics, and innovation roadmaps inside one integrated digital platform, it makes sure strategy is not just recorded but actively lived by teams every day.
Key benefits of using LTS Data Point strategy kit
- Clear, aligned, cascade-ready strategy: Makes sure goals flow seamlessly from leadership to departments and shopfloor teams. For this, it makes use of Balanced Scorecards, Hoshin Kanri X Matrices, and strategy maps, thus, removing confusions by creating a shared comprehension of priorities and responsibilities across the industry.
- Live visibility of performance: Binds strategic objectives to fully digital dashboards SQDC / SQDCP boards, OEE metrics, and daily tier systems. It spotlights performance gaps instantly with automated alerts, heatmaps, and red or green indicators, allowing leaders to take quick, fact-based decisions with real-time performance reports.
- Execution accountability and discipline: Links strategic objectives to action plans, deadlines, and progress trackers. This verifies follow-through with automated escalations, meeting summaries, and CAPA/RCA integration, strengthening lean daily management routines so targets are assessed, discussed, and acted on.
- Built-in continuous improvement: Integrates improvement pipelines, idea tracing, innovation boards, and CI loops. It also ties improvement activities directly to KPIs for measurable impact. This helps teams refine strategy based on actual performance trends and learning cycles.
- Future-ready transformation planning: Makes use of innovation roadmaps, capability-building maps, and integration plans (MES/ERP) to prepare for digital growth. It supports multi-year project planning across technology, functions, and workforce development, offering a structured path for a long-term competitiveness.
- One unified ecosystem for strategy execution: All tools – scorecards, dashboards, project boards, audits, Gemba, and improvement tools – connect inside LTS Data Point. This helps in getting rid of scattered spreadsheets, data, and disconnected systems, confirming a single source of truth for strategic planning, operational execution, and performance reporting.
Know more about customisable strategy kit
Guide to use 2026 strategy kit: Who should use it and why
Everything good so far, right?
But who exactly needs this complete strategy kit from any organisation?
And why do you need it depending on which level employee you are?
Questions remain unanswered right? And most probably, you might have additional questions as well.
Let's answer all your questions in best possible way one-by-one.
1. Executive leaders – CEOs, MDs, Directors
Why you need it:
- To define and cascade organisational preferences with accuracy
- To track strategic execution through live, enterprise-wide dashboards
- To make sure every department is aligned to long-term growth and transformation
2. Strategy and continuous improvement teams
Why you need it:
- To deploy frameworks like Balanced Scorecard and Hoshin Kanri X Matrix, digitally
- To observe improvement projects, KPIs, and performance trends in one platform
- To run organised strategy cycles and CI loops effectively
3. Operations and production leaders
Why you need it:
- To link strategic goals to daily SQDC / SQDCP performance
- To run effective Tier meetings, Gemba walks, and lean daily management routines
- To bring out problems early and escalate them through automated workflows
4. Department heads and functional managers – HR, Quality, Maintenance, Supply chain
Why you need it:
- To align departmental KPIs with industrial aims
- To use data-driven dashboards and for decision-making and resource planning
- To manage initiatives, risks, and performance with transparency
5. Digital transformation and Industry 4.0 teams
Why you need it:
- To create long-term innovation and capability roadmaps
- To integrate MES/ERP data into strategy execution
- To guide technology adoption using quantifiable, outcome-driven planning
6. Project and programme managers
Why you need it:
- To break strategic objectives down into projects, milestones, and deliverables
- To trace progress, risks, and dependencies with measurable accountability
- To align project outcomes with strategic KPIs
7. Frontline supervisors and team leaders
Why you need it:
- To understand how their daily performance influences industrial targets
- To track live aims using SQDC boards and shift performance dashboards
- To participate in daily improvement and problem-solving cycles
8. Organisations pursuing Lean, operational excellence, or ISO standards
Why you need it:
- To standardise functions, audits, and performance routines
- To bridge the gap between strategy, operations, and compliance
- To maintain continuous improvement using structured digital tools
Ready to make strategy simple? Grab the 2026 Strategy Kit from LTS Data Point and start turning plans into results. It’s packed with tools to help you set clear goals, share them across teams, track progress, and keep improvement moving.
Whether you’re shaping next year’s targets or reworking your long-term plans, this kit gives you the templates and structure to get things done without the guesswork.
Don’t wait – download the kit now and kick-start your journey to smarter, faster, better execution.
Download Your Strategy Kit Now
FAQs
1. What makes digital strategy kit different from traditional planning tools?
Unlike static spreadsheets, the 2026 Strategy Kit combines digital templates, live dashboards, and innovation roadmaps in one platform for real-time visibility and alignment.
2. Can the strategy kit help with cross-functional collaboration?
Yes. It links objectives, KPIs, and action plans across departments, ensuring everyone works towards the same goals without duplication or confusion.
3. Is this strategy kit suitable for small businesses?
Absolutely. It’s designed to scale, so smaller organisations can use the same tools as large enterprises without complexity or heavy IT investment.
4. How does the strategy kit support continuous improvement?
It includes built-in improvement pipelines and feedback loops, helping teams refine strategies based on real performance trends and learning cycles.
5. Is technical expertise a necessity to use strategy kit?
No. The kit is user-friendly with drag-and-drop templates and guided workflows, making it easy for leaders and teams to adopt without advanced technical skills.
6. Can the strategy kit integrate with existing systems?
Yes. It connects with ERP, MES, and other operational systems to pull live data into dashboards, ensuring accurate and up-to-date performance tracking.
7. How quickly can an organisation start using the strategy kit?
Most organisations can get started within days, thanks to ready-made templates and simple onboarding support from LTS Data Point.

Abel Jiménez, Lean Consultant
Abel is a Lean Consultant with over 30 years of expertise in operational analysis, process improvement, and organisational change across Mexican industries. Currently serving as Director of Insurance Promotions at CESCEMEX, he helps organisations leverage technology and lean practices to improve efficiency and manage change with continuity.