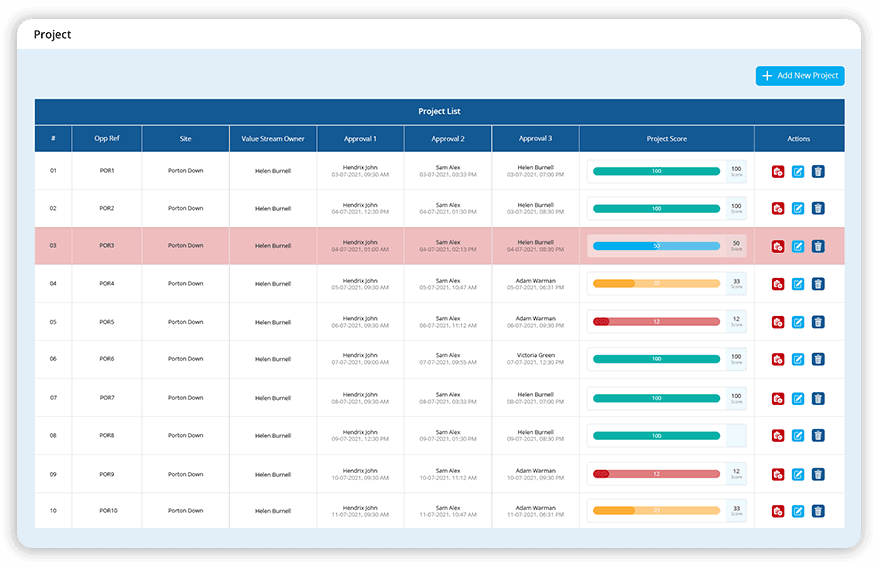
Evaluate effectiveness of multiple projects with the best Project Tracker tool
Data Point Project Tracker allows easy and effective evaluation of different projects within the organisation. Gain visibility over the project's progress and make the right decisions.
Planning and scheduling is Easier
Prioritise projects using the project scoring feature. Set dynamic project scoring questions to assess the priority of each project. Get approval from an authorised user. Once approved, the projects and their status is then visible to other users.

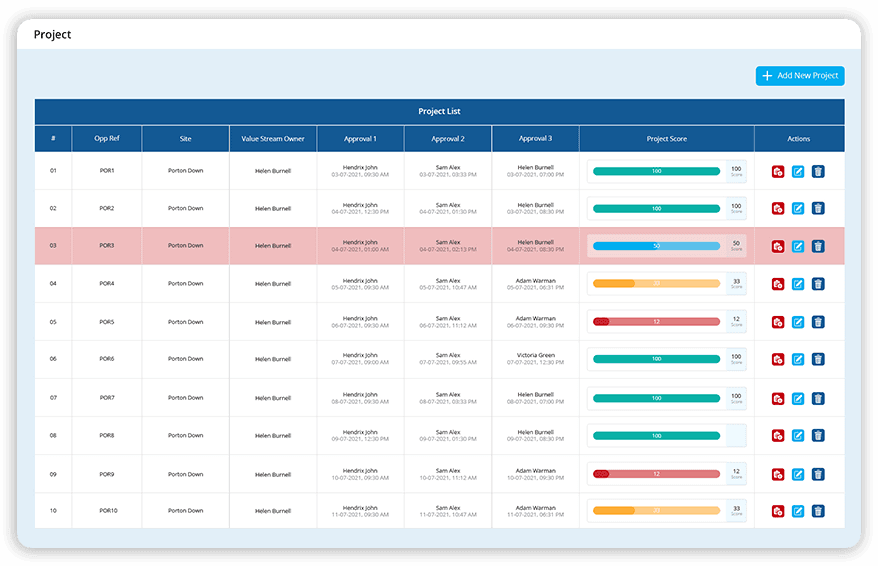
Evaluate and track multiple projects with Digital Balanced Scorecard. Create, score and assess projects. Get more visibility, track and record project status, gain complete financial visibility and control over projects.
Team members can see their allocated projects and planned hours in a weekly chart. Users can log their time against each project. For each project, users can either run the timer or manually enter the timesheet. Keep track of actual vs planned time.
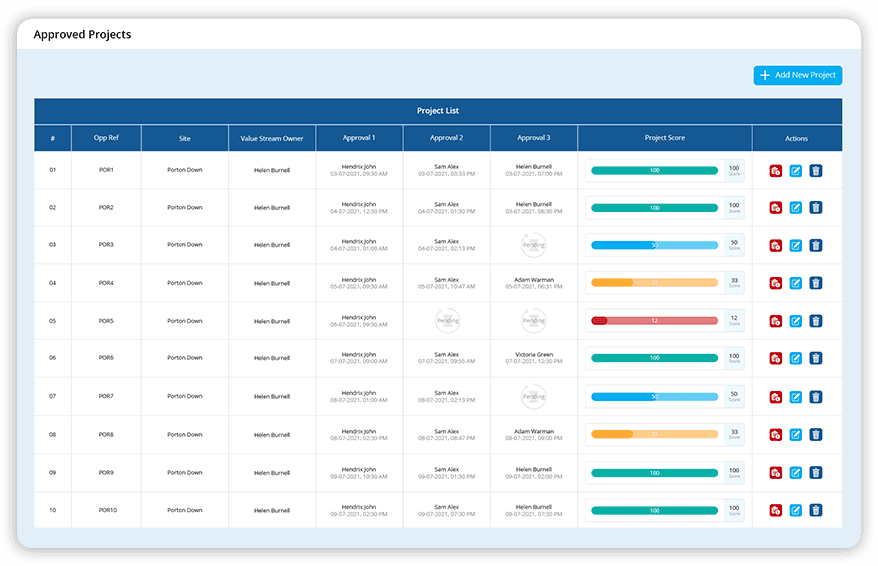
Keep your Projects on Track with Accurate Time Tracking

Get an overview of the entire project's progress in the organisation. Evaluate whether the projects are executed as per the plans—comprehensive report page, with advanced dashboard matrix, sort and filter options for detailed reports.
The Capital Expenditure (CapEx) option tracks the expense for each project. Users can see the allocated budget, actual spent and the remaining amount for the project in the CapEx reporting dashboard. Add expenses and proof as attachments of each spending for transparency and audit processes.


Project leads can update the expected ROI based on their project progress analysis. Our system will predict the anticipated ROI based on the project spent vs cost savings using the Artificial Intelligence (AI) technology. The system will save both expected ROI and anticipated ROI changes for future cost analysis.
Maximise your ROI with Data Point
Cost-benefit analysis compares the project cost and cost savings. Map projects in a cost analysis matrix based on the cost saved over the cost spent. Users can write comments on cost-benefit analysis and see them in a timeline view.
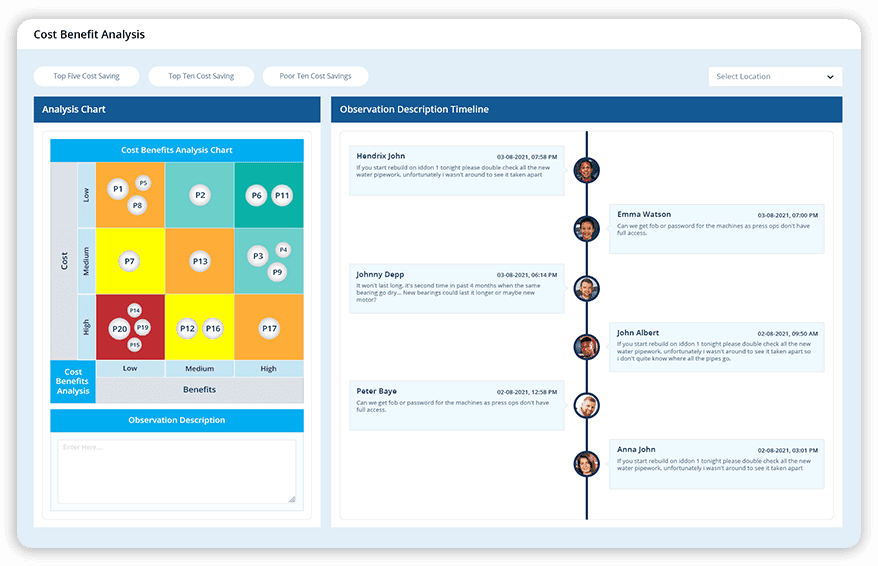

Separate discussion areas are available for each project, where users can interact with each other and make comments and opinions regarding that project. Ensure clear, precise, and transparent communication regarding the project progress or blockers and help the project team build constructive continuity plans.
Choice of industry leaders and Fortune 500 companies


















How Data Point Project Tracker enhances your workflow?
Streamline your project management with our intuitive Project Tracker

Complete visibility
Monitor project progress in real-time with detailed tracking tools.

Effortless planning
Define project duration, allocate resources, and schedule tasks seamlessly.

Prioritise effectively
Utilise dynamic scoring to evaluate and approve projects based on business needs.
Simplify your project management today with Data Point
Project Tracker Software to Plan, Prioritise & Deliver Successful Projects
Discover how a project tracker helps prioritise initiatives, manage timelines, monitor budgets, track ROI, improve collaboration, and give leaders complete visibility to deliver projects efficiently and maximise business value.
How does project scoring and approval prevent low-value initiatives from consuming resources?
Not every proposed improvement project deserves the same level of investment. Without a structured way to compare and prioritise, resource allocation often defaults to whichever project has the most vocal sponsor or the most recent request, rather than the one with the strongest business care.
Dynamic project scoring questions allow each proposed project to be assessed against consistent criteria before it is approved. Requiring sign-off from an authorised user before a project becomes visible to other teams means only projects that have cleared that evaluation bar enter the active pipeline. This prevents the common failure mode where multiple overlapping or low-priority initiatives run simultaneously simply because nobody formally compared them against each other before they started.
How do timesheets logging actual vs planned hours support more accurate future project planning?
Project plans are built on estimated durations. Those estimates rarely get formally checked against what actually happened, which means the same type of task gets estimated the same way project after project, even if actually delivery consistently runs longer or shorter than planned.
Logging actual hours against planned hours, whether through a timer or manual entry, creates a record that can be reviewed after the project closes. Over multiple projects, this comparison reveals whether certain task types are systematically underestimated. That pattern is only visible when actual time is captured consistently rather than estimated retrospectively from memory, which is what most project reviews rely on without a timesheet system in place.
How does CapEx tracking within a project tool support audit readiness for capital spending?
Capital expenditure on improvement projects typically needs to be justified after the fact, not just approved before it starts. Auditors and finance teams want to see what was budgeted, what was actually spent, and evidence supporting each expense, not just a final total.
Tracking allocated budget, actual spend, and remaining amount within the project tool, with expense attachments recorded alongside each entry, means the audit trail exists as the project runs rather than being reconstructed afterward. This matters particularly for projects funded through capital budgets that carry stricter governance requirements than operational spending, where the ability to produce documented evidence for each expense is often a compliance requirement rather than a convenience.
How does a cost-benefit analysis matrix help prioritise between competing improvement projects?
When multiple projects are proposed simultaneously and resources are limited, the decision about which to pursue first should be based on the relationship between cost and expected saving, not on which proposal was submitted first or which sponsor has the most influence.
Mapping projects on a cost analysis matrix based on cost saved versus cost spent makes that comparison visual and immediate. A project with a high cost and a modest saving sit in a different position on the matrix than one with a modest cost and a substantial saving, and that positioning is far easier to compare across multiple proposals than reading through separate business cases for each one. Comments logged in a timeline view alongside the matrix mean the reasoning behind a project’s position is documented, not just the final score.
How does a Gantt chart view improve cross-functional project coordination compared to a simple task list?
A task list shows what needs to happen. It does not show when, in what order, or how one task’s delay affects everything scheduled after it. Teams working from a list-based view often discover a scheduling conflict only when it has already caused a delay.
A Gantt chart displayed in a calendar view makes duration, sequencing, and resource allocation visible simultaneously. When a task is extended, the downstream impact on dependent tasks is visible immediately, not discovered later when the dependent task starts late. For projects involving multiple teams working on interdependent tasks, this shared visual reference is what keeps everyone working from the same understanding of how the project timeline actually fits together.
How does the Project Super Dashboard give leadership a portfolio-wide view without losing individual project detail?
Reviewing multiple projects individually, one report at a time, makes it difficult to compare relative progress or spot which projects across the portfolio are falling behind. Each project might report its own status accurately, but there is no single view that shows how the whole portfolio is tracking.
The Project Super Dashboard consolidates progress across every project into one comprehensive view, with sort and filter options that allow a leader to move from the portfolio-level picture into a specific project’s detail without switching to a separate report. This structure is particularly useful when evaluating whether the organisation’s overall project pipeline is executing according to plan, since a portfolio-wide pattern of delay is a different conversation from an isolated issue on a single project.
How does AI-predicted ROI differ from a manually calculated return on investment, and why does that distinction matter over time?
A manually calculated ROI is typically a single figure produced at project completion, based on the final spend and the final measured benefit. It does not account for how the relationship between spend and benefit evolved as the project progressed, and it offers no forward-looking signal while the project is still underway.
AI-predicted ROI, calculated from spend versus cost savings data as the project progresses, gives an anticipated return before the project has finished, alongside the expected ROI set at the outset. Storing both the expected and anticipated figures over time builds a dataset that can inform future project scoring, since patterns in which project types tend to over or underdeliver against their initial ROI projection become visible across a portfolio rather than being assessed project by project in isolation.
How does a dedicated discussion area per project prevent context from being lost across email threads?
Project communication that happens through email or informal chat messages fragments quickly. A blocker raised in one email thread and a decision made in a separate conversation are rarely reconciled into a single record, which means anyone joining the project later, or reviewing it after completion, has to piece the history together from scattered sources.
A discussion area specific to each project keeps blockers, decisions, and progress commentary in one place, tied directly to the project it concerns. This is particularly valuable for continuity planning, where a project that changes ownership partway through needs the incoming lead to understand not just the current status but the reasoning behind decisions made earlier in the project. That context is preserved in the discussion record rather than existing only in the previous lead’s inbox.
Hear it from our customers

MARC ROBINSON
Director, Global Operational Excellence


“By providing a central location to input, analyse and share our KPIs, 'Data Point' enables site management to more easily focus on the entire business as a team. Its ability to allow automated data entry and trend analysis gives us more time for improvement rather than just reporting numbers. Combined with a disciplined approach within our SQDC meeting process, I believe 'Data Point' will help us continually focus on key issues and drive business excellence in all areas.”
Achieve project excellence with Data Point
Leverage the power of advanced tracking and financial insights to make informed decisions and optimise performance.