Value Stream Mapping Software that moves from insight to action
Most VSM tools stop at the diagram. LTS Data Point connects your current-state map to strategy alignment, live process simulation, and structured breakthrough action planning in one integrated system, built for lean and operational excellence practitioners.
From Value Stream Mapping to Structured Improvement Execution
Map your value stream, identify bottlenecks, waiting time, and waste then Instantly convert improvement opportunities into structured action plans with clear ownership and progress tracking.
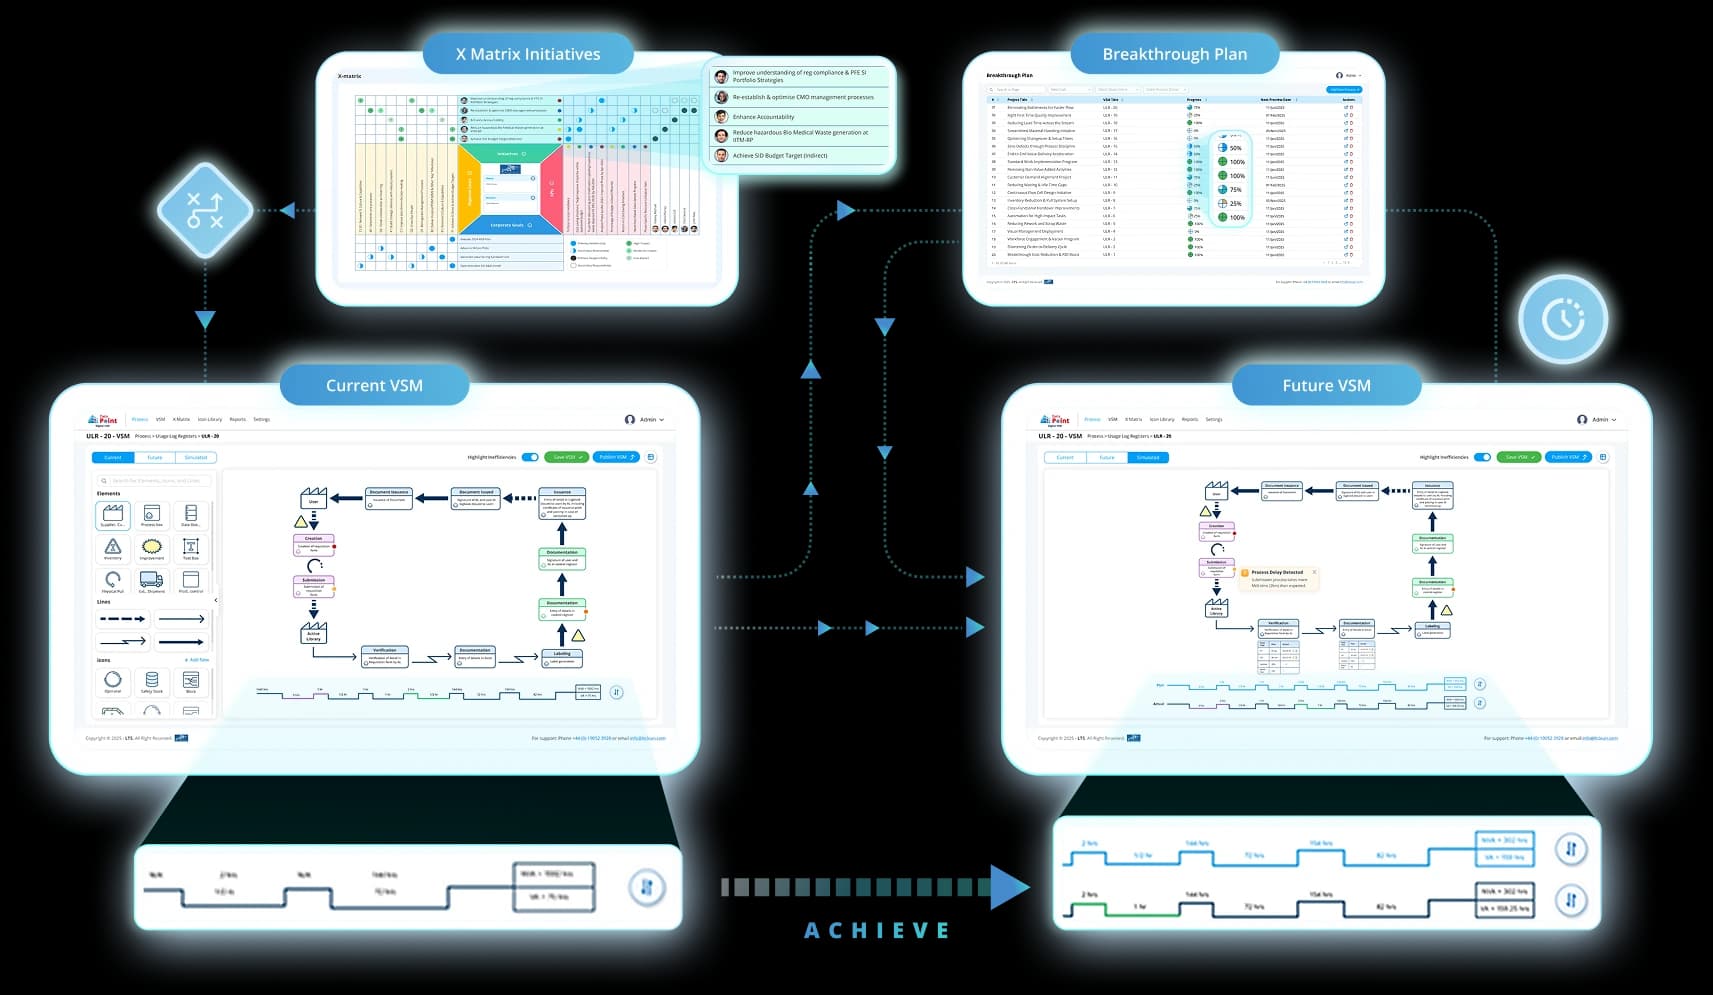
Four capabilities. One connected system
What you discover in the value stream map flows directly into strategy alignment, simulation validation, and structured execution. Not four tools - one platform.
Value Stream Mapping
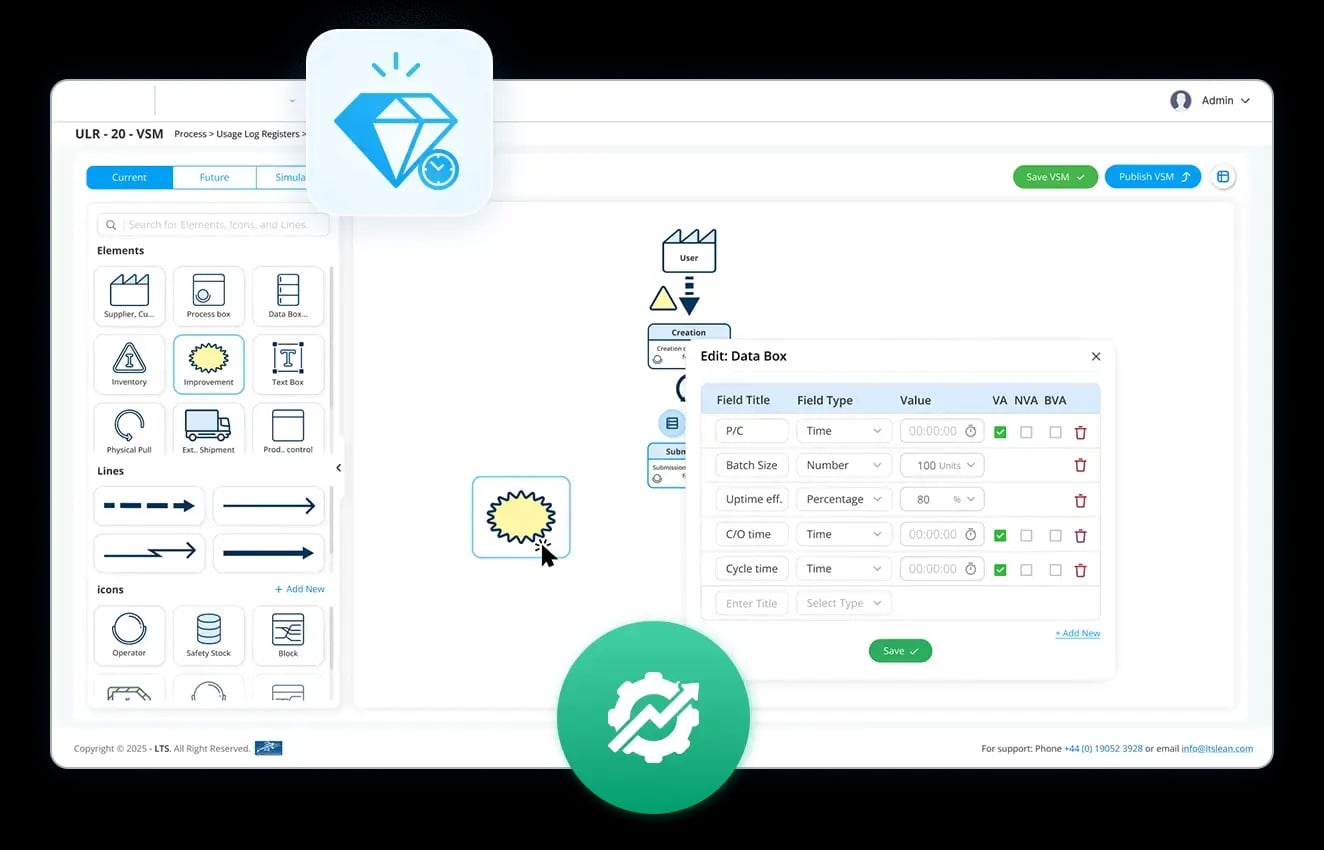
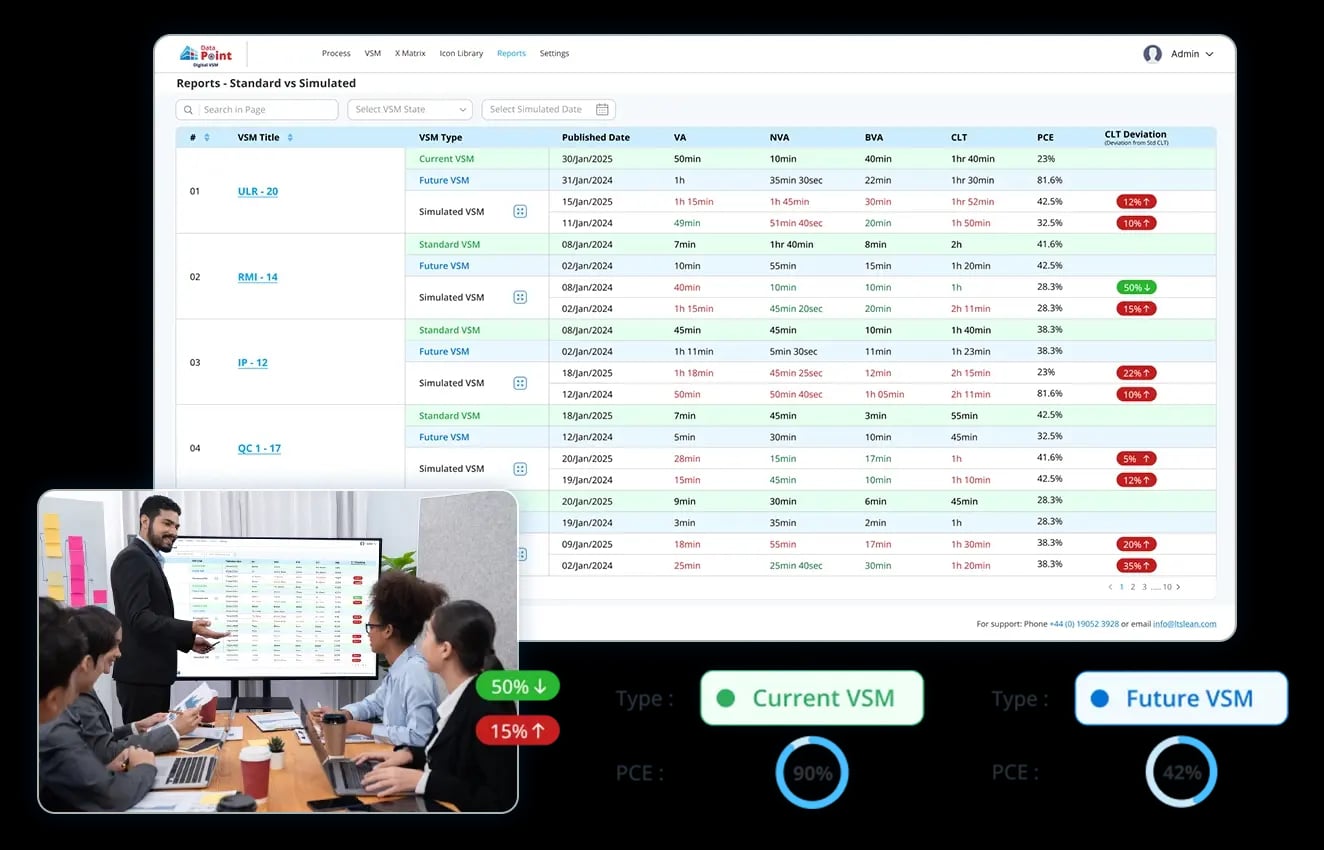
Build digital Current, Future, and Simulated VSMs using a full lean symbol set. Each process step includes an interactive data box where activities are classified as Value-Added (VA), Non-Value-Added (NVA), or Business Value-Added (BVA).
Key Capabilities
- Interactive process data fields (cycle time, changeover, batch size, uptime, and custom fields)
- Automatic VA / NVA / BVA classification with real-time PCE calculation
- Colour-coded time ladder identifying the highest NVA bottleneck
- Version-controlled VSMs with full history and comparison
- Multi-level VSM hierarchy (process, department, organisation)
- PCE trend tracking across versions
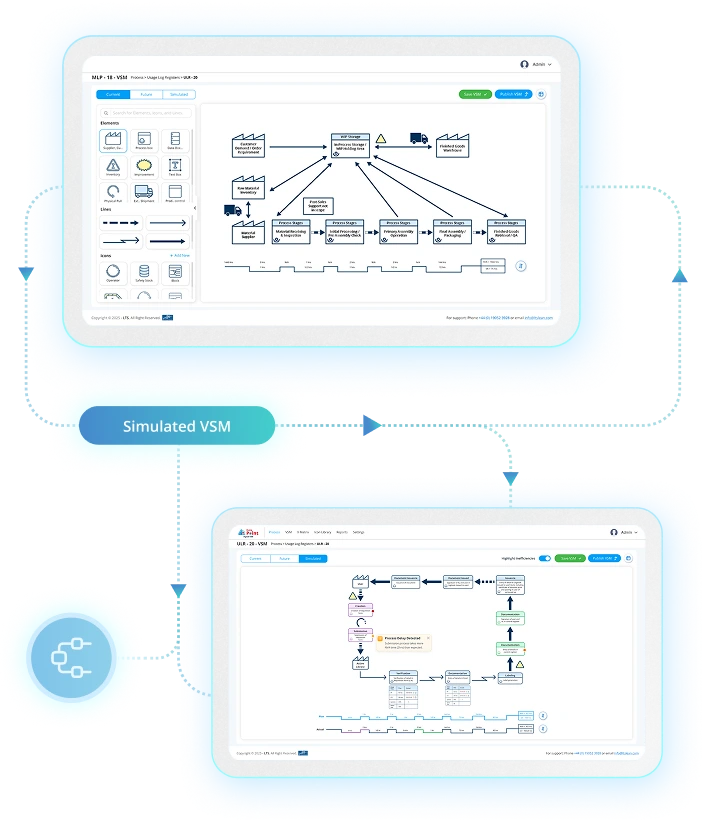
Data Point VSM Software vs Traditional VSM Tools
A comparison of traditional value stream mapping tools and the integrated capabilities of the Value Stream Mapping Software.
| Capability | Traditional Tools | LTS Data Point VSM Software |
|---|---|---|
| Digital VSM creation with lean symbols | Partial - diagramming only, no process intelligence | Full VSM with live VA/NVA calculation |
| Automatic bottleneck & NVA detection | Manual analysis required | Auto-flags highest-NVA step in real time |
| Version control & audit history | File-based, no structured versioning | Full version history with activity log |
| Process simulation & scenario testing | Not available (except iGrafx - complex, no strategy link) | Live simulation with scenario comparison |
| X Matrix / Hoshin Kanri integration | No tool offers this with VSM | Direct VSM → X Matrix linkage built-in |
| Breakthrough action planning | Managed in separate spreadsheets | Embedded in the platform, linked to VSM |
| Multi-user real-time collaboration | Partial - conflicts, version confusion | Role-based live collaboration, SSO-ready |
| Strategic KPI traceability | No link from process to strategy | Full traceability from shop floor to KPI |
Built for End-to-End Value Stream Improvement
"We had done several value stream mapping exercises before, but they usually ended as static diagrams in PowerPoint. With LTS Data Point Value Stream Mapping Software, the map became a working system where bottlenecks and NVA activities could immediately be converted into structured improvement actions with clear owners."
Operational Excellence Manager
Industrial Manufacturing Company
"One challenge in our production environment was committing to process changes without fully understanding the impact on flow and lead time. The simulation capability in LTS Data Point Value Stream Mapping Software allowed us to test scenarios in advance and identify delays before implementing changes."
Continuous Improvement Lead
Pharmaceutical Manufacturing Facility
"Many improvement initiatives in our plants were happening in isolation. With LTS Data Point Value Stream Mapping Software, the link between value stream insights, the X Matrix, and breakthrough initiatives helped us clearly connect process improvements to enterprise KPIs."
Head of Operational Excellence
Global Industrial Equipment Manufacturer
Real Results. Measurable Impact
Moving from fragmented VSM tooling to integrated digital Value Stream Mapping system brings consistent visibility, aligned actions, and measurable results.
Reduction in process waste with automated VA/NVA tracking

PCE
Improvement
Process Cycle Efficiency improvements visible across VSM versions
From shopfloor execution to strategic enterprise KPIs

End-to-End Traceability
Full visibility of how every process improvement connects to and impacts key business KPIs

Continuous Improvement Cycles
Regularly updated VSM-driven initiatives ensure sustained optimisation and ongoing performance gains

Multi-Tier Strategic Alignment
Aligned execution across multiple value streams, connecting team-level actions to organisation-wide priorities
Seamless Integration from Existing Data to Measurable Process Improvement
Start with your current data and systems, and move seamlessly into a connected VSM environment that drives analysis, validation, and execution - all in one Value Stream Mapping Software.

Connect
Integrate or import process data from existing tools such as Excel, R&D systems, or operational databases. Establish a structured data foundation for value stream mapping without disrupting current workflows.

Structure
Build digital VSMs with embedded process data, automatically classify VA/NVA/BVA, calculate PCE, and identify bottlenecks. Validate improvements through simulation and connect insights directly to strategic initiatives.

Execute
Translate validated improvements into Breakthrough Plans and Kaizen programmes with defined ownership, timelines, and impact tracking — ensuring execution is aligned, measurable, and continuously improving.
Everything You Need to Deploy and Scale Digital VSM
Data Point Digital VSM is designed for real-world deployment across teams, sites, and functions — with guided onboarding, training, secure hosting, and scalable access that supports long-term adoption.
Implementation & Enablement
- Guided onboarding and implementation support
- Team training for digital VSM adoption
- Setup assistance for existing data and workflows
- Customer success support during rollout
- Adoption support across departments and sites
- Ongoing guidance for continuous improvement use
Enterprise Delivery & Scalability
- Secure cloud hosting and platform maintenance
- Backup and recovery support
- Unlimited users across teams and locations
- Unlimited storage for maps, versions, and records
- Mobile-ready access for distributed teams
- Integration-ready architecture for enterprise systems
Built for Every Team Driving Operational Excellence






Value Stream Mapping Software: The Complete Guide to Lean Transformation and Strategic Process Improvement
Learn how Value Stream Mapping software enables organisations to visualise processes, reduce waste, improve flow, measure performance, manage improvement initiatives, and connect operational changes directly to strategic objectives.
What is the difference between a current-state map and a future-state VSM, and why does building both matter?
Most teams build a current-state map, review it in a workshop, and file it. That is a diagnosis with no treatment plan attached.
The current-state map shows where waste, waiting, and non-value-added activity actually live in your process today. Not where you think they are. Where the data says they are. The future-state map is the commitment: what changes, in what sequence, and what the process looks like when those changes land. Removing a bottleneck in one step can immediately expose a constraint two steps downstream. The future-state map forces that thinking before resources are committed. Without version control sitting across both, you have no way of knowing whether the gap between them is closing. Each saved version becomes a reference point. The improvement is tracked in the map itself, not reported separately in a review deck that nobody connects back to the original findings.
How does VA, NVA, and BVA classification work, and why does BVA cause the most problems?
Value-added is what the customer pays for. Non-value-added is waste. Business value-added is where most classification exercises go wrong.
BVA covers activity that adds no customer value but exists for a legitimate business reason: a compliance check, an internal sign-off, a regulatory inspection. It cannot always be eliminated. But it can almost always be reduced, and it is often sitting in your value stream taking up more time than anyone has formally acknowledged.
Most teams force a binary choice: VA or NVA. When BVA gets classified as NVA, it goes on the elimination list. Some of those activities are legally required. Targeting them wastes improvement capacity and occasionally creates a compliance exposure. When BVA gets classified as VA, it disappears from scrutiny entirely and keeps running at full cost. Automatic three-way classification at each process step, combined with a colour-coded time ladder showing where the highest NVA concentration sits, is what ensures improvement effort goes to what will actually move the PCE rather than what just looks like waste on the surface.
What does simulation actually add to value stream mapping, and when does it matter most?
A future-state map is a hypothesis. Simulation is how you find out whether that hypothesis holds before you commit.
If you are changing batch sizes, consolidating process steps, or adjusting cycle times, the downstream impact on flow is not always intuitive. A change that reduces lead time at step three can create a starvation problem at step five if the output rate now exceeds what downstream capacity can absorb. Simulation surfaces that before anyone moves a machine.
The scenarios need to run against the actual process data already sitting in the map: cycle times, changeover, uptime, batch size. Not a theoretical model built from assumptions. A structured comparison of what each scenario does to flow. You are not finding out the future state does not work after implementation. You are finding out before.
How does breakthrough action planning differ from a kaizen log, and why does it matter for execution?
A kaizen log is a record of what was identified. A breakthrough action plan is a commitment to what will be done about it, by whom, by when, and measured against what.
Most VSM programmes collapse at this point. The output of the mapping session goes into a spreadsheet and gets reviewed quarterly. By then the team that ran the kaizen has moved on and the context behind each action has evaporated.
Breakthrough plans need to be generated directly from VSM findings and managed within the same system:
- Ownership at the individual level, not the team level
- Progress tracked against the original VSM baseline, not a subjective status update
- Each improvement linked back to the strategic objective it was designed to support
The plan should never leave the context that created it. That is the difference between a list of good intentions and an improvement programme that actually closes.
How does Process Cycle Efficiency get calculated, and what does it actually tell you?
PCE is the ratio of value-added time to total lead time across the value stream. If a product spends 40 minutes in active processing and 460 minutes waiting, your PCE is 8%. That means 92% of the time your product is in the system, nothing useful is happening to it.
The number matters less than the trend. A PCE of 12% improving to 19% over six months tells you something real. A PCE of 12% sitting flat for a year tells you your kaizen activity is not reaching the right waste. PCE should be calculated automatically from the process data in each step and tracked across every saved version:
- No manual recalculation between improvement cycles
- Trend visible across versions so improvement is measurable, not assumed
- A drop between versions flags immediately, before it becomes a larger problem to unpick
How does value stream mapping connect to strategy, and why does that connection usually break down?
The mapping exercise happens on the shopfloor. The strategy conversation happens in the boardroom. They are almost never in the same room at the same time, which means lean teams spend months improving processes that are not connected to where the business needs to go, and leadership sets KPI targets with no clear line of sight to the process changes that would actually move them.
This is not a communication problem. It is a structural one.
The fix is a direct link between VSM findings and the X Matrix so that each Hoshin Kanri breakthrough initiative traces back to a specific process-level finding. The shopfloor is not working in isolation. It is working on improvements explicitly connected to the strategic priorities the business has already committed to. That connection is what most lean programmes never achieve, and it is what determines whether a kaizen delivers lasting change or reverts within two quarters
How does version control turn value stream mapping into an ongoing management tool rather than a one-off exercise?
A VSM done in January describes a process that may not exist by June. Headcount changes. Equipment changes. A workaround gets normalised and becomes the new standard. The map becomes wrong quietly, and nobody flags it because no one is comparing it to anything.
A full version history with a complete activity log is what makes continuous improvement measurable rather than anecdotal:
- PCE trend across versions shows whether improvement programmes are actually reducing waste over time
- Previous versions can be compared directly, not reconstructed from memory or meeting notes
- When a process regresses, the history shows exactly when it changed and what the prior state looked like
Without that trail, every VSM session starts from scratch. With it, each session builds on a documented baseline and on what the previous one actually delivered.
How does multi-level VSM work, and when does a single map stop being sufficient?
A single map works when you are looking at one product family through one process route. It stops being sufficient the moment you need to connect what is happening at process level to what leadership is accountable for at organisation level. Most lean programmes never make that connection explicitly.
Structuring value stream mapping across three levels - process, department, and organisation - creates the line of sight that strategy deployment frameworks require but rarely achieve in practice. Each level has its own map, but they are connected within the same system. It also makes it possible to prioritise improvement effort across competing value streams, because the relationship between them is visible rather than managed through separate conversations in separate meetings.
Hear it from our customers

MARC ROBINSON
Director, Global Operational Excellence

“By providing a central location to input, analyse and share our KPIs, 'Data Point' enables site management to more easily focus on the entire business as a team. Its ability to allow automated data entry and trend analysis gives us more time for improvement rather than just reporting numbers. Combined with a disciplined approach within our SQDC meeting process, I believe 'Data Point' will help us continually focus on key issues and drive business excellence in all areas.”