Muda Mura Muri in Manufacturing: How to Identify and Reduce the Three Lean Wastes on the Shopfloor

Last updated on : September 18, 2026
Muda Mura Muri as Toyota describes, is waste, inconsistency and unreasonable demands, and treats eliminating all three as part of improving work. This is important because waste rarely appears alone. For example, overproduction creates waste to pile up, while that excess inventory hides the very scheduling problems that caused it in the first place.
The Lean Enterprise Institute further explains that addressing Muda without the Mura or Muri behind it is more like solving the symptom rather than solving the root cause.
See how LTS Data Point connects shopfloor performance, daily reviews and action ownership to help teams identify recurring waste, unevenness and overburden earlier
What are Muda, Mura and Muri in lean manufacturing?
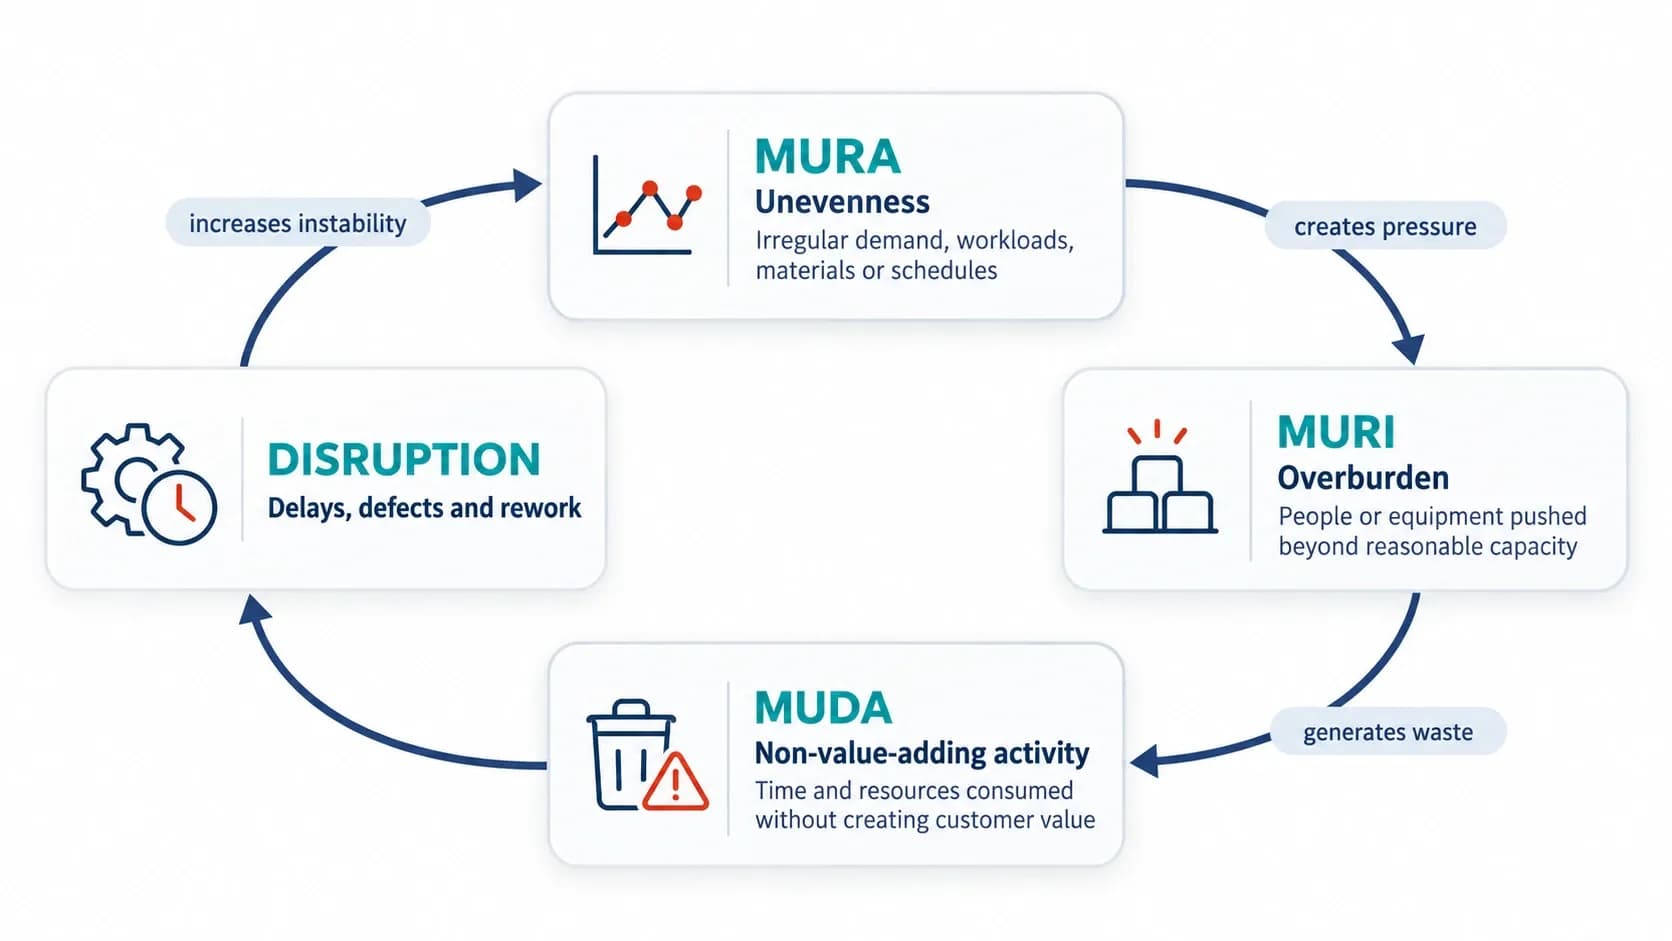
Muda, Mura and Muri are the three interconnected forms of operational waste within the Toyota Production System. Together, they explain why waste appears, what disrupts production flow and what pushes people or equipment beyond sustainable limits.
Muda: Non-value-adding activity
Muda in Lean refers to any activity that consumes time, labour or resources without creating value for the customer.
- Type One Muda cannot be eliminated immediately under current operating conditions
- Type Two Muda can be removed more directly through kaizen
- In lean manufacturing, Muda can include waiting, unnecessary movement, excess inventory, overproduction, defects, transportation and overprocessing
Toyota distinguishes between waste that is visible and the operating conditions that continue to generate it.
Mura: Unevenness in production
Mura means irregularity or unevenness in production. It occurs when demand, workloads, materials or production schedules fluctuate instead of moving at a stable pace.
- Some processes alternate between excessive demand and insufficient work
- Operations may rush during production peaks and wait during quieter periods
- Unstable schedules can pass uneven demand upstream to other processes and suppliers
Muri: Overburden in manufacturing
Muri describes demands placed on people or equipment beyond their reasonable or designed capacity.
- Operators may face an unsustainable pace, excessive physical demands or insufficient time
- Machines may be run beyond their intended load, speed or maintenance limits
- Prolonged overburden can contribute to safety issues, quality problems, defects and equipment failures
What is the difference between Muda, Mura and Muri?
- Muda is work that consumes resources without creating value
- Mura is variation that makes production flow uneven
- Muri is the overburden created when demand exceeds available capacity
A sudden change in the production schedule creates Mura. The resulting workload peak pushes a workstation beyond normal capacity, creating Muri. Rushing, waiting, defects or excess output then emerge as Muda.
Treating Muda, Mura, and Muri as separate categories can hide their causal relationship. Removing visible Muda may produce a temporary improvement, but the waste can return if the unevenness or overburden behind it remains.
Muda Mura Muri examples from the shopfloor
The three conditions rarely stay confined to a single station or process. Seeing what each looks like in practice makes it easier to spot which one is driving a problem and where it's likely to surface next.
Muda examples
Muda examples come first: activities that consume resources without creating customer value.
- Operators waiting for materials, instructions or equipment
- Unnecessary movement between workstations
- Excess work-in-progress inventory
- Producing more than current demand requires
- Rework caused by defects, often addressed at the source through Poka-Yoke
- Repeated handling or transportation
- Processing beyond the required specification
Some Muda cannot be removed immediately under current conditions, while other forms can be addressed directly through kaizen as part of a wider continuous improvement framework.
Mura examples
Mura appears when production volume, workload or material flow becomes inconsistent:
- Production targets change sharply between shifts
- One workstation receives work faster than it can process it
- Large batches create alternating periods of congestion and inactivity
- Staffing levels do not match changes in demand
- Suppliers receive irregular orders because schedules are unstable
This unevenness in production force teams to respond to peaks and valleys instead of maintaining a controlled operating rhythm.
Muri examples
Examples of overburden in manufacturing include:
- Operators working at an unsustainable pace to recover lost output
- Employees lifting or moving loads beyond safe working limits
- Machines running beyond their designed speed or capacity
- Maintenance being delayed to keep the production running
- One process absorbing work that should be distributed across several resources
How one condition creates another
A factory receives a late increase in its production target. The schedule changes abruptly, creating Mura. Operators and equipment are then pushed beyond their normal capacity to recover output, creating Muri. Rushing leads to defects and rework, while upstream teams produce additional inventory as protection against further disruption. These outcomes become Muda.
The sequence can also begin with Muda. Overproduction creates excess inventory, which requires additional storage, movement and handling. That added workload may create Muri, while inconsistent batch availability introduces Mura elsewhere in the process.
These Muda Mura Muri examples in manufacturing show why one visible form of waste rarely tells the whole story. A defect, delay or inventory build-up may be the result of uneven flow or overburden elsewhere. The next step is therefore to recognise the operational patterns that reveal which of the three conditions is driving the problem.
How to identify Muda Mura Muri on the shopfloor
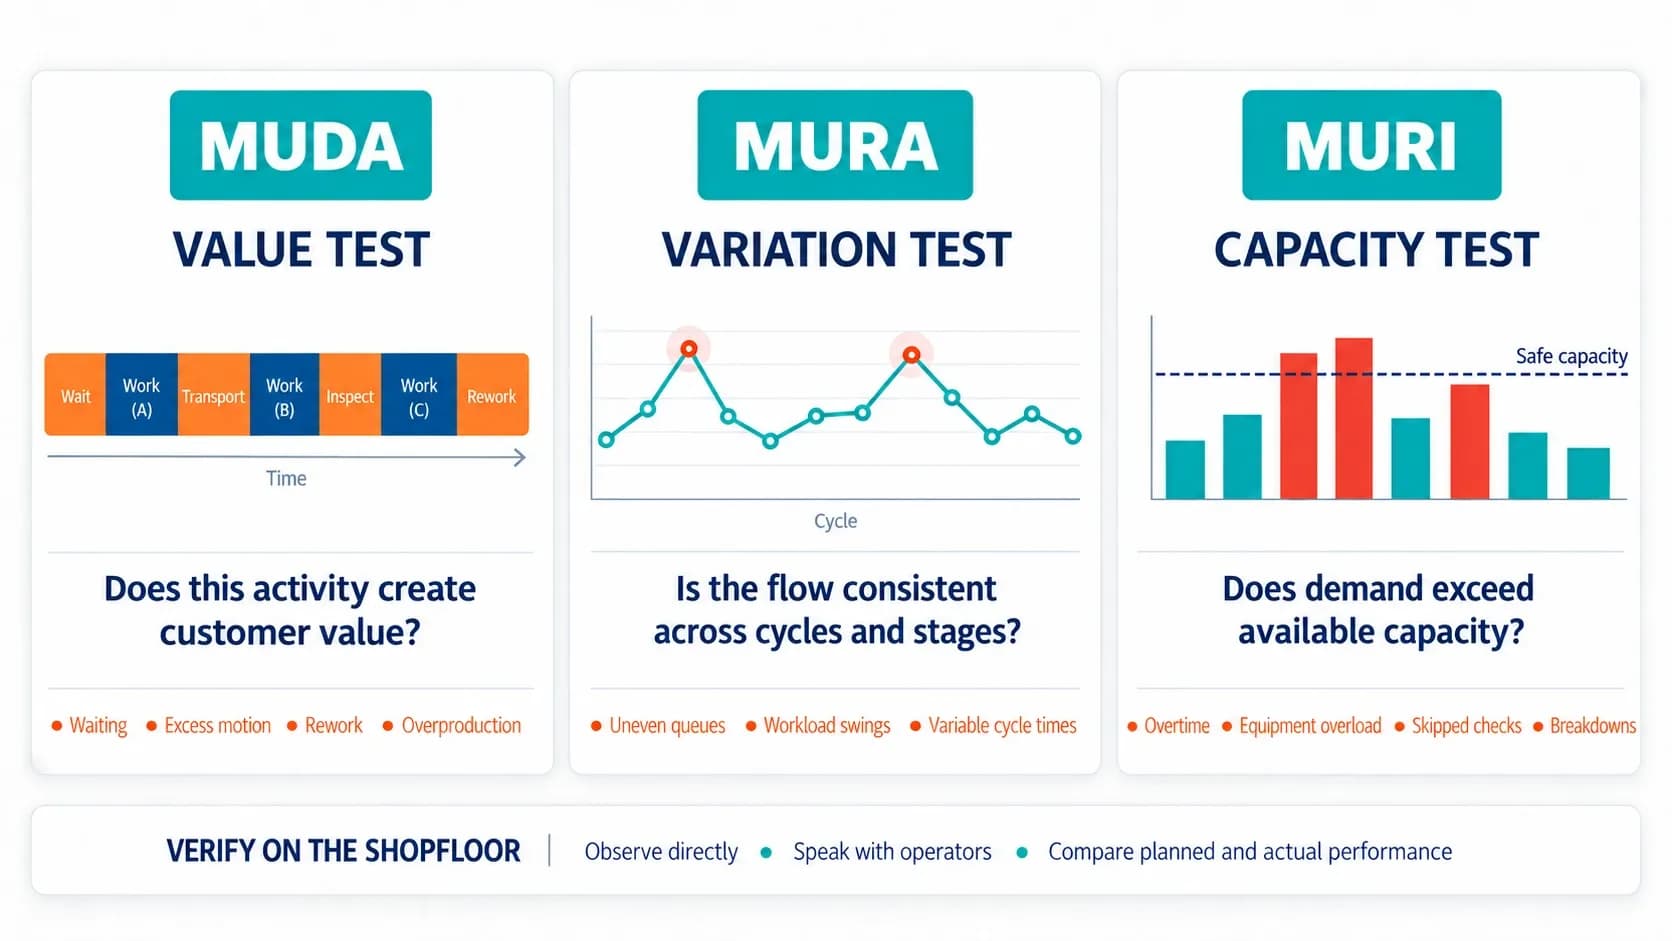
A workstation that repeatedly misses its target looks like a productivity problem. It usually isn't. Look at the wider process and the pattern often reveals work arriving in irregular batches - the station alternates between waiting and processing sudden peaks, forcing operators to rush. The visible Muda sits on top of Mura and Muri underneath it.
Signs of Muda
Resources being consumed without creating customer value.
- Operators or materials waiting between process steps
- Repeated movement, handling or transportation
- Work-in-progress accumulating between stations
- Output produced before it is required
- Defects, rework and duplicated processing
- Tasks performed beyond the customer or process requirement
Signs of Mura
Repeated variation in workload and flow, the kind that turns a steady schedule into irregular batches. A takt time tracker can make this variation visible by comparing actual pace against the rate customer demand requires.
- Teams alternating between rushing and waiting
- Large differences in output between shifts or production periods
- Work accumulating at one process while another remains underused
- Frequent changes to priorities, schedules or production quantities
- Irregular material demand passed to upstream processes or suppliers
Signs of Muri
People or equipment repeatedly expected to exceed reasonable capacity, the rushing that follows once a peak hits.
- Persistent overtime or an unsustainable work pace
- Operators bypassing standard work to meet output targets
- Frequent minor stoppages, breakdowns or maintenance delays
- Quality problems appearing during workload peaks
- Employees, machines or processes carrying a disproportionate load
This is why Lean programmes fail to eliminate waste when they concentrate only on the most visible Muda. Removing one delay, motion or defect may produce a temporary gain, but the problem returns if the uneven schedules and excessive workloads behind it remain. Identifying Muda Mura Muri on the shopfloor means tracking where performance varies, when pressure increases and which forms of waste follow, not simply counting waste events in isolation.
How digital daily management helps reduce Muda Mura Muri
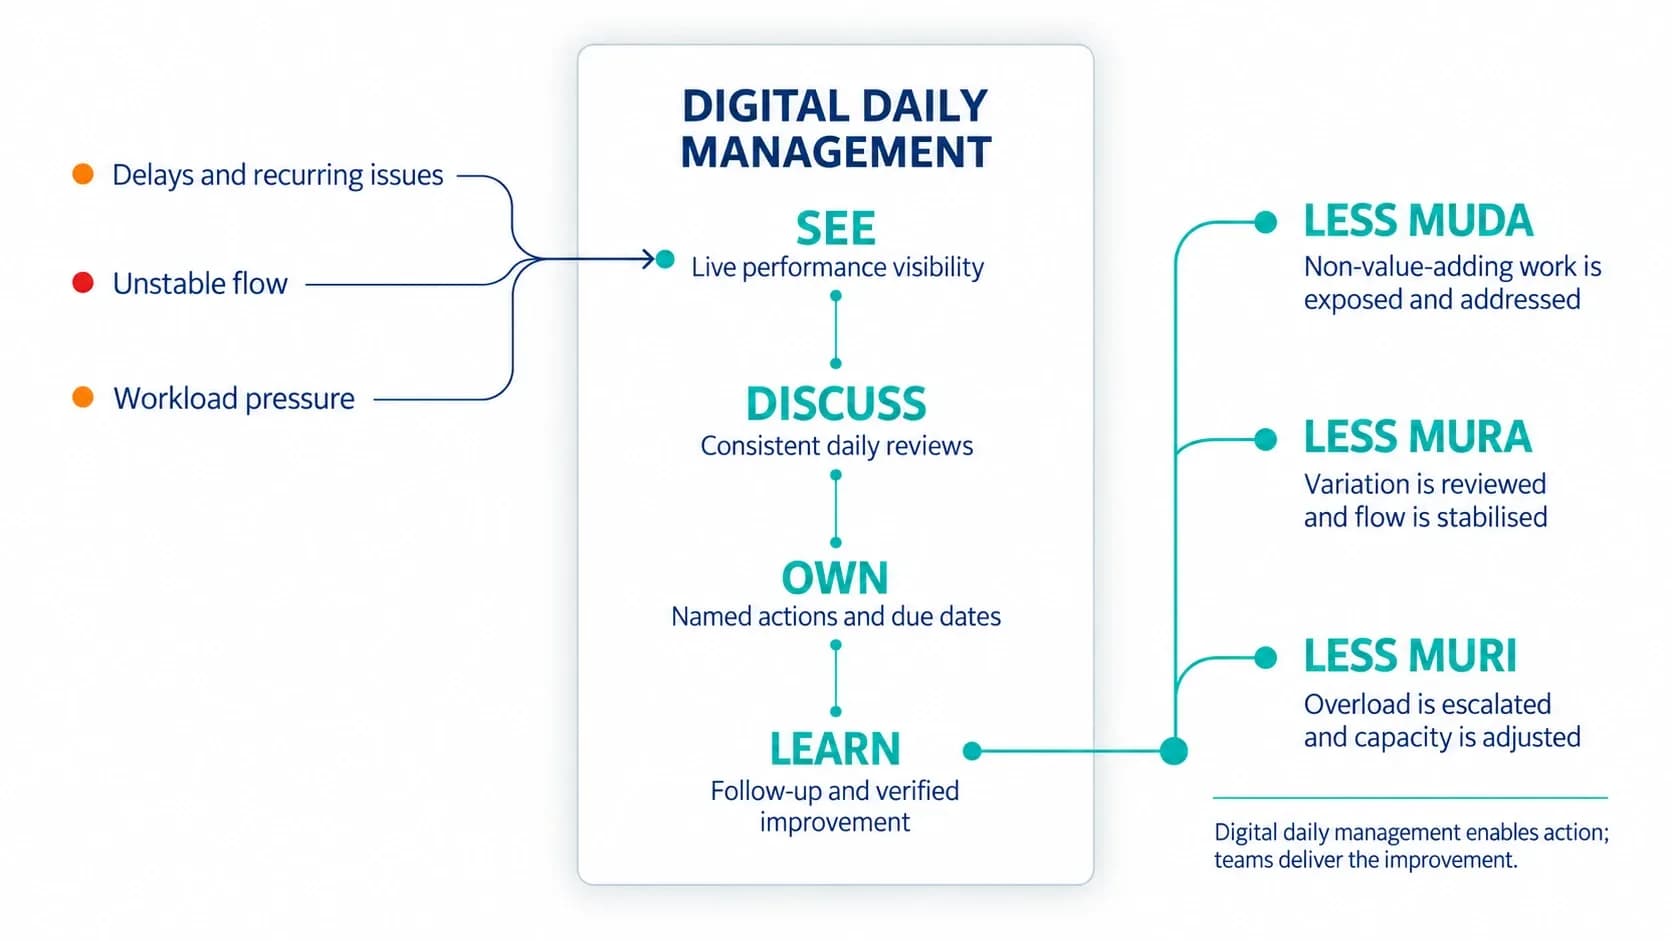
Traditional shopfloor waste identification often depends on what teams notice during a walk, shift review or isolated improvement activity. Digital daily management adds continuity by bringing current performance, recurring variation and corrective actions into the same review process.
Digital daily management helps teams reduce Muda, Mura, and Muri in manufacturing through four connected capabilities:
- Live performance visibility: Current production, quality, downtime and delivery information makes delays, excess output and lost time easier to recognise before they disappear into weekly reporting.
- Trend recognition: Comparing performance across shifts, lines and time periods reveals repeated fluctuations that may indicate Mura rather than an isolated event.
- Structured daily reviews: Teams can examine what changed, where performance moved away from target and whether the same constraint is affecting connected processes.
- Action ownership: Linking an issue to a named owner, deadline and follow-up prevents recurring waste from being discussed repeatedly without resolution.
A line may meet its weekly production target while experiencing sharp variations between shifts. One shift falls behind because of material delays, while the next compensates by increasing pace and extending equipment runtime. A weekly total may conceal both the Mura between shifts and the resulting Muri.
A digital daily management view makes the pattern easier to follow. Teams can compare shift performance, connect the variation with downtime or workload information and assign action against the underlying cause, work that often starts with a Gemba Walk. The purpose isn't simply to display another KPI, but to establish whether the problem is recurring, where it begins and whether the response has worked.
Knowing how to reduce waste in manufacturing requires more than recording individual defects, stoppages or delays. If information is fragmented across spreadsheets, boards and meeting notes, teams may react to each event separately and miss the relationship between uneven flow, overburden and visible waste.
Digital daily management closes that gap by turning shopfloor signals into a consistent cycle of visibility, review, ownership and follow-up. This gives teams a better chance of addressing the conditions that recreate Muda instead of repeatedly correcting the same symptoms.
How LTS Data Point supports shopfloor waste identification and action
LTS Data Point brings operational data from existing systems into one connected daily management environment, giving teams a shared basis for spotting Muda and tracing it back to Mura or Muri.
- One connected view: Production, quality, downtime, delivery and workforce information sit together instead of being reconciled across spreadsheets, whiteboards and reports.
- Shift, cell, line or site-level comparison: A plant-wide average can look stable while individual shifts alternate between missed targets and recovery. Breaking performance down exposes the variation that a broader view of manufacturing process flow can hide.
- Structured daily reviews: Teams examine deviations against the same current data, trace where an issue began using tools like a Fishbone Diagram or RCCM, and escalate it to the right decision level, cutting the delay between a deviation occurring and the right person knowing about it.
- Action tied to outcome: Issues link to owners, deadlines and escalation routes, creating a visible trail from detection to follow-up, so recurring problems get reviewed alongside what’s already been done rather than resurfacing as new ones.
LTS Data Point gives teams the connected visibility, review structure and accountability to recognise how Muda Mura Muri relate, act on underlying causes and confirm whether the fix actually held, extending the same thinking practitioners apply through VSM when mapping flow end to end.
Muda Mura Muri rarely act alone. A delay, a defect or a burst of overtime is usually the visible end of a chain that started with uneven flow excessive demand elsewhere. Spotting the pattern, not just the symptom, is what separates a temporary fix from a lasting one. Daily visibility and structured follow-up turn that recognition into consistent action.
Speak with an LTS expert about improving visibility, strengthening daily management and addressing the conditions that allow waste to return.
FAQs
1. Should Mura or Muri be addressed before Muda?
There is no fixed order, but investigating Mura and Muri first can reveal why visible Muda keeps returning. Stabilising flow and reducing overburden may remove several forms of waste at once.
2. How does Heijunka relate to Muda Mura Muri?
Heijunka levels production by volume and product mix. A more consistent production pattern can reduce unevenness, prevent workload peaks and limit the waste created by batching or excess capacity.
3. Can automation create Muda Mura Muri?
Yes. Automating an unstable or poorly designed process can reproduce waste faster, intensify uneven flow or place new demands on connected equipment and teams. The process should be understood and improved before it is automated.
4. Are Muda Mura Muri relevant to high-mix, low-volume manufacturing?
Yes. Product variation, changing priorities and complex routings can make unevenness and overburden particularly difficult to control in high-mix environments. The aim is not identical work every day, but a manageable and visible flow.
5. Who should be responsible for reducing the Three Ms?
Responsibility should extend beyond a Lean or continuous improvement team. Operators, supervisors, planners, maintenance teams and operations leaders each influence workload, capacity, scheduling and process design.
6. How often should manufacturers review Muda, Mura and Muri?
Immediate abnormalities may need attention during each shift, while recurring patterns can be examined through weekly or monthly trend reviews. The review frequently should match how quickly the process changes and how serious the operational risk is.
7. Can suppliers contribute to Mura and Muri?
Yes. Irregular deliveries, inconsistent quantities or changing lead times can create uneven material flow and place additional pressure on production teams. Manufacturers should also check whether their own fluctuating schedules are passing instability upstream.

Geandra Queiroz, Operations Management Consultant
Geandra is an Operations Management Consultant at Lean Transition Solutions, specialising in Lean philosophy, Lean Six Sigma, and strategic planning across manufacturing and healthcare. She is currently completing her PhD in Industrial Engineering at the Federal University of São Carlos, researching the integration of Operations Strategy, Lean, and Green Manufacturing.