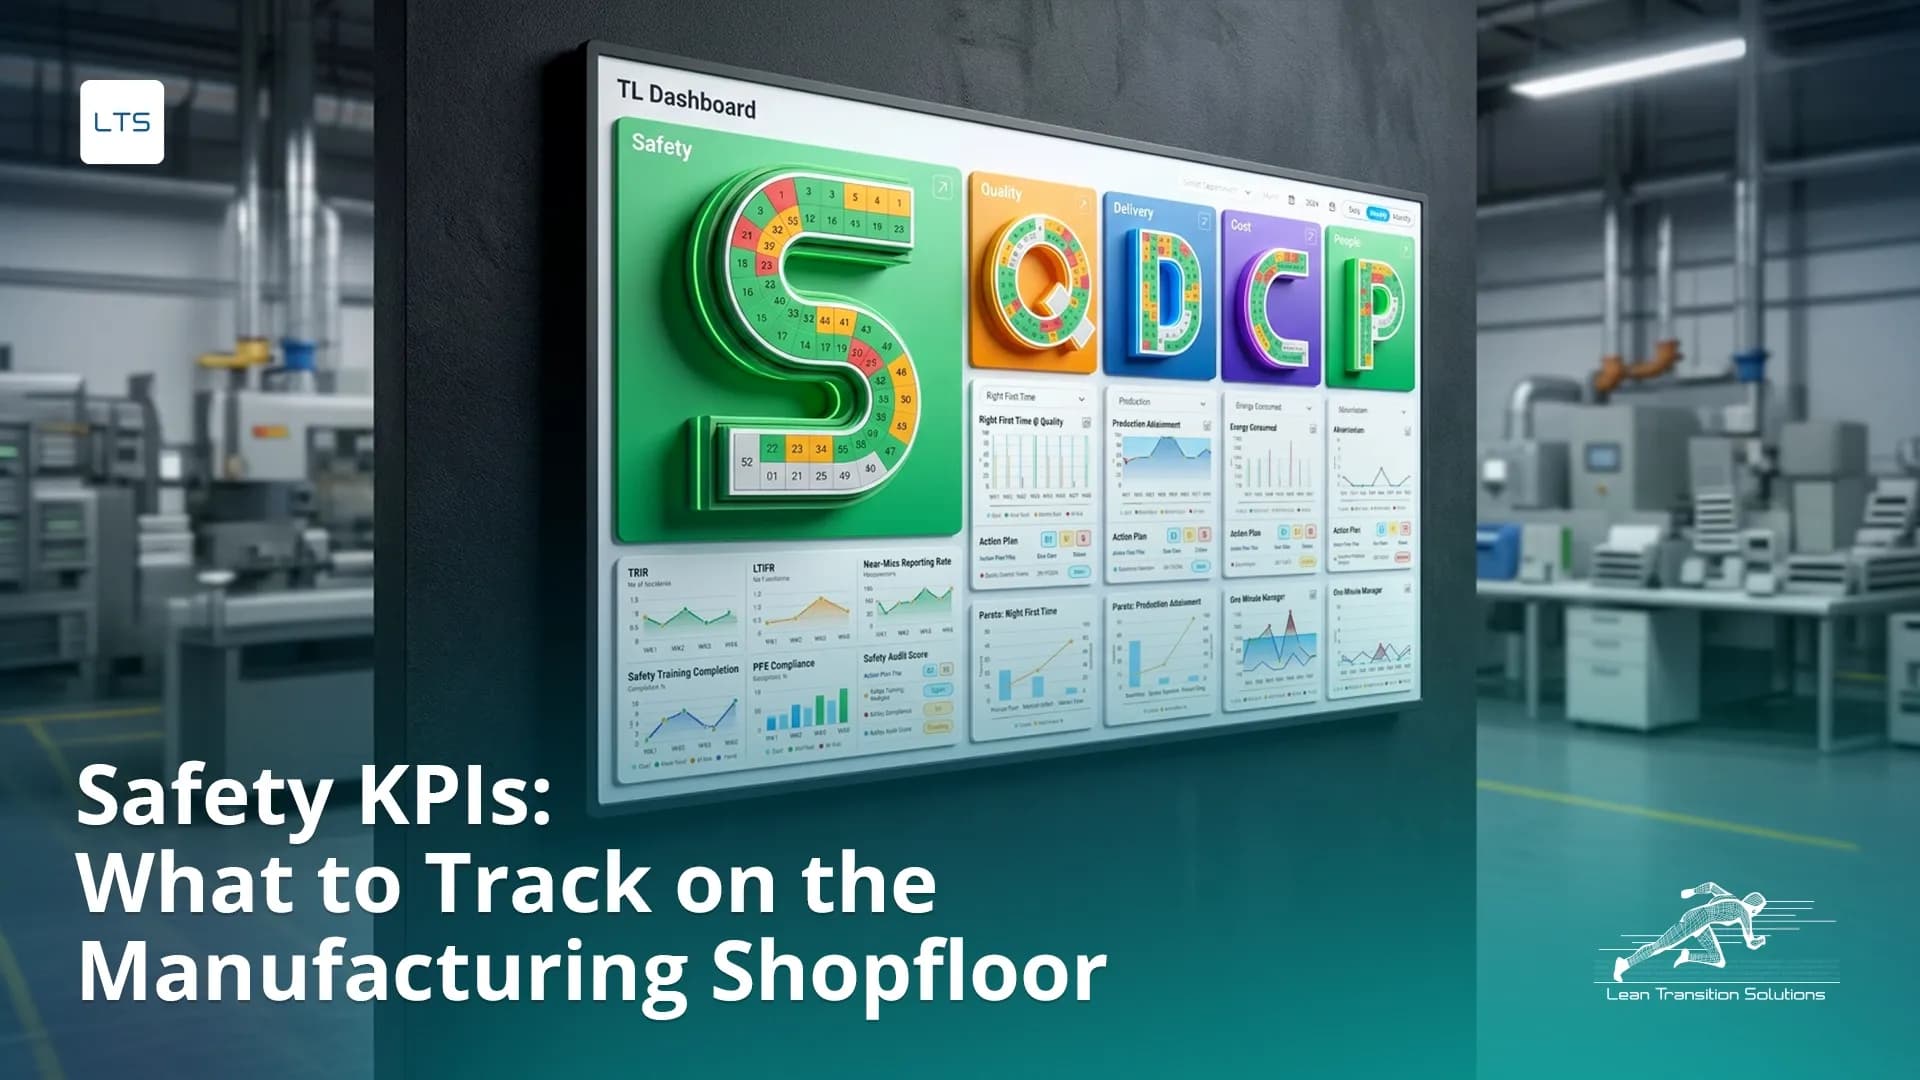
Safety KPIs: The Shopfloor Metrics That Actually Prevent Incidents - Not Just Record Them
Last updated on : May 5, 2026
I tracked several safety KPIs and still my company is facing safety issues. Why?
If this question resonates with you, then you're not alone.
Most organisations monitor safety KPIs (HSE KPIs) but not everyone tracks the right ones. Your data on safety KPIs may look acceptable and foolproof – while your workplace is more exposed to safety issues than the numbers suggest. This is because most workers systematically under-report near misses – resulting in mismatch between recorded numbers and observed numbers.
Unreported near misses don’t disappear – they accumulate.
The cost of ignoring it is real – lost working days, regulatory intervention, insurance pressure, and a serious incident that a better metric could have flagged weeks earlier.
See how LTS Data Point brings your safety KPIs to life on a single connected dashboard
What are safety KPIs?
Safety KPIs are not a list of things that went wrong. They are a system for making sure fewer things go wrong. It becomes useful only if it tells someone what to do next.
Most operations get this wrong.
Consider a site manager in a manufacturing industry who tracks fourteen safety metrics every month. Of these, twelve capture incidents that have already happened. Only two of them measure if these past incidents actually are under control.
The gap is the problem.
This shows the cost of choosing safety metrics instead of safety KPIs.
- Safety performance indicators are measurable metrics used to set objectives, maintain a safe workforce, and analyse the performance of safety initiatives.
- They function as benchmarks to track progress, identify trends, and support informed risk decisions.
- Safety KPIs measure not only the past events or lagging safety indicators but should equally measure leading safety indicators.
Reporting safety incidents and activities accurately is not enough either. It should also point to the person responsible for tracking these. Safety boards that clutter without tracking accountability will never drive action.
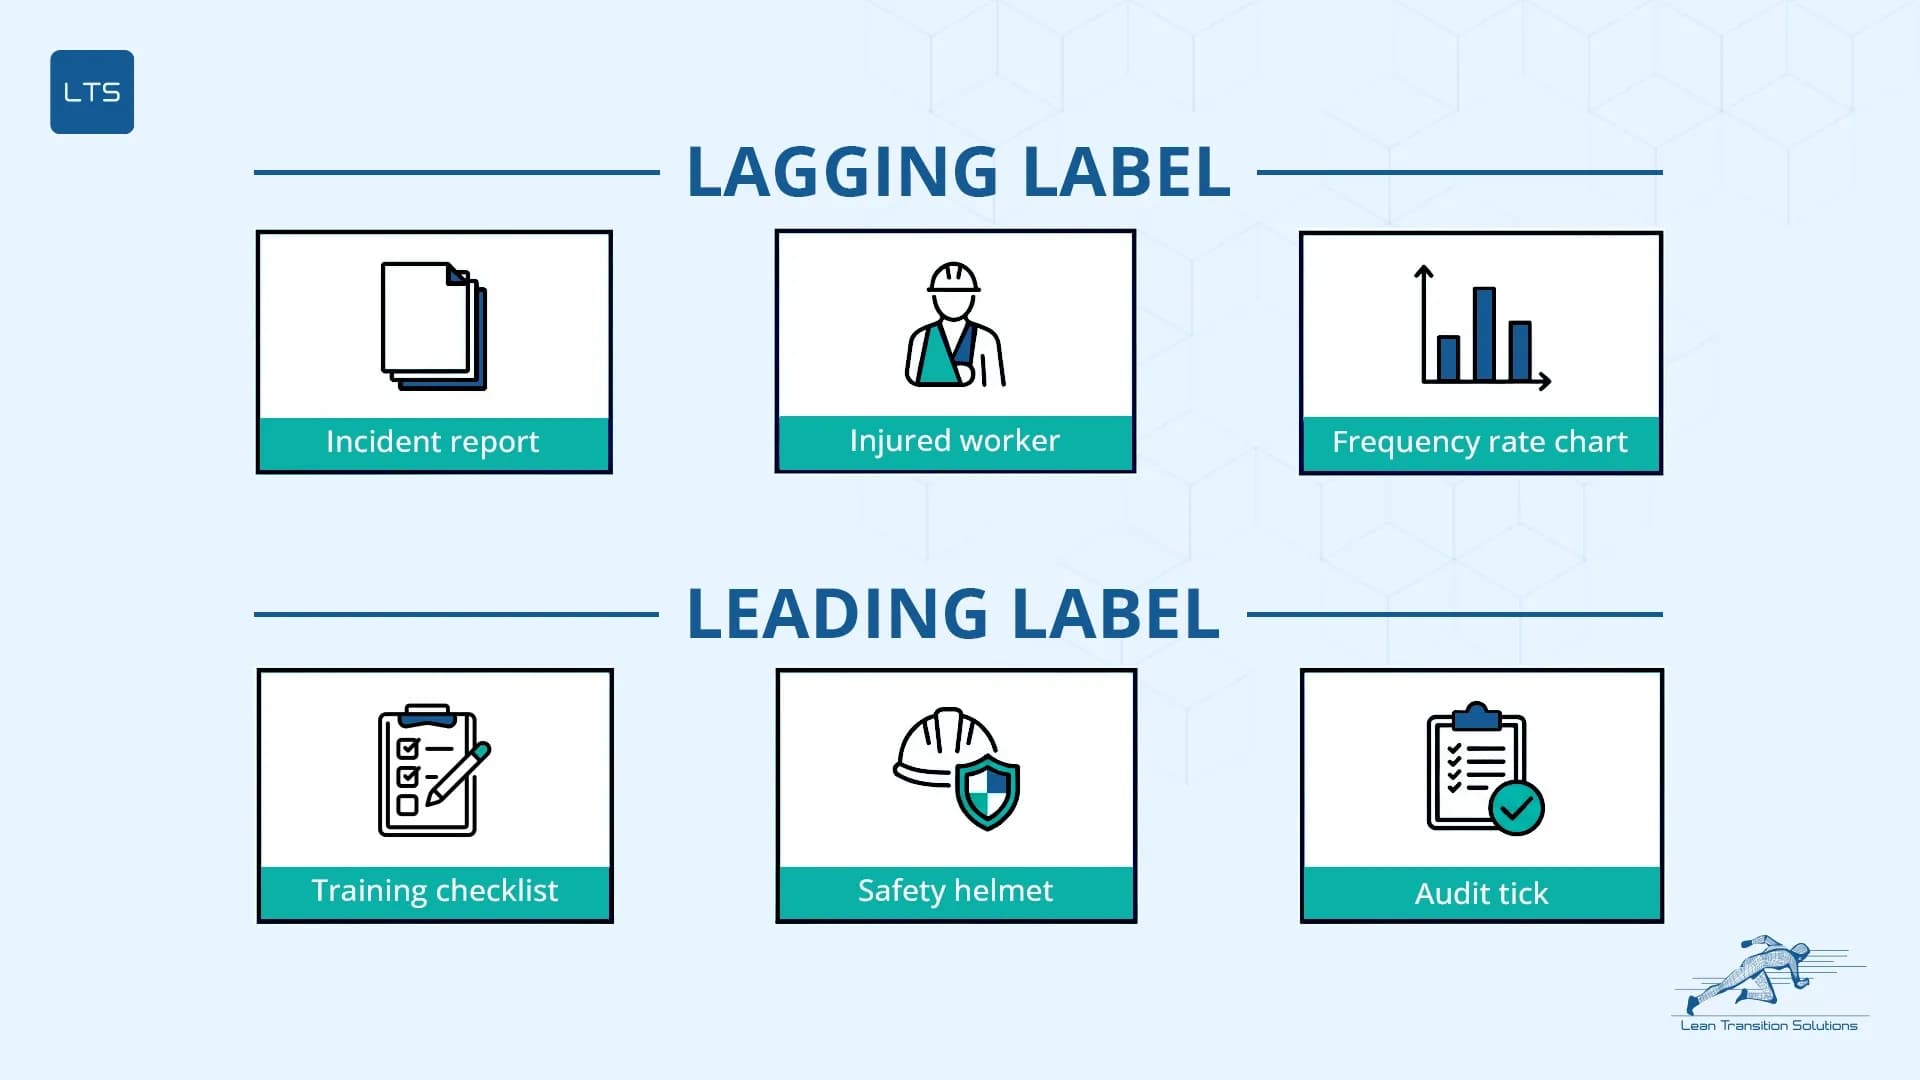
Lagging vs leading indicators: Why the difference matters
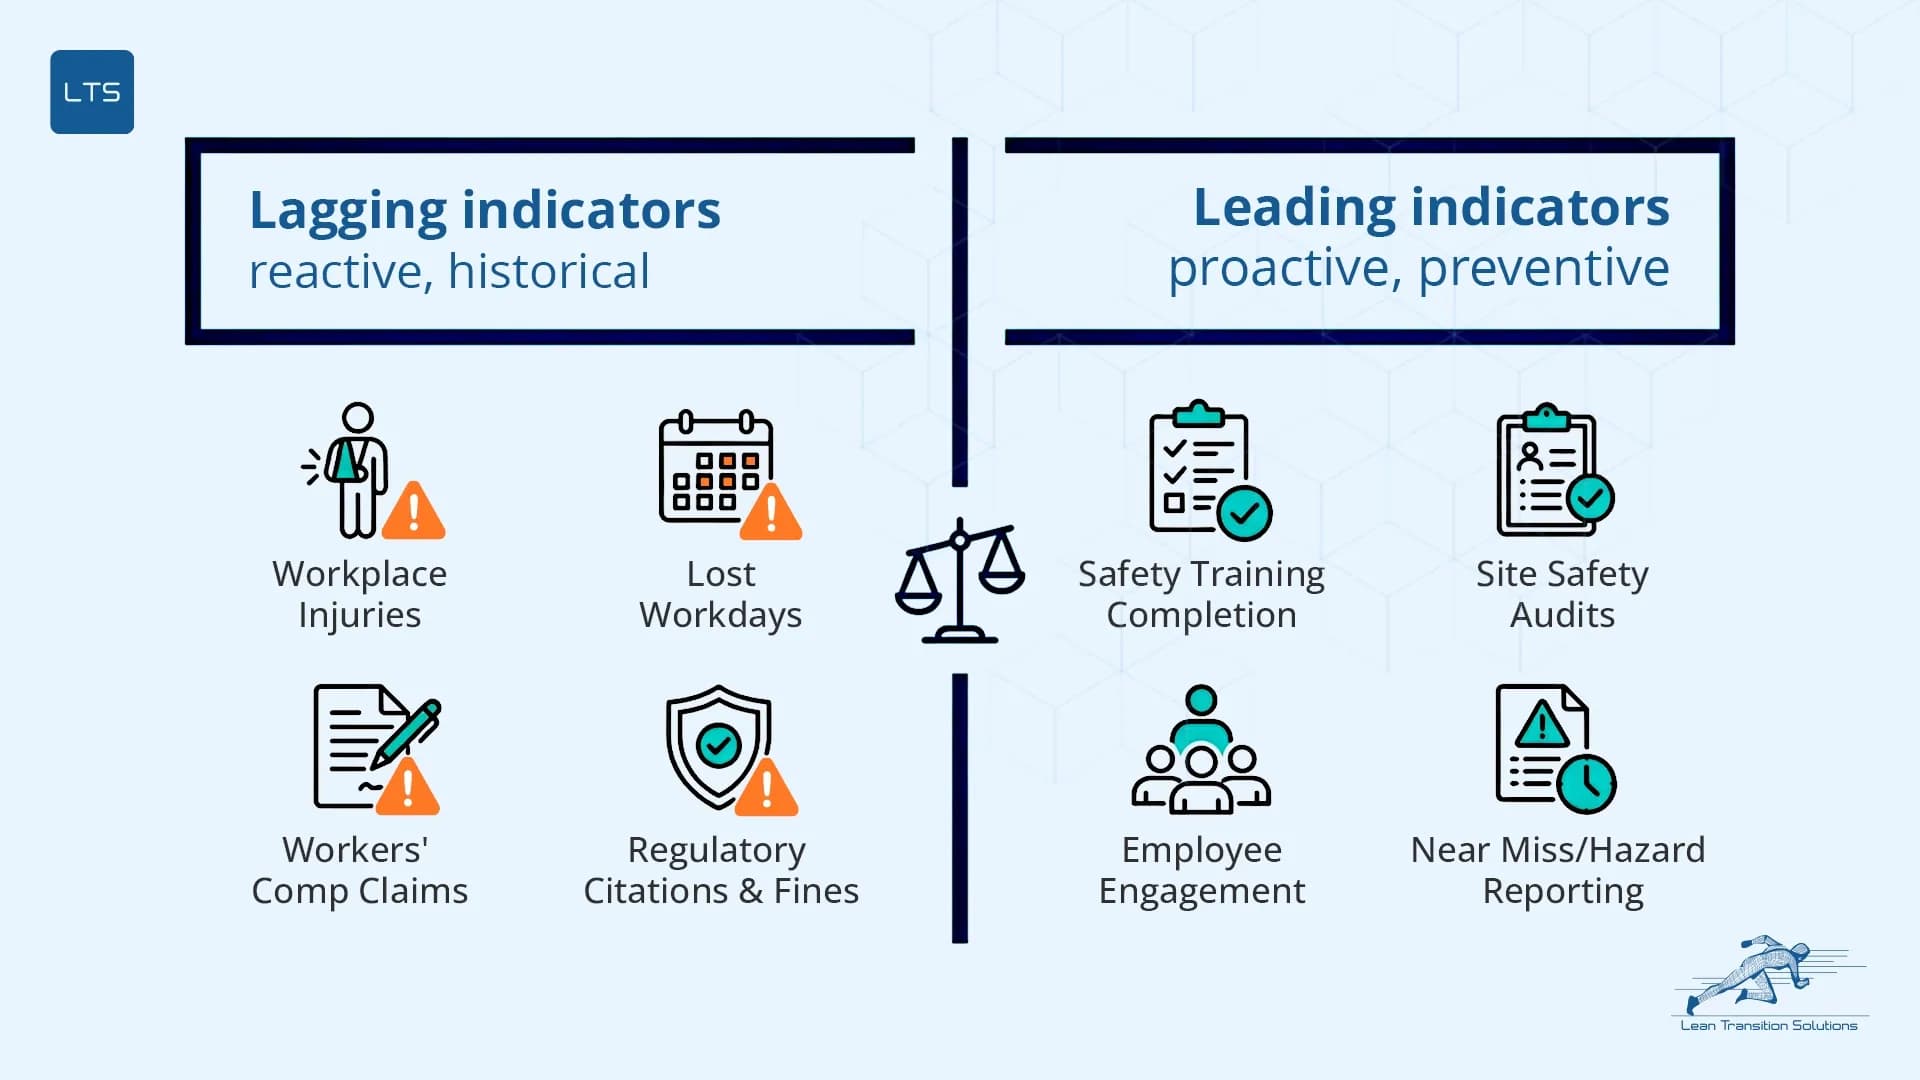
Several companies keep track of safety outcomes after an incident has already occurred – including number of injuries, lost workdays, worker’s compensation claims, and regulatory fines. These lagging indicators are reactive, historical and easy to measure.
Leading indicators, on the other hand, are proactive, preventive measures that include frequency of safety training, number of audits conducted, employee participation in safety programmes, and timeliness of hazard reporting. Leading indicators provide insight before incidents occur.
The trick isn’t choosing one over the other. It is choosing both in a balance.
Consider a plant manager who tracks lost time injury frequency rate (LTIFR). The report shows a clean record, where the LTIFR holds steady at zero for six months. Three weeks later, a machinery incident puts two workers off-site. The lagging number looked perfect. But the leading indicators were never checked.
When the frequency of near-miss reporting increases and the incident rates are falling, it means that corrective actions are working. But if the frequency of near-miss reporting rises while incident rates remain high, it indicates that the safety system is detecting problems without fixing them.
An operation that only keeps an eye on lagging indicators is always one step behind. By the time the safety performance metrics move, the cost is already paid.
The core safety KPIs to track
Not all health and safety KPI examples you find online carry the same weight – some tell you what happened, others tell you what is about to. A balanced set of safety KPIs gives a manager a record of what went wrong. It also signals what is building toward the next incident.
Safety KPIs in manufacturing track workplace safety – one of the most critical categories within the broader set of manufacturing KPIs every operation should monitor. Some of the key metrics include lost-time injury frequency rate, incident rate, near-miss reporting, and compliance with safety training. Each one serves a different purpose.
Lagging safety KPIs
1. Total recordable incident rate (TRIR)
- Why it matters: Measures all recordable workplace incidents per 200,000 hours worked – the standard benchmarking metric used across industries. Unlike the accident frequency rate, which counts incidents per million hours worked, TRIR uses a smaller base making cross-industry comparison more accessible.
- How to calculate: TRIR = (Number of recordable incidents x 200,000) / Total hours worked
2. Lost time injury frequency rate (LTIFR)
- Why it matters: Tracks injuries serious enough to result in at least one lost workday. It helps spot patterns in severe incident types.
- How to calculate: LTIFR = (Number of lost time injuries x 1,000,000) / Total hours worked
3. Near-miss reporting rate
- Why it matters: A rising near-miss rate signals a strong reporting culture – not a dangerous one. Low reporting is the real warning sign.
- How to calculate: Near-miss reporting rate = (Number of near misses reported / Total hours worked) x 200,000
Leading safety KPIs
4. Safety training completion rate
- Why it matters: Tracks whether the conditions for safe work are being actively maintained before incidents occur.
- How to calculate: Safety training completion rate = (Number of employees who completed training / Total employees required to train) x 100
5. PPE compliance rate
- Why it matters: Monitors adherence to personal protective equipment requirements on the shopfloor – a direct indicator of behavioural safety culture.
- How to calculate: PPE compliance rate = (Number of compliant observations / Total observations conducted) x 100
6. Safety audit score
- Why it matters: Evaluates whether safety controls, procedures, and conditions meet required standards across the operation.
- How to calculate: Safety audit score = (Number of compliant audit items / Total audit items checked) x 100
How industry hazards shape your safety KPI priorities
Company A uses this set of safety KPIs, and company B uses that set of safety KPIs. Should I use what they use, or do I have to have my own set?
If this question popped up in your head, then you’re on the right track. Instead of a generic answer, here’s what it looks like in practice.
Chemical manufacturing industry
A chemical plant’s TRIR remains stable. But three pressure deviation incidents go unrecorded in the same quarter. When checked, the lagging number looks perfect, while the process safety indicators tell a whole different story.
To solve this issue, they focused on a set of three health and safety KPIs:
- Permit-to-work compliance rate – Leading safety indicator
- Process deviation rate – Lagging safety indicator
- Exposure incident rate – Lagging safety indicator
Electronics manufacturing industry
An electronics assembly facility tracks TRIR monthly. The incident rates look stable when checked. Meanwhile, workers keep reporting wrist and shoulder pain for two quarters. None of them were recorded as lost-time injuries. The ergonomic observation rate would have flagged it in week three, but the lagging KPI missed it entirely.
Safety KPIs they prioritised to solve this mismatch:
- Ergonomic observation rate – Leading safety indicator
- Safety training completion rate – Leading safety indicator
- Electrical safety inspection completion rate – Leading safety indicator
Energy production industry
An energy plant’s safety audit scores remain at 94%. But the equipment inspection completion shows only 71% over the same timeframe. This shows that the audit score measures past compliance. The inspection rate is what predicts the next possible failure.
Safety KPIs the plant must focus on, to fix this issue:
- Equipment inspection completion rate – Leading safety indicator
- Environmental incident rate – Lagging safety indicator
- Near-miss reporting rate for process deviations – Leading safety indicator
Construction manufacturing industry
A structural fabrication facility records zero lost-time injuries across six months. Corrective action closure time averages 23 days. This means that the detected hazards remain open for nearly a month. The lagging number appears perfect. The leading indicator tells the truth.
The plant should focus on the following safety KPIs to remedy this issue:
- Near-miss reporting rate – Leading safety indicator
- Corrective action closure time – Leading safety indicator
- Incident rate per 100,000 hours worked – Lagging safety indicator
Choosing the wrong safety KPIs does not just mean missing data. It means people responsible for preventing incidents are looking at the wrong numbers.
Aligning your safety KPI set to your actual hazard profile is what turns a safety dashboard into a prevention tool.
How LTS Data Point helps you act on safety KPIs
So, I found the right set of safety KPIs. Now what?
Keeping an eye on the right set of health and safety KPIs is only half the job. The other half is making sure someone acts on them. Most platforms stop at the first half.
A safety KPI without an assigned owner and a tracked action is just a number on a screen. This is where shopfloor accountability becomes the missing link between observing safety KPIs and actually improving them.
LTS Data Point has a different approach. It does not simply display safety KPIs – it links each one to an owner, a deadline, and a corrective action.
What LTS Data Point offers:
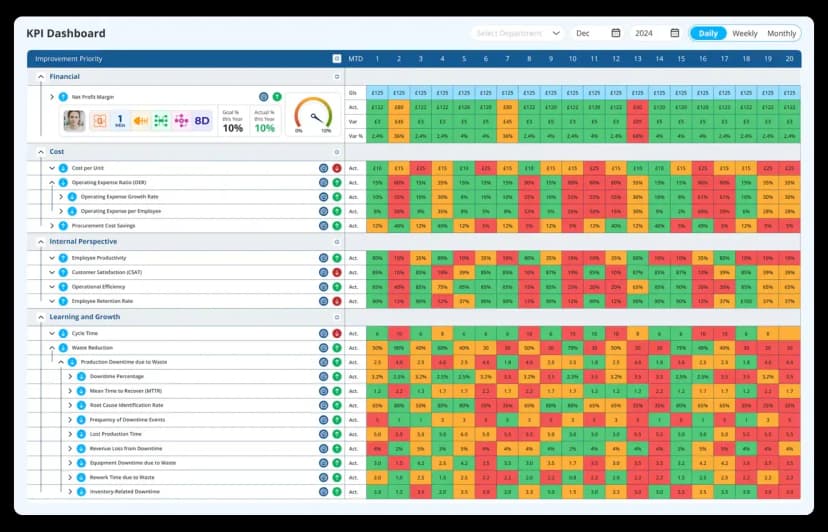
- Safety KPI tracking: Covers Safety as a core KPI category, with RAG indicators, tiered visibility, and every KPI linked to an owner, deadline, and corrective action. All safety data surfaces on a live safety KPI dashboard – visible to every tier from operator to board.
- Daily management frameworks: Supports SQDCP, SQDCM, SQDCL, SQDCPS and other S-first frameworks where Safety sits as the first pillar – with live visual boards running from shopfloor (Tier 1) through to leadership (Tier 3)
- Safety Point: An integrated LTS digital tool built specifically for safety KPI tracking. It sits alongside the core platform as part of the connected system.
- 4C escalation workflow: Every safety action follows a Concern, Cause, Countermeasure, Confirmed sequence – fully traceable, with assign, track, escalate, and close functionality and a complete audit trail – making KPI tracking fully accountable across every shift.
See how one manufacturer put Safety first: An Automobile Manufacturer’s Path to Excellence Using SQDCP Boards
The right safety KPIs do not just measure what happened – they shape what happens next.
Safety KPIs are not a compliance exercise. They are the earliest signal your operation has that something is about to go wrong. The shift from recording incidents to preventing them starts with monitoring the right metrics – and making sure every number has an owner.
Not sure which safety KPIs fit your operation? Speak to an expert at LTS Data Point
FAQs
1. How often should safety KPIs be reviewed?
Safety KPIs should be reviewed at multiple intervals – leading indicators such as near-miss reporting and training completion daily or weekly, and lagging indicators such as TRIR and LTIFR monthly. The review frequency should match the speed at which the risk can change on your shopfloor. A weekly huddle using an S-first framework like SQDCP keeps safety visible at every tier.
2. How many safety KPIs should a manufacturer track?
There is no universal number, but most operations perform best with three to six safety KPIs – enough to cover both lagging outcomes and leading conditions without creating data overload. Tracking too many dilutes focus and makes it harder to assign clear ownership. Start with TRIR and two or three leading indicators most relevant to your specific hazard profile.
3. Who is responsible for tracking safety KPIs in a manufacturing organisation?
Ownership depends on the tier – frontline team leaders typically track daily leading indicators such as PPE compliance and near-miss reports, while safety managers and operations lead own the monthly lagging metrics. What matters is that every KPI has a named owner.
4. What should you do when a safety KPI consistently underperforms?
Consistent underperformance on a lagging KPI is a signal to investigate the leading indicators first – if TRIR is rising, check whether safety training completion, audit scores, and near-miss reporting have also shifted. A structured corrective action process such as the 4C workflow helps teams move from identifying the problem to closing it with a traceable action.

Geandra Queiroz, Operations Management Consultant
Geandra is an Operations Management Consultant at Lean Transition Solutions, specialising in Lean philosophy, Lean Six Sigma, and strategic planning across manufacturing and healthcare. She is currently completing her PhD in Industrial Engineering at the Federal University of São Carlos, researching the integration of Operations Strategy, Lean, and Green Manufacturing.