Balanced Scorecard Software That Turns Strategy into Accountability
Most BSC tools measure performance. LTS Data Point Digital Balanced Scorecard closes the loop, from strategy map to KPI tracking, root cause investigation, and structured action plans, in one connected cloud platform.
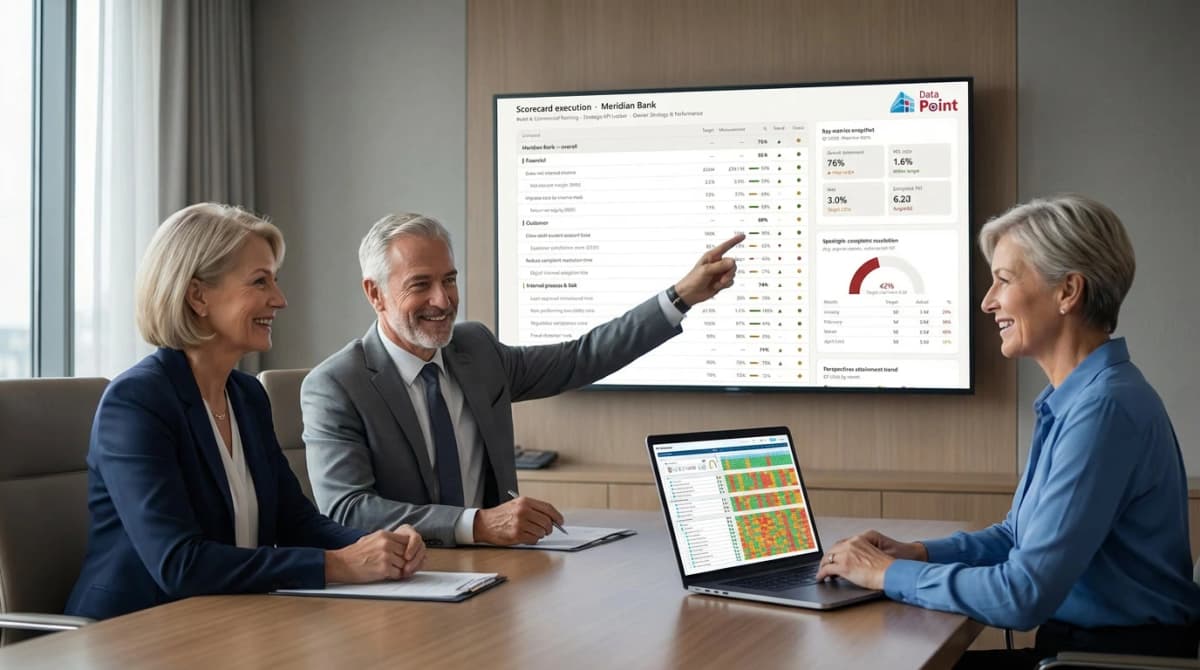
Live KPI Scorecard - Bowler Chart View
Real-time bowler chart scorecard view - daily, weekly, and monthly KPI tracking across all four BSC perspectives, with automatic RAG status and variance tracking built in.

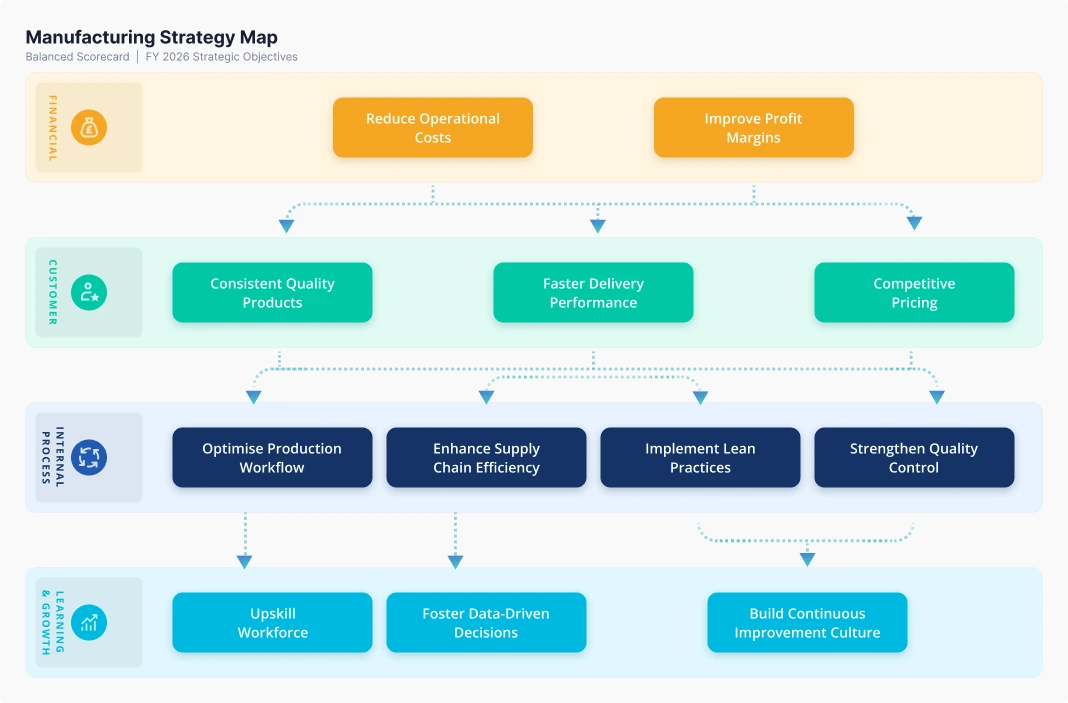
Four Perspectives. One Strategic Truth.
The Balanced Scorecard software works because it connects the four perspectives - financial outcomes to the customer, process, and people drivers that create them. Data Point makes every connection live, visible, and actionable.
Financial

Are we creating value for stakeholders? Gain a real-time view of financial performance, linking operational activities directly to profitability, efficiency, and long-term value creation.
Customer

How do our customers experience us? Understand customer outcomes in real time, connecting service performance and engagement metrics to retention, growth, and market positioning.
Internal Process

Where must we excel operationally? Visualise how processes perform on the ground, with every deviation automatically tied to structured problem-solving and continuous improvement workflows.
Learning & Growth

Can we sustain and improve? Build the capabilities behind performance by making workforce development, engagement, and innovation measurable and actionable across teams.
Five Capabilities. One Connected BSC Platform.
Every capability in Data Point Balanced Scorecard software feeds the next. Your strategy map drives KPI targets, underperforming KPIs trigger root cause investigations, and investigations become tracked action plans. No gaps, no separate tools.
Strategy Map Builder
Build a live, interactive strategy canvas that places your objectives across all four BSC perspectives and draws the cause-and-effect relationships connecting them. Your strategy map in Data Point is never a static slide - it reflects live performance, always.
Key Capabilities
- Drag-and-drop objective placement across four BSC perspectives
- Live cause-and-effect linkages, with objective health visible at a glance
- Objective status automatically reflects connected KPI performance
Data Point BSC Software vs Disconnected BSC Systems
A direct comparison of fragmented, spreadsheet-based BSC management and the integrated execution capabilities of the Data Point platform.
| Capability | Traditional Approach | Data Point Balanced Scorecard software |
|---|---|---|
| Live strategy map with objective health | Static PowerPoint, out of date before it is presented | Live canvas connected to real KPI status |
| Bowler chart scorecard and RAG tracking | Manually updated spreadsheets before every review meeting | Bowler chart view with automatic RAG, daily, weekly, and monthly |
| ERP & CRM data integration | Weekly exports, copy-paste, version conflicts | Direct integration, live data into KPIs automatically |
| Built-in root cause analysis | Diagnosed in meetings, recorded in email chains | Structured in-platform workflow linked to the KPI |
| KPI-level action plans | Managed in separate tools, disconnected from strategy | Embedded in scorecard, linked to objectives |
| Objective flowchart & line of sight | Exists only at board level, teams have no visibility | Full cascade - board to team, live and connected |
| Automated board reporting | Days of manual compilation before every meeting | Auto generated from live scorecard, always accurate |
| Multi-user real-time collaboration | Shared files, version confusion, siloed updates | Role-based live access with SSO support |
Built for Leaders Who Are Accountable for Results, Not Just Reports

For the first time, our leadership, board, and management operate from the same strategic view with the help of Balanced Scorecard software. Every KPI has an owner. Every underperforming metric has an investigation attached to it. We stopped spending board meetings arguing about whether the data was right and started using that time to make decisions.
Strategy & Performance Director
Global Enterprise Organisation
We cut our weekly performance reporting time by 60%. What used to take three people half a day now happens automatically.With LTS Data Point BSC software Our branch managers finally have one place to see what's working and what isn't - in real time. The accountability it created was something we didn't expect. Teams started owning their numbers. Escalations dropped. Decisions that used to wait for the monthly review are now made the same week the problem appears.
Operations Manager
Retail Banking Group
We were worried it would take months to get our teams on board. It didn't. Within a week, staff were updating their own dashboards without any support calls. What made the difference was that the system was set up around how we actually work - our terminology, our KPIs, our workflows. As we expanded to two more departments, the configuration just scaled with us. No new training, no disruption. It felt like it was built for us. Now the Balanced Scorecard software is an inevitable tool for us.
Head of Service Operations
NHS Foundation Trust
Connect strategy, KPIs, and teams in one BSC platform !
Get startedReal Results. Measurable Impact.
Moving from spreadsheet-based BSC management to an integrated strategy execution Balanced Scorecards software delivers consistent visibility, clear ownership, and strategic accountability at every level.
Board reports generated automatically from live scorecard data, with no preparation time, no version conflicts, and no last-minute data chasing.
Every objective, KPI, owner, and action plan visible from board to team in one live platform, with nothing hidden in a spreadsheet or email thread.
Every red KPI has a documented investigation and a structured resolution path, with no more strategy reviews that produce observations but no decisions.
RAG status calculated automatically as data flows from your ERP, CRM, and operational systems, with no weekly update cycle and no stale scorecards.
Every KPI has an owner. Every action plan has a deadline. Every leader knows exactly what they are responsible for delivering, and whether they are on track.
From board-level objective to team-level KPI, every level of the organisation is connected and every owner aligned to the same strategic direction.
From Strategy Document To Live Accountability - In Days
LTS Data Point Balanced Scorecard software is designed for fast deployment. Most organisations have their first live strategy map and KPI scorecard running within days, not months of implementation.


Map Your Strategy
Build your four-perspective strategy map, define objectives, and draw cause-and-effect relationships with BSC software. Your strategy becomes a live canvas, not a static slide.
Connect & Track KPIs
Attach KPIs to objectives, set targets, assign owners, and connect your ERP and CRM data sources. RAG status updates automatically from day one.
Investigate & Act
When a KPI underperforms, launch a root cause investigation within the platform. Convert findings into structured action plans with owners and deadlines.
Report & Improve
Generate automated board reports from live data. Track action plan completion. Measure improvement. Close the loop between strategy and results, continuously.
Everything You Need to Deploy and Scale Your Balanced Scorecard software
Data Point is designed for real-world enterprise deployment, with guided onboarding, secure cloud hosting, unlimited scalability, and customer success support built in from day one.
Implementation & Enablement
Everything you need to get your Balanced Scorecard software live and adopted across your organisation.
- Guided onboarding and strategy map setup support
- Team training for BSC platform adoption at every level
- KPI configuration and data integration setup assistance
- Customer success support during rollout and beyond
- Adoption support across divisions, departments, and sites
Enterprise Delivery & Scalability
Secure, scalable, and built for enterprise-grade strategy management at any scale.
- Secure cloud hosting, backup, and platform maintenance
- Unlimited users across teams, divisions, and locations
- Mobile-ready access for distributed leadership teams
- SSO and role-based access control across the enterprise
- Integration-ready architecture for ERP, CRM, and BI systems
Who Uses LTS Data Point
Designed for every leader accountable for strategic performance
Balanced Scorecard software serves every role in the strategy execution chain, from the CEO setting direction to the department head delivering it.


Ready to run your strategy review differently?
One BSC platform for your organisation. No spreadsheets, no manual prep, no gap between your strategy and your results.
Book a Personalised Demo
Run your Balanced Scorecard on a platform built for it
Fill out the form below to see how Data Point connects your strategy map, KPI tracking, and action plans in one live platform — built for teams that need real accountability, not just reports.

Get Started
Customer Testimonials

MARC ROBINSON
Director, Global Operational Excellence

“By providing a central location to input, analyse and share our KPIs, 'Data Point' enables site management to more easily focus on the entire business as a team. Its ability to allow automated data entry and trend analysis gives us more time for improvement rather than just reporting numbers. Combined with a disciplined approach within our SQDC meeting process, I believe 'Data Point' will help us continually focus on key issues and drive business excellence in all areas.”