AI Workplace Safety: Why Most Incident Data Still Arrives After the Injury, Not Before It
Last updated on : August 14, 2026
In a documented heavy manufacturing scenario, near-miss events were always reported and logged in correctly by the safety manager in the existing tracking system. But the issue was with the prediction. The safety manager couldn't do it.
The incidents kept happening. Every incident was reported and logged perfectly. Every incident was solved after it happened. But no one could predict it and prevent it.
See how LTS Data Point turns your existing Safety KPI dashboard into a system that catches patterns before they become incidents
Your safety dashboard is doing exactly what is should. Here's the layer about it
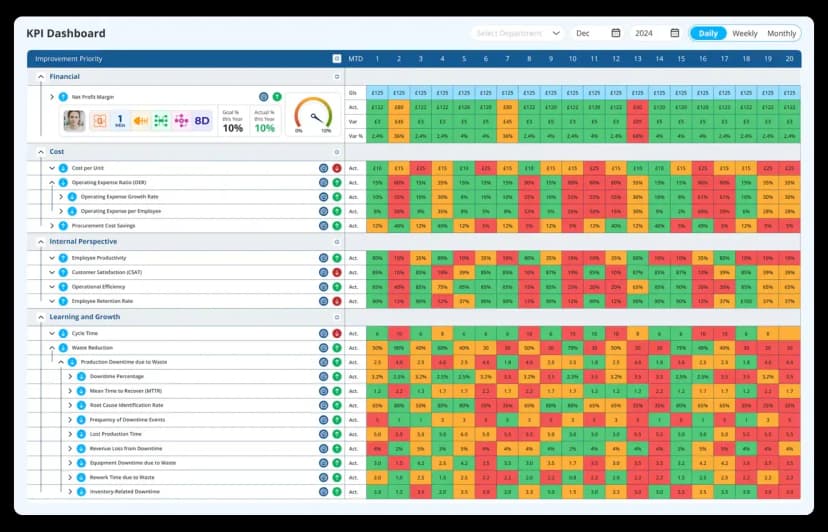
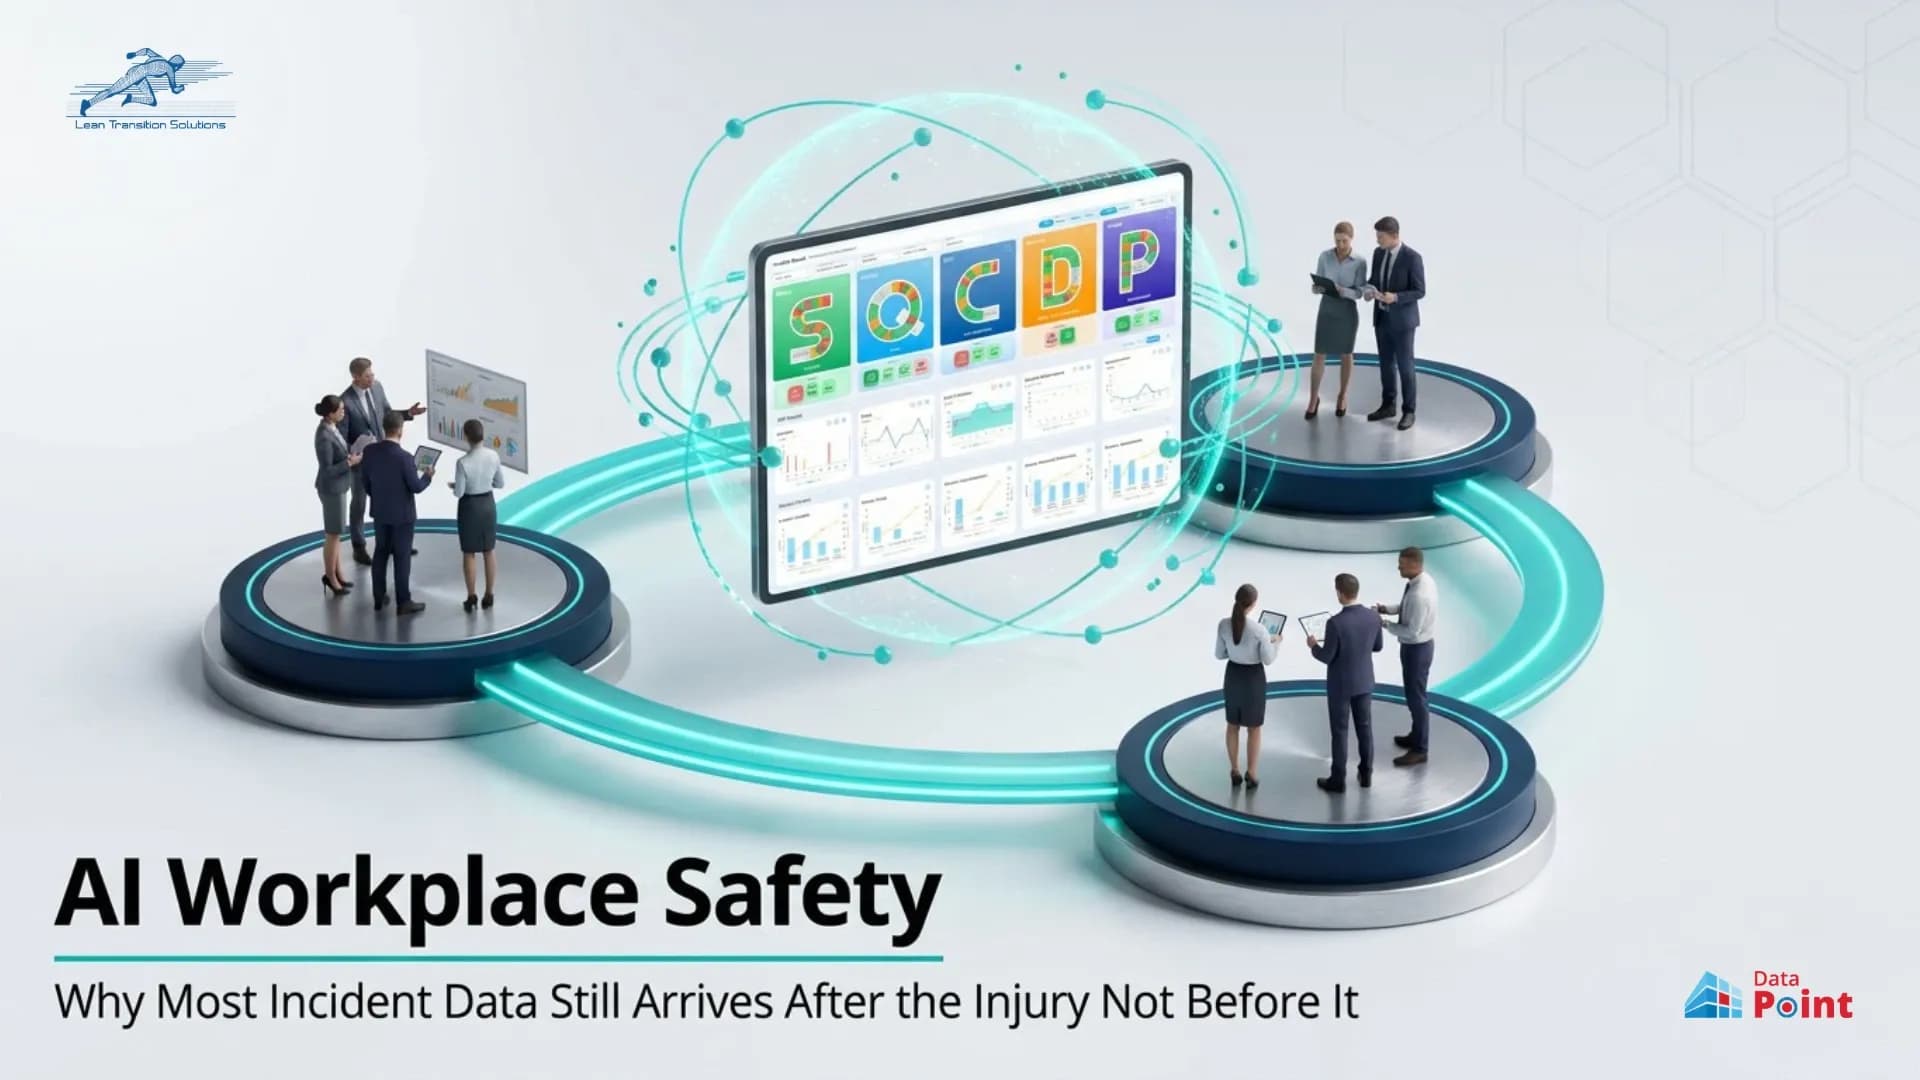
Safety is one of the main components of an SQDCP huddle board, under which each of the Safety KPIs are reported, logged and tracked efficiently. The dashboard works perfectly.
- RAG indicators show status at a glance.
- Tiered visibility runs from shopfloor to leadership.
- Every incident gets logged and every report is accurate.
Detecting a pattern can easily be missed by the person in charge even if they have the best dashboards in town to track it. And if these issues happen in different sites and different shifts, it takes time for the pattern to surface.
How lean AI reads the pattern sitting inside your own dashboard data
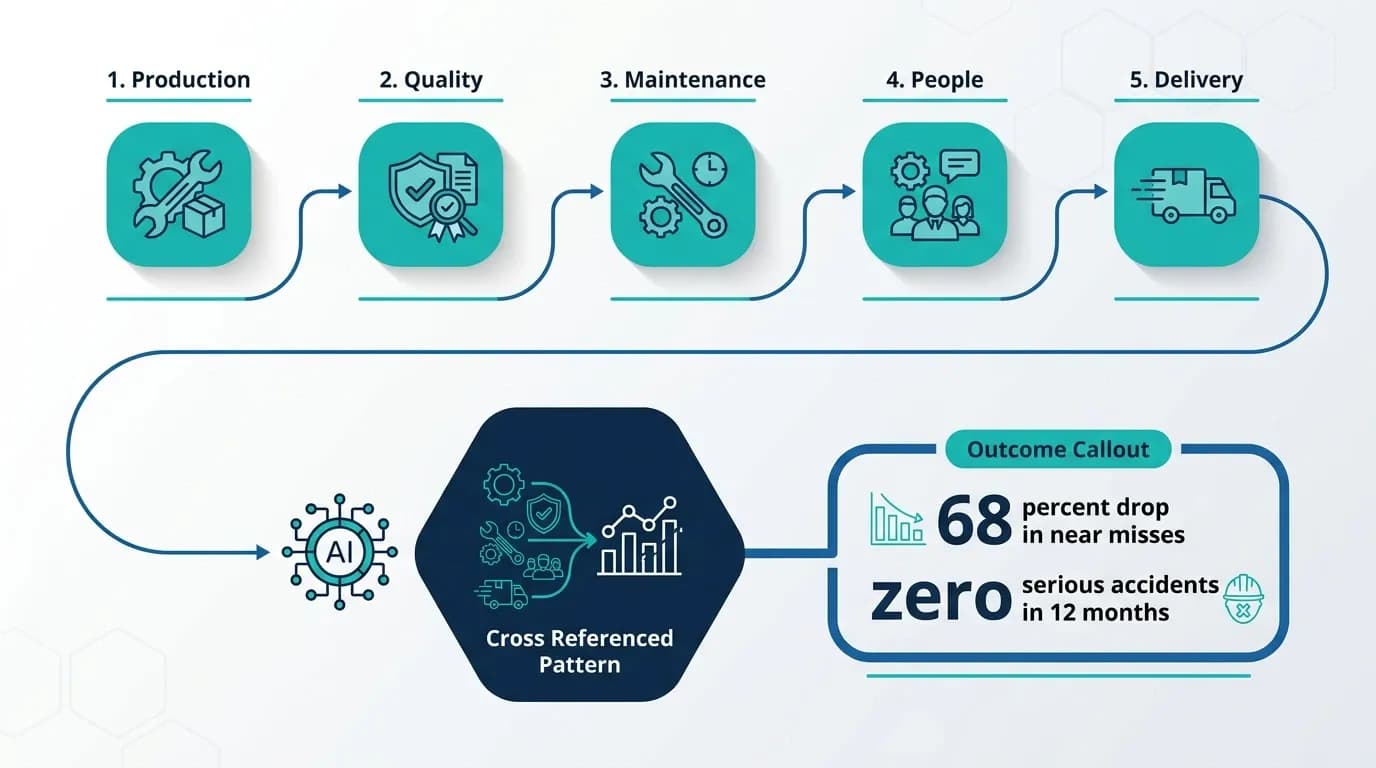
Cross-referencing isn't new software. It includes five data domains such as production, quality, maintenance, people, and delivery. This is what Lean AI does with the same data: cross-referencing across five domains instead of one at a time. The dashboard already tracks these. The issue arises when the dashboard tracks them as five separate lines, not one picture.
- Site-specific training, not a generic model reading generic patterns. What counts as normal on one line isn’t normal on another.
- Anomalies and deviations get flagged as they happen, not after a shift report gets filed.
- A pattern in one domain gets checked against the others before it’s dismissed as noise. A spike in near misses on its own might be nothing. Checked against maintenance logs and shift rosters at the same time, it might be everything.
The result, once a pattern like this gets acted on: near-miss rate dropped by 68%. Zero serious accidents in the 12 months that followed. Not from watching harder. From watching five things at once instead of one at a time.
This change is what AI workplace safety actually looks like in practice, not a pattern caught by change, but one caught before it repeats.
From dashboard alert to verified action
A flagged pattern isn't the finish line. On its own, it's just information sitting where an alert used to sit, and information without an owner tends to stay exactly where it landed.
That's why the pattern becomes a Decision Card instead of a notification. A named owner. A due date. Nothing floats unassigned, because an assignment with no name attached is just a suggestion. If there's no response within 48 hours, it escalates. Nothing by Day 5, it moves again. By Day 10, it sits at the top of the leadership chain, whether anyone below wanted it there or not.
The card doesn't close on a promise that it was handled. It closes when the fix is checked against the pattern that raised it in the first place. That's the part a dashboard has never been able to do. It can show the flag. It has no way to chase the person who owns it, and no way to confirm the fix actually worked. The gap between flagged and fixed is exactly what closes here.
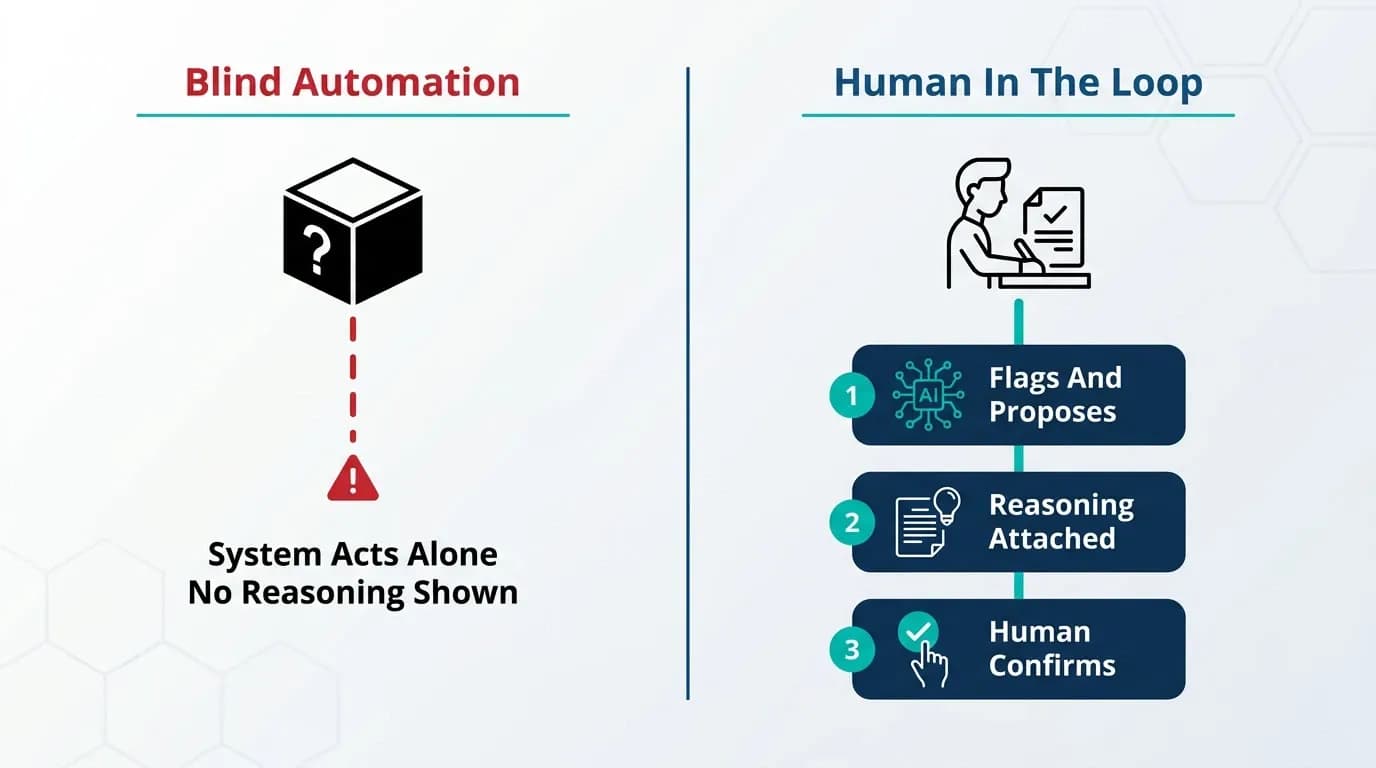
None of this replaces the safety manager. It puts a recommendation in front of them, with the reasoning attached, and waits. That distinction matters most on the safety floor, because nobody wants a system making that call alone.
- The system flags and proposes. It doesn’t act on its own. A pattern gets surfaced, a recommendation gets drafted, and it stops there until a person picks it up.
- Every recommendation carries the data and reasoning behind it, not just a conclusion. The safety manager isn’t told what to do. They're shown what was found and why it matters and then asked to decide.
- Nothing gets carried out until a person confirms it. Not the countermeasure, not the escalation, not the closure. Confirmation is a step, not a formality.
That's the difference between generic automation and a safety incident management software built to keep a person in the loop. A flag with no explanation is a black box, and a black box is the last thing anyone wants standing between a pattern and a decision that affects people on the floor. A flag with the reasoning attached, waiting on a human decision, is something they can trust enough to act on quickly instead of second-guessing it every time.
The system gets faster at finding the pattern. It doesn't get to decide what happens next. That still belongs to a person, every time.
One platform, two layers: Visibility and the intelligence above it
LTS Data Point runs the workplace safety software side of this end to end. Safety sits in the daily huddle through SQCDP, right alongside Quality, Cost, Delivery, and People. RAG indicators show status at a glance, tiered from shopfloor to leadership. Safety Point handles the safety KPIs specifically.
That's not a stopgap solution waiting to be replaced. Every flagged concern already moves through a structured 4C workflow with a full audit trail from assignment to close. That accountability was built in long before AI entered the picture.
Data Point AI sits on top of that foundation, not instead of it. It reads the same connected data Safety Point already tracks, correlates it across domains instead of one line at a time, and turns a flagged pattern into an owned, escalating, verified action through the Decision Engine.
The dashboard still does what it's always done. The intelligence layer does what the dashboard was never designed to do. Together, that's the full picture. Not two separate tools. One system, doing both.
The dashboard was never the problem. It does what it should always do – it logs, tracks, and escalates. What sits above it reads the same data differently, catches what a single report can't, and closes the loop a flag alone never could. Visibility got you here. The layer above it is what gets you ahead of the next incident.
FAQs
1. What is predictive safety in manufacturing?
It's the practice of identifying safety risks before an incident occurs, using data patterns rather than relying only on incident reports after the fact.
2. What’s the difference between a leading and a lagging safety indicator?
A lagging indicator measures something after it happens, like an injury count. A leading indicator flags conditions that tend to precede one, like near-miss frequency or fatigue patterns, giving time to act before an incident occurs.
3. Why do near-miss reports often go unnoticed as a pattern?
Each report is usually reviewed on its own, at the time it's filed. A pattern across multiple reports over weeks or months isn't visible unless someone specifically looks for it across that stretch of time, which most manual review processes aren't built to do.
4. Can workplace accidents really be predicted, or only explained after the fact?
They can't be predicted with certainty, but risk can be estimated. Patterns in shift timing, location, and prior near misses can indicate where risk is elevated, even without knowing exactly when or if an incident will occur.
5. What role does a supervisor’s presence play in workplace safety outcomes?
Research links supervisor presence and behaviour to safety outcomes more strongly than most other situational factors, since supervisors influence how consistently safety practices are followed day to day.

Amer Jumah, Senior Lean Consultant
Amer is co-founder of Agile Solutions and a certified Six Sigma Black Belt, Lean Black Belt, and PMP, with over nine years of experience implementing Lean, Six Sigma, and Agile principles across diverse industries. He specialises in process optimisation, waste elimination, and delivering cost savings through organisational change.