Laboratory Instrument Utilisation: How to Measure It and Find the Hidden Capacity Already Sitting in Your Lab

Last updated on : November 12, 2026
One utilisation percentage per instrument sounds precise, yet it blends idle time, lost time and spare capacity into a single number. Laboratory instrument utilisation hides all three behind one figure.
Take one pharma quality control laboratory. It lacked systemised way to calculate actual against potential instrument utilisation. That limited its capacity planning and bottleneck identification.
So where do the hours actually go? Not into a bigger percentage, but into five stages, from calendar hours to productive hours. Trace them, and existing instruments start giving time back.
Explore how LTS Data Point can help you understand where instrument hours go before investing in more equipment
Laboratory instrument utilisation: Why one percentage hides capacity in a pharma QC lab
A utilisation percentage looks finished. It is a friction. Hours used sit on top, a set of hours sits underneath, and each needs defining before the number means anything.
Laboratory instrument utilisation usually arrives as one instrument utilisation rate. One figure per instrument. Clean, comparable and quietly dependent on two choices.
- The baseline: The fix is not a better percentage, but a set of hours – calendar, available, usable, booked and productive. Each stage shows what the next one loses.
- The coverage: A figure shows how much of the period was actually monitored. One instrument manufacturer's reporting lists the percentage of monitored hours beside run hours and run utilisation and weighs data completeness when reading the result.
Look at the laboratory's own figures. Three instruments, 12 days, 864 calendar hours. A manual calculation put average utilisation at 24.6%. The lab's reporting system showed 25.7%. The gap looked like a calculation error. The delivery team's working explanation was logged downtime, which shortens the available hours the system divides by. The lab was still to confirm it. Either way, the percentage alone could not say which hours had been counted.
That is the risk with one number. Compare two instruments, two sites or two months on percentages alone, and the difference may sit in the denominator, not in the work. Spare capacity gets declared where none exists or missed where it does.
The fix is not a better percentage, but a set of hours. Calendar hours cover the full period. Available hours remove planned and unplanned downtime. Usable hours need a trained analyst and an approved method. Booked hours are reserved. Productive hours ran. Each stage shows what the next one loses.
So which hours come off the calendar first?
How to calculate available instrument hours
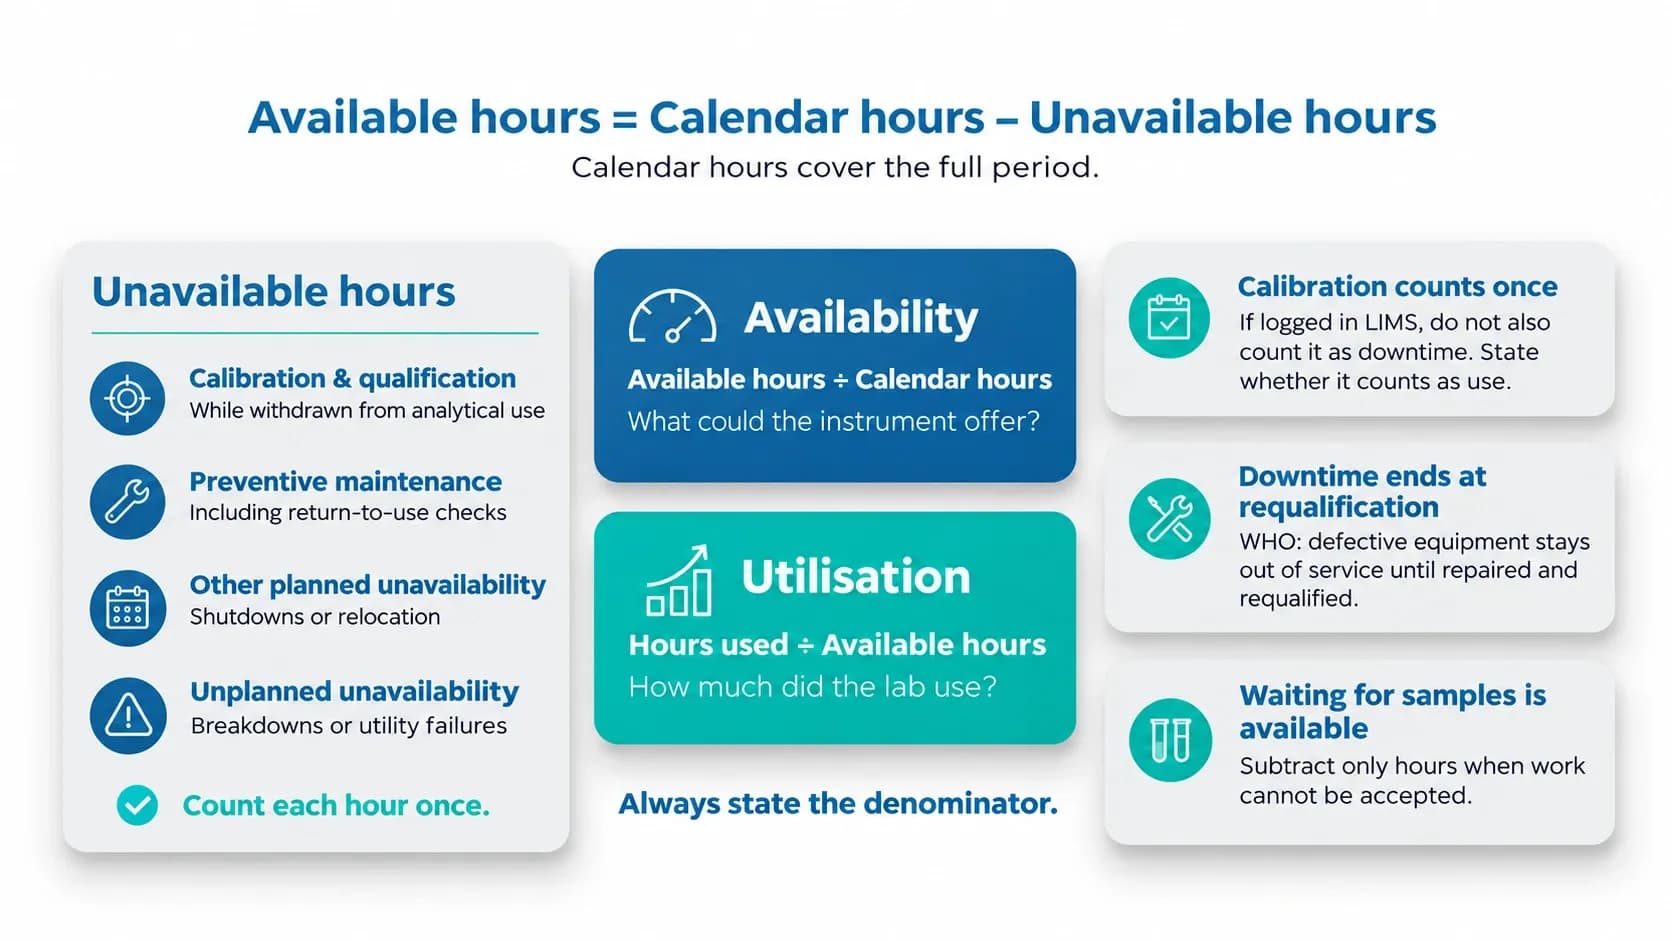
Start with the hours the instrument could not accept work. Calendar hours cover the full period. Available instrument hours are what remain once those hours come off.
Four groups come off, and each hour belongs to one group only:
- Calibration and qualification, while the instrument is withdrawn from analytical use
- Preventive maintenance, including the checks needed to return it to use
- Other planned unavailability, such as scheduled shutdowns or relocation
- Unplanned unavailability, such as a breakdown or a utility failure
The calculation is short. Available instrument hours equal calendar hours. Utilisation divides hours used by available hours. Availability shows what the instrument could offer. Utilisation shows how much of that offer the lab took. State the denominator every time.
Count each hour once. The laboratory removed calibration from its downtime reasons because its LIMS usage log already recorded it. Logged in both places, the same hours would have counted twice. Wherever calibration lives, it lives once, and the lab states whether it counts as use.
Then ask when the clock stops. WHO guidance for pharmaceutical quality control laboratories says defective equipment stays out of service until it has been repaired and requalified. The unavailable interval runs to requalification, not to the end of the repair.
An instrument waiting for samples is still available. Only the hours it cannot accept work come off.
Those are the hours the instrument can offer. But can the lab use them?
Usable hours: Where analyst and method eligibility cut capacity
Available is not the same as usable. An instrument can sit ready while the work waiting for it cannot start. Available hours show what the instrument can offer. Usable hours show what the lab can put on it.
Three conditions decide which hours count:
- Shift cover: Someone is working when the test needs a person.
- Analyst eligibility: That person has completed training for the test.
- Method eligibility: The method is verified for the sample in the queue.
Usable instrument hours are the available hours that meet all three conditions for the work waiting. The answer changes by test. The same HPLC can be usable for one assay and idle for another. Where a run can go unattended, count analyst cover for the start and the review, not every hour in between. One analyst covers one task at a time, so count the same cover once.
The laboratory plans a test only onto analysts whose training for the test is complete. A full roster is not full cover. The cover that counts is the eligible cover.
The method side works the same way. The same WHO guidance for pharmaceutical quality control laboratories asks for verification, where it is required, that the laboratory can run a pharmacopeial method and that the method suits the sample being tested.
So, a modest QC laboratory equipment utilisation figure may point somewhere else. The lab may be short of eligible analysts or verified methods, not short of work. Another instrument would leave both gasps open.
The instrument is fine. The constraint sits in who runs it and how. Of those usable hours, how many were booked, and how much of that booking actually run?
Measuring booked against productive instrument time
Usable hours set the ceiling. Two measures show how close the lab gets. Booked time is the plan. Productive time is what happened.
Booked against actual instrument use
A booking records intent. A run record shows what happened. Measure them apart:
- Booked hours: Time reserved on the instrument in the period
- Actual hours: Recorded run time matched to these bookings
- Booked vs actual use: Actual hours divided by booked hours
Unused bookings show up as a low ratio. Hours booked above usable hours mark overbooking. One research core facility charges the full booked time for a no-show and half the booked time for an analyser reservation cancelled with under four hours' notice.
Occupancy rate, defined from reservations, counts the hours an instrument was held. Productive time counts the hours it analysed.
Booked hours come from the schedule. QC planning and scheduling software builds that schedule by turning testing demand into timed assignments for analysts and instruments.
Productive instrument time
Productive instrument time is the hours the instrument spent analysing samples. Decide which other recorded hours count and state it.
Name the denominator every time.
The laboratory queried about 14 hours on a single instrument. Its technical team found those hours already logged in the source file against a work order.
Productive hours are only as reliable as the records they come from.
With booked, actual and productive hours measured, the work that follows is tracing where the remaining hours went and which of them can be recovered.
Where the hours go: Tracing idle time and uneven workload
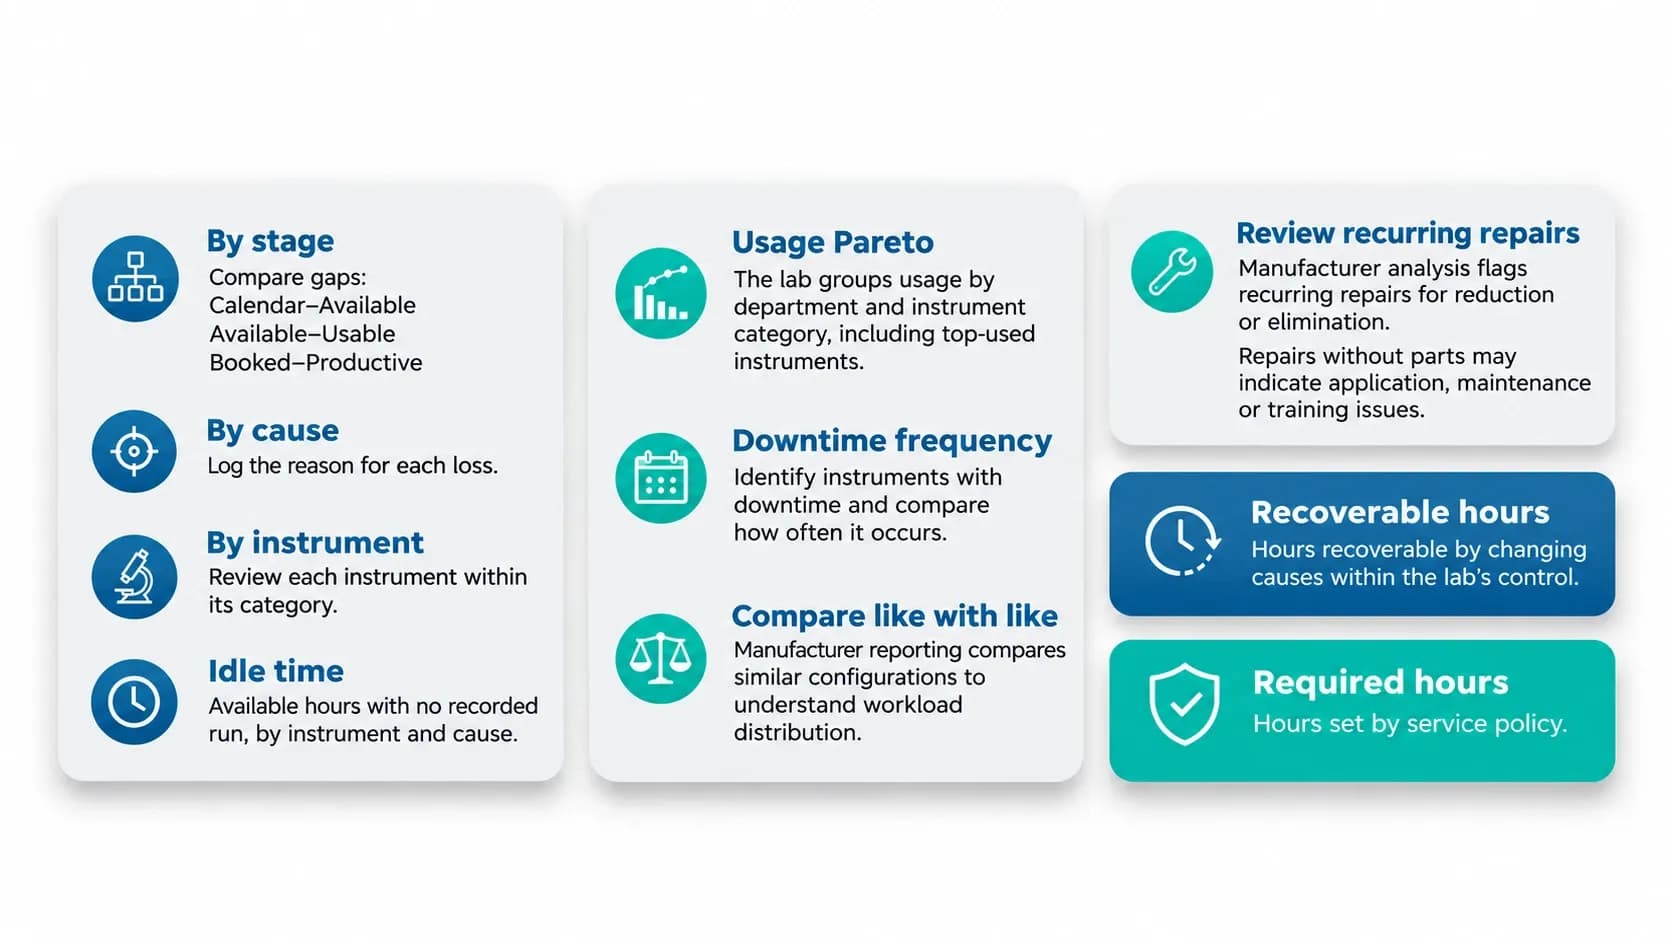
With booked, actual and productive hours measured, the remaining hours need a cause. Trace them three ways:
- By stage: The loss between calendar and available hours, available and usable, and booked, booked and productive
- By cause: The reason logged against each loss
- By instrument: Each instrument within its category
Idle time analysis lists the available hours with no recorded run, by instrument and by cause.
The laboratory displays instrument usage in Pareto charts by department and instrument category, including the top-used instruments. Its leaders also asked to see which instruments had downtime, and which had more frequent downtime than others.
One instrument manufacturer's utilisation reporting compares instruments with similar configurations to understand workload distribution.
The same manufacturer's repair analysis treats recurring repairs as candidates to reduce or eliminate, and notes that repairs without parts often point to application, maintenance or training issues.
Recoverable hours are the ones whose cause the laboratory can change. Required hours are the ones its service policy sets.
With the lost hours traced by stage, cause and instrument, the work that follows is turning those gaps into a case for using existing instruments first.
Improving instrument utilisation without buying equipment
A purchase request asks for more instrument hours. The five stages, from calendar hours to productive hours, show how many the lab already holds. Compare the hours the waiting work needs with the usable and recoverable hours on suitable existing instruments, not with calendar hours or an average utilisation figure. If those cover the need, the request waits. If they fall short, the shortfall is the gap.
Leaders at the laboratory wanted to compare downtime across instruments to see where the investment or budget was going.
In US research funding, the National Institutes of Health states in its S10 instrumental FAQ that a request for an instrument overlapping in function with heavily booked existing instruments can be justified with quantitative usage data for those instruments, an availability statement and a list of intended users or projects.
The same programme expects a financial plan covering at least five years of operation and maintenance, with the institution supporting the facility, personnel, service contracts, operation and maintenance.
Present the case in the order the evidence builds: usable hours, booked hours, productive hours, then the recoverable losses, each with its source and its denominator. Set the cost of recovering existing hours beside the cost of running another instrument.
The case rests on the lab's own hours. What remains is keeping those numbers current from one month to the next, which the final section covers.
How LTS Data Point supports the hours behind instrument utilisation
LTS Data Point instrument utilisation software is part of the short interval control board, shows whether an instrument is busy and which activity it is engaged in, such as testing.
LTS Data Point supports this in four ways:
- Available hours: Downtime is logged by type and reason, and the maximum available hours chart shows each instrument's deviation from its maximum
- Usable and booked hours, people side: Planning handles resource allocation and operator scheduling, and the Skills Matrix supports competency planning
- Productive time and lost hours: The instrument utilisation software shows usage by instrument and month, Pareto charts show usage by department and category, and KPI dashboards show plan vs actual
- Follow-up: Tier Management gives each department, and Action Plans assign, track, escalate and close each action
Log a power failure or a breakdown against an instrument as scheduled or unscheduled downtime, with a type and a reason, and its maximum available hours reduce. The maximum available hours chart then shows how far each instrument sits below its maximum, which is the indication of downtime. A lab opens a department such as large molecule, small molecule or microbiology, then an instrument category such as HPLC, CE, IC, plate reader or TOC, then a single instrument, and reads its usage for the month. Usage arrives from a task card, a direct machine link, a technician who starts a job and stops it after five hours, or the LIMS, in real time once that integration is done.
Pareto charts include the top-used instruments, so the lab can see whether an instrument was well used or vacant for most of the time. KPI dashboards show plan vs actual in daily, weekly and monthly views, with trend analysis and Pareto root cause analysis.
Issues move through tier meetings. Action Plans follow a 4C workflow and every KPI links to an owner, a deadline and a corrective action.
That is how instrument utilisation figures stay current in LTS Data Point.
One percentage hide where an instrument's hours go. Calendar, available, usable, booked and productive hours reveal it. Trace the gaps between them by stage, cause and instrument, and the hours the lab can recover come into view. That evidence shows whether a purchase can wait. LTS Data Point keeps the instrument utilisation figures current.
Discuss your laboratory’s utilisation gaps with an LTS Data Point expert to identify where existing capacity could support more work
FAQs
1. Can instrument utilisation go above 100%?
Yes. In one review of a contract research organisation, equipment utilisation ranged from 0% to 144%. The same review listed non-standard calculation methods and inconsistent usage logs among its challenges.
2. Is instrument utilisation the same as OEE?
No. OEE availability divides run time by planned production time, and it leaves out time when no production was intended. Utilisation divides productive hours by available hours, so the two use different denominators.
3. What should an instrument usage log record?
One life sciences review standardised its logs to capture the username, project code, samples, test or reaction, start time, stop time and overall run time.
4. Who decides how often an instrument is serviced?
The laboratory does. WHO guidance for pharmaceutical quality control laboratories asks it to set a service policy that describes, for each type of analytical equipment, how often it is serviced and the events after which service is necessary.
5. When does an instrument need requalifying?
WHO guidance says original observations, including calibration, validation and verification records, should be kept in the line with national legislation or contractual agreements, and for not less than five years.
6. How should an instrument's calibration status be shown?
WHO guidance says equipment that needs qualification, calibration or maintenance should be labelled, coded or otherwise identified to show its status and the date the next action is scheduled.