The Lean Maturity Assessment Every Plant Manager Should Take Before Investing in More Tools
Last updated on : August 27, 2026
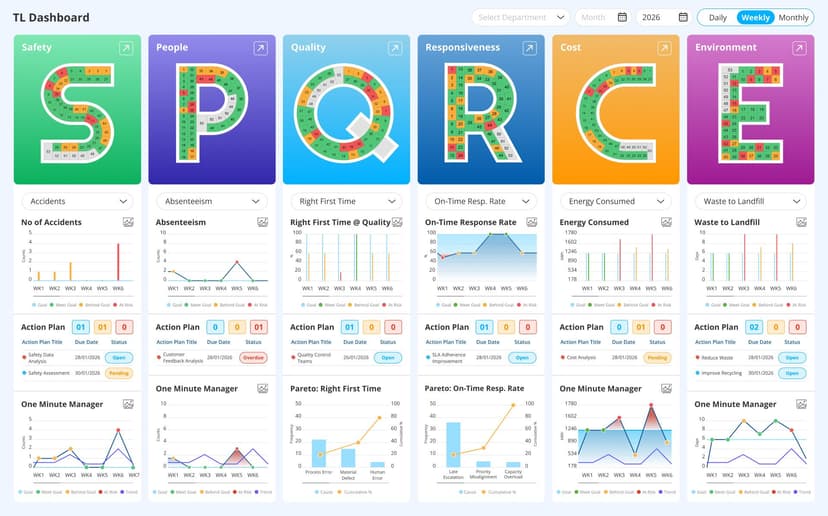
A plant manager impressed by the efficiency of the real-time KPI dashboard decided to adopt it in their plant.
They did everything right. The data was updated. Every defect tracked and fixed. Every red-coded defect changed into green within days. And yet the problem continued. Six months in, the same problem kept appearing on top with bright red warning, impossible to miss.
Did the dashboard fail?
Actually, no. The dashboard did what it was supposed to do – track everything that was updated in real-time and signalling when something went wrong.
If not the dashboard, what actually went wrong?
Their lean maturity. The plant manager never checked if the plant and its employees were ready.
A lean maturity assessment is a structured way of measuring how far an organisation has progressed in its lean journey. It does not simply talk about whether the plant has all the tools like 5S, huddle boards, or KPI tracking dashboards in place, but whether the behaviour and culture around those tools are actually driving continuous improvement. It typically scores a plant across defined stages or levels, giving a baseline you can act on and later measure progress against.
See how LTS Data Point supports every stage of your lean maturity journey
Why most lean programmes plateau without anyone noticing
Everyone assumes a dashboard is proof of maturity. It isn't. Most manufacturing maturity assessments score the tools. Few score the behaviour behind them.
Think of the two sides of a lean assessment as separate report cards.
- Tools: do you have 5S, huddle boards, KPI dashboards
- People: when those tools flag a problem, does anyone actually own fixing it, and does the fix get checked later to see if it held
A dashboard tracking the same defect week after week, fully logged and colour-coded the second it appears, is a textbook case of exactly this split. Its tools report card tells a different story. Nobody is assigned to close the loop once red appears. No one checks whether last week's fix actually stuck before this week's version of the same problem shows up again. The infrastructure grades A. The behaviour behind it is never graded at all.
- No one assigned to act on a flagged issue by a set deadline
- No huddle structure turning “we can see it” into “someone owns it”
- No review cadence checking whether last week’s fix actually held
This is why plateau happens quietly. Without a baseline score to check yourself against, there's no way to tell the difference between standing still and moving forward. You don't drift into stagnation with a warning sign. You drift into it looking, on paper, like you're already there.
A lean maturity assessment exists to catch exactly this gap, before it costs you six months and a dashboard nobody trusts anymore.
The five stages of lean maturity and how to spot yours
Lean maturity isn't about what's on the shopfloor. It's about how people behave once nobody's watching.
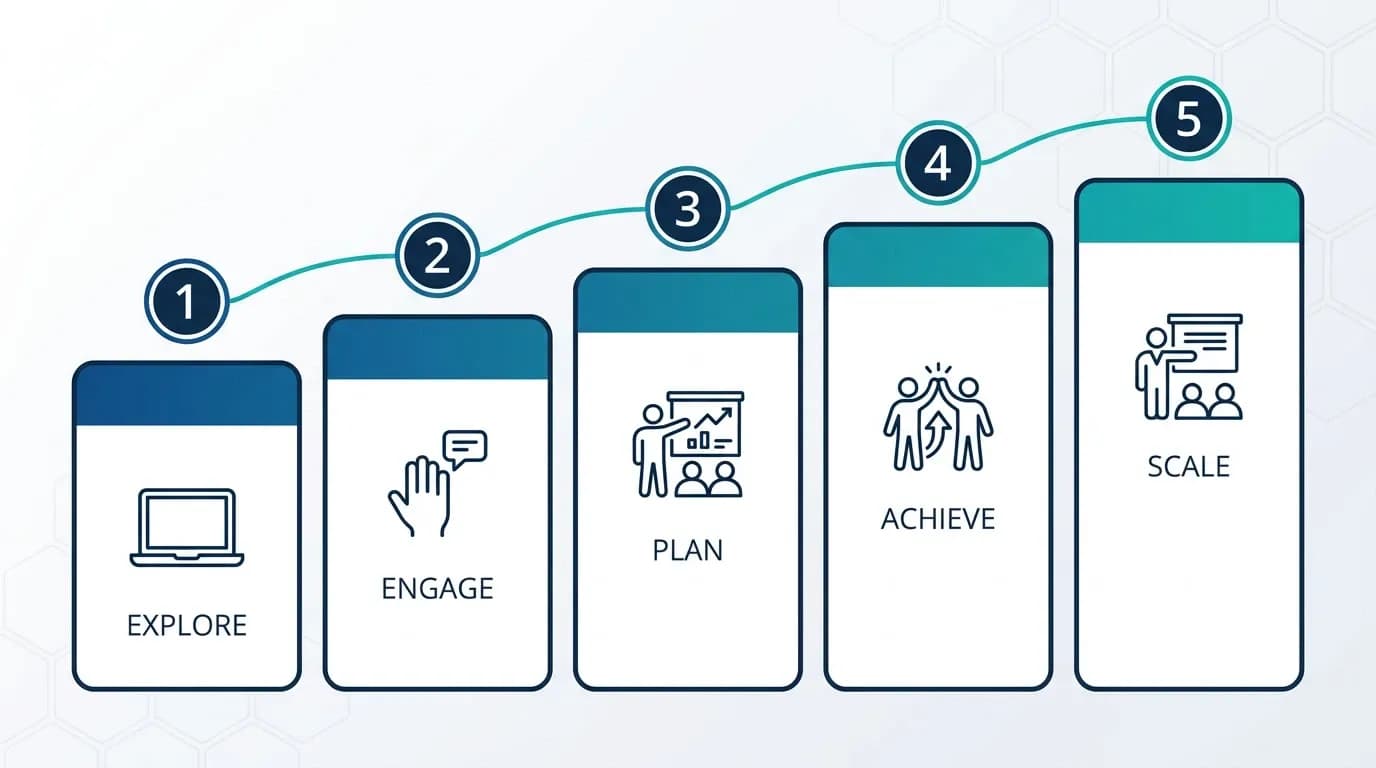
This is the lean maturity model behind the assessment: five stages, and none of them mention a single tool.
- Dormant: Lean exists on paper. Boards might be up, but nobody updates them without being told to.
- Waking: Awareness is building. Huddles happen, but attendance is patchy and follow-through is rare.
- Active: Practice is regular. Teams show up and go through the motions, but action is mostly reactive.
- Enthusiastic: Improvement becomes proactive. Ownership is visible, though it varies by shift or site.
- Advocate: Lean is the default. People sustain and teach it without being asked.
Placement on this scale isn't about which stage sounds better. It's diagnostic. Once a leadership team can see who's Dormant and who's Advocate, they know exactly where to send support, and who's ready to give it. A team stuck at Waking doesn't need another dashboard. It needs someone from Advocate to show up and model what active ownership actually looks like.
That's the real value of naming your position on the lean maturity levels.
Take the lean maturity assessment: Where does your plant actually stand?
Answer the 10 lean readiness assessment questions below
Each one covers a different behaviour that signals lean maturity. Select the option that best reflects your plant today, not how you'd like it to be, and note down the points for each answer.
🔴 1 point = Dormant
🟠 2 points = Active
🟢 3 points = Advocate
Here is the quiz:
Calculate and find your lean maturity score
Add up your points. Your score reveals how far your plant's daily behaviour has progressed toward true lean maturity.
- 10-16 Points: Surface Phase
Your plant treats lean as something done on paper, not in practice. Boards may exist, but nobody updates them without being told to. This creates risks like recurring problems, invisible effort, and no baseline to measure progress against.
- 17-23 Points: Practising Phase
Your team runs the motions of lean consistently, but ownership is inconsistent and mostly reactive. This creates gaps like fixes that don't hold, uneven standard work across shifts, and priorities only leadership can explain.
- 24-30 Points: Embedded Phase
Your plant has made lean the default, not the exception. This helps sustain ownership, proactive problem-solving, and consistent behaviour regardless of who's on shift or who's watching.
What to do with your score: Avoiding the over-investment trap
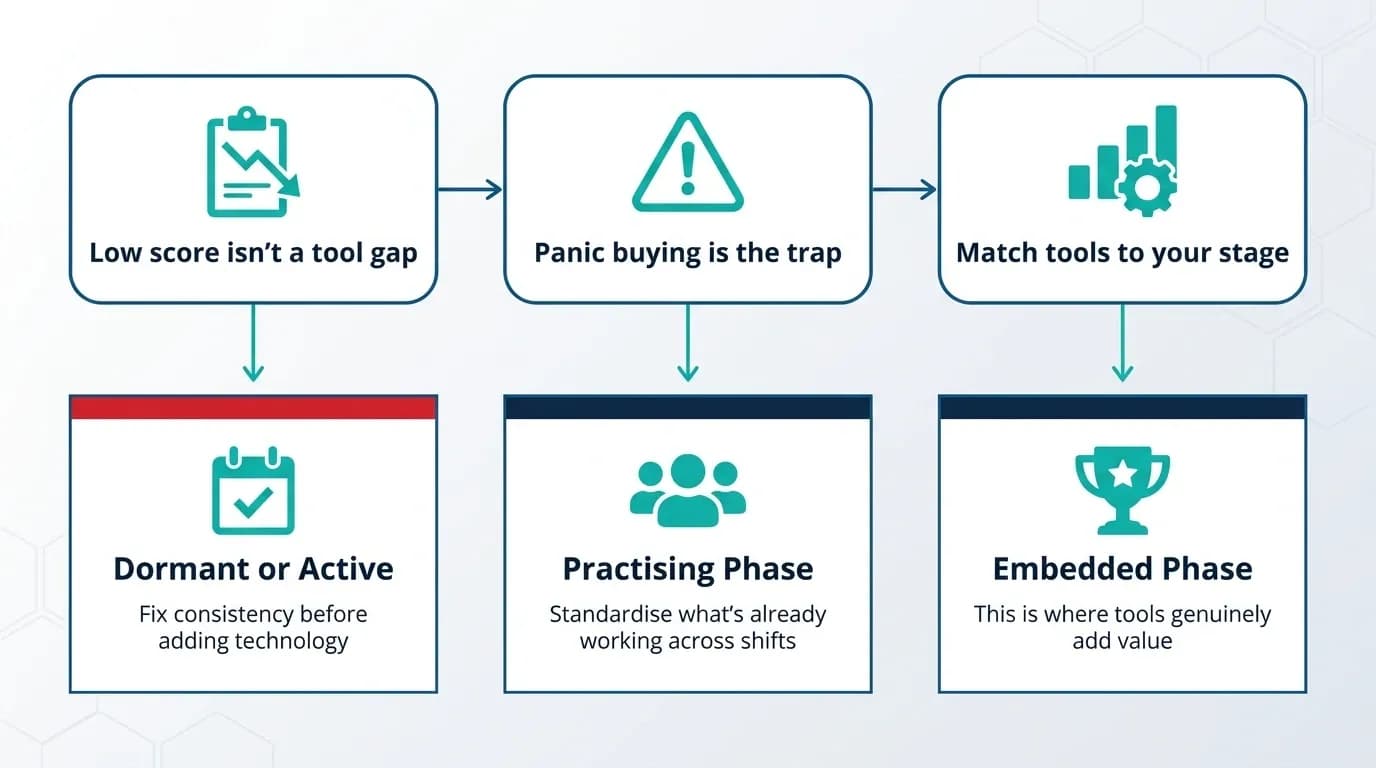
A low score doesn't mean you need more tools. It means you're not ready for the ones you're eyeing yet.
This is the trap. A plant scores low, panics, and buys its way toward the top. Real-time dashboards, AI-driven tracking, advanced analytics, whatever looks most mature. But maturity isn't a sequence.
One real example makes this clear. When a lean transformation team was shown a fully-featured Kaizen tracking platform, the response wasn't excitement, it was hesitation: "we're not ready for all that yet." Instead of adopting the advanced version, they asked what a simplified one would look like, choosing to build culture and consistency first, with tooling introduced later once the foundation could actually support it.
- Dormant or Active: Fix consistency before adding technology. A dashboard nobody updates isn’t progress, it’s decoration.
- Practising Phase: Standardise what’s already working across shifts before layering on more capability.
- Embedded Phase: This is where advanced tools genuinely add value, because the behaviour underneath can sustain them.
The right next step isn't the most advanced one available. It's the one your current stage can actually use.
How LTS Data Point supports every stage of the maturity journey
None of this works if the tool assumes you're further along than you are or leaves you to figure out the rest alone.
That's the difference in how LTS Data Point is built. At the earliest stages, it doesn't try to impress you with automation. It digitises the basics that keep plateauing plants stuck: a flagged issue gets an owner, a deadline, and a record that someone checked it actually held. The exact gap that let a dashboard track the same defect for six months without anyone closing the loop.
As consistency builds, LTS Data Point standardises it. Every site, every shift, working from the same structure instead of its own version of a board. Implementation includes structured onboarding and training throughout, so teams aren't handed a system and left to work it out on their own while trying to build new habits at the same time.
Only once that foundation holds does Data Point AI Intelligence enter the picture, surfacing patterns and supporting decisions on top of data that's already trustworthy. Not before. Not to compensate for gaps a maturity assessment would have caught first.
The result isn't a tool bought ahead of readiness. It's one built to meet you exactly where your score says you are, with support through the transition rather than a handover at go-live.
A dashboard doesn't prove maturity. a score does, and only if you're honest about it. Ten questions won't fix a plant, but they'll tell you exactly where to start, and where not to. The right next step was never about buying more. It was about knowing where you actually stand first.
An LTS expert can help you turn your score into the right next step for your plant.
FAQs
1. How long does a lean maturity assessment take to complete?
A self-scored assessment like this one takes about five to ten minutes. A formal, externally audited version usually takes longer, since it involves site visits and documentation review.
2. Who should complete the assessment – leadership or the shopfloor team?
Ideally both, separately. Comparing how leadership scores the plant against how the team scores it often reveals a perception gap that's just as revealing as the score itself.
3. How often should a plant reassess its lean maturity?
Every six to twelve months is typical. Frequent enough to catch drift, infrequent enough that the score reflects real behavioural change rather than short-term effort around the assessment date.
4. Can a plant’s maturity stage regress over time?
Yes. Maturity isn't permanent. Leadership turnover, new shifts, or a merger with a less mature site can all pull a plant's average score backward even after real progress was made.
5. Does a low score mean the plant is failing?
No. It means there's an accurate starting point. Most plants score lower than expected on their first honest attempt, which is normal, not a red flag on its own.
6. Is this assessment specific to manufacturing, or can other industries use it?
The behavioural indicators (ownership, follow-through, escalation, initiative) apply anywhere lean principles are used, including healthcare, logistics, and services, though the examples here are framed around a shopfloor context.

Geandra Queiroz, Operations Management Consultant
Geandra is an Operations Management Consultant at Lean Transition Solutions, specialising in Lean philosophy, Lean Six Sigma, and strategic planning across manufacturing and healthcare. She is currently completing her PhD in Industrial Engineering at the Federal University of São Carlos, researching the integration of Operations Strategy, Lean, and Green Manufacturing.