Why KPIs Fail and How to Fix Them with Digital Tools
Last updated on : January 22, 2026
KPIs are meant to guide progress, yet for many businesses they become a source of frustration rather than clarity. Targets are missed, reports pile up, and leaders are left wondering why their carefully chosen metrics fail to deliver results. The reality is that KPIs often fall short because they’re misaligned with strategic goals, overly complex, or based on incomplete data. These issues don’t just waste time – they can derail decision-making and hinder growth. The solution? Embracing digital tools and optimisation strategies that simplify tracking, improve accuracy, and turn KPIs into actionable insights. In this blog, we’ll uncover why KPIs fail in modern businesses, common mistakes everyone makes, how various digital tools fix KPI failures, KPI optimisation strategies, and future trends in KPI management.
Ready to transform your KPI management with LTS Data Point?
Why KPIs fail in modern businesses
Setting Key Performance Indicators (KPIs) the right way is one of the primary concerns for several managers and the organisations they run. You set 3-5 KPIs depending on the current goal, change KPIs as the targets evolve, and still measuring KPIs seem a hurdle for many industries. Even when your KPI selection is flawless, mistakes still may happen due to numerous reasons. Let's see what those mistakes are and how it impacts your business.
Key reasons why KPIs fail
1. Lack of clarity
- KPIs are typically vague, broad, and poorly defined.
- Teams monitor too many metrics without differentiating KPIs from general data.
- Ambiguous KPIs make it impossible to calculate real progress or take corrective actions.
2. Poor alignment with strategy
- KPIs don’t connect back to organisational aims, customer value, or operational priorities.
- Different departments create their own KPIs in silos, leading to conflicting goals.
- This causes teams to work hard on metrics that don’t drive strategic outcomes.
3. Unrealistic or arbitrary targets
- Objectives are sometimes set without data, trends, or capability analysis.
- Over-ambitious targets demotivate employees; too easy targets distort performance.
- Failure to revise targets periodically means KPIs become irrelevant over time.
4. Lack of ownership
- No clear accountability for who observes, reports, and acts on each KPI.
- KPIs become “management numbers” rather than team drivers.
5. Measuring outputs, not outcomes
- Businesses monitor activity (number of calls made) instead of impact (conversion rate).
- This results in misleading performance indicators.
6. Poor data quality and inaccurate reporting
- Unclean, scattered, or delayed data leads to KPIs that don’t indicate actual conditions.
- Manual tracking increases the risk of errors and inconsistent reporting.
7. Absence of continuous review
- KPIs are often set once and forgotten.
- Without frequent assessment, KPIs cannot mirror market changes, new priorities, or performance realities.
Impact of KPI failure on decision-making and progress
1. Misguided decisions
- Leaders make decisions based on incomplete or misguiding metrics.
- Resources are allocated to the wrong initiatives because KPIs do not show business reality.
2. Reduced agility
- Teams react slowly to market changes because they lack live insight.
- Without accurate KPIs, opportunities and risks go unnoticed until it’s too late.
3. Team frustration and low accountability
- Staff lose trust in KPIs when they feel irrelevant or unfair.
- Misaligned KPIs build friction between teams and lowers ownership.
4. Wasted efforts and resources
- Time and budget are spent monitoring metrics that don’t matter.
- Poor quality KPIs end in unnecessary meetings, rework, and inefficiencies.
5. Missed growth opportunities
- Firms fail to spot trends that could drive new products, markets, or revenue streams.
- Incorrect KPIs follow stagnation because performance is overestimated or misunderstood.
6. Strategy drift
- When KPIs do not reflect strategic goals, the business gradually moves off course.
- This weakens long-term competitiveness and makes it hard to accomplish transformation goals.
Need help choosing the right KPI strategy?
Why KPIs fail: Common mistakes everyone makes
- Setting too many KPIs at once – leading to overload and diluted focus.
- Defining KPIs without making sure they are specific and computable (i.e., vague, ambiguous or overly broad KPIs).
- Selecting KPIs that aren’t aligned to the organisation’s overall strategy or goals.
- Choosing arbitrary or unrealistic targets without data-backing or analysing potential.
- Failing to allot clear ownership or accountability for each KPI.
- Monitoring outputs or activities instead of real outcomes and impact.
- Depending on poor-quality, incomplete or outdated data for KPI tracking.
- Not assessing or updating KPIs often as business context, strategy or market conditions change.
- Neglecting context – e.g., using the same KPI targets across different teams, departments, or market segments.
- Lack of communication – teams or stakeholders don’t realise why KPIs exist or how they relate to their work.
- Failing to tie KPI performance to practical insights or decision-making processes.
- Using KPIs as a control tool rather than a performance management or improvement tool – resulting in fear or superficial compliance.
How various digital tools fix KPI failures
In the advanced digital era, utilising digital advances is a must, if your company intends to lead the market, of course. But awareness about “what tool for what need” is a must.
Let's look at those tools that make KPI tracking effective:
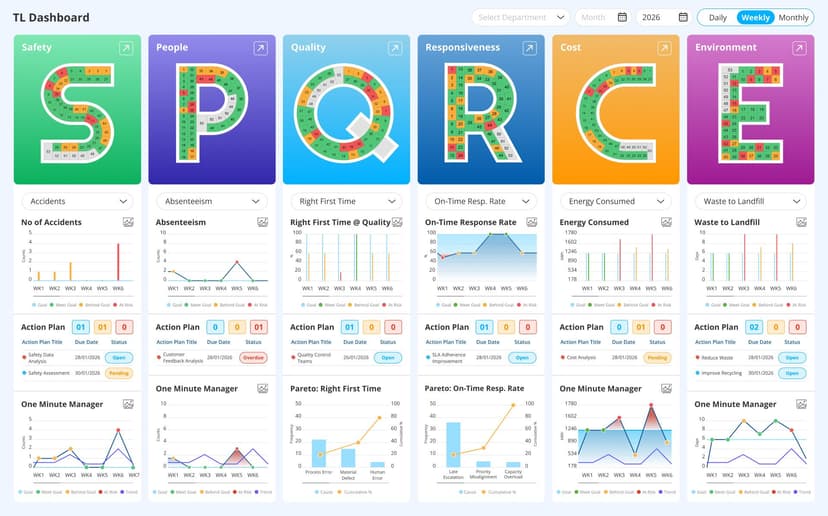
1. Live operational KPI dashboard – SQDCP / SQDCL / SQDCPS / ESQDCP etc.
- This dashboard monitors operational dimensions (Safety, Quality, Delivery. Cost, People – and variants that incorporates Customer, Environment, Lean metrics depending on layout).
- Benefit: Offers continuous visibility across functions (shift / plan / enterprise) so defects or deviations become instantly visible – eliminating lags, surprise problems, or reliance on outdated data.
2. Strategic goal framework integration – FCIL / Balanced Scorecard + objective flow / Hoshin Kanri X Matrix / strategy map tools
- System aligns daily or operational KPIs with top-level business strategy via frameworks like the FCIL perspectives (Financial, Customer, Internal process, Learning and growth) and aids mapping goals to KPIs.
- Benefit: Verifies that what teams observe actually contributes toward industrial targets, preventing siloed or irrelevant KPIs, and boosting coherence and strategic alignment across the firm.
3. Interactive dashboards + drilldown analytics + custom reporting
- This suite gives dashboards that can be customised, visual KPI scorecards, data visualisation with chart/graph views, detailed reports (goal vs actual, variance, trends) and role-based access.
- Benefit: Turns raw data into productive insight. Managers and teams can not only see high-level KPIs but drill down into root causes or detailed metrics, enhancing decision-making and minimising ambiguity.
4. Automated and dynamic reporting, integration with ERP/MES and data sources
- The platform aids integration with enterprise systems (like ERP/MES) to pull data automatically, and auto-generate KPI reports and rollups – decreasing manual data entry and errors.
- Benefit: Delivers reliable consistent, and up to date data for KPIs – eliminating issues stemming from poor data quality, delays, or manual spreadsheet errors. These builds trust in the KPI system and makes sure decisions are based on accurate data.
5. Continuous improvement and root cause analysis tools – Fishbone diagram, quad charts, Lean management modules, project trackers
- Tools like fishbone diagrams, quad charts, process flow / value-stream mapping, project tracking, and Lean execution modules are included to link KPI deviations with corrective or improvement actions.
- Benefit: Instead of just spotlighting that something is not right, these tools assist teams dive into why – allowing root cause analysis and organised corrective action. This ensures that KPIs lead to real improvement, not just reporting.
6. Multi-site / multi-shift / multi-level governance with local flexibility
- The platform supports standardisation across multiple plants or sites while enabling local customisation: you can compare performance globally but still adapt KPIs to the realities of each site or shift.
- Benefit: For larger or distributed industries, this avoids a rigid KPI approach, minimises silos, and ensures coherent yet context-sensitive performance tracking. This helps keep away from irrelevant or unrealistic KPIs in diverse environments.
7. Flexible timeframe KPI setting (daily / weekly / monthly) and trend analysis
- The system lets KPIs to be set and monitored at different cadences – daily, weekly, monthly – and to track Goal vs Actual, variance and variance% over time.
- Benefit: Empowers more granular tracking and frequent feedback loops. Teams can spot issues early, detect trends (positive or negative), and adjust strategy or functions in a timely manner – instead of waiting for quarterly or annual assessments when it might be too late.
Experience live KPI dashboards and automated reporting with LTS Data Point
KPI optimisation strategies for success
1. Set SMART KPIs for measurable results
- Specific: Define exactly what success looks like so teams know what to aim for.
- Measurable: Make sure every KPI has computable indicators (e.g., % improvement, cycle time reduction).
- Achievable: Set targets based on capacity, historical performance, and realistic limits.
- Relevant: Align KPIs with strategic priorities, customer expectations, and operational objectives.
- Time-bound: Establish timelines (daily/weekly/monthly) to drive accountability and timely action.
Why it works: SMART KPIs eliminate ambiguity, prevent unrealistic expectations, and help teams remain focused on outcomes that truly matter.
2. Integrate KPIs with digital transformation initiatives
- Use live dashboards to link KPIs with real-time operational data, verifying decisions are based on current performance rather than periodic reports.
- Automate data collection to eliminate errors, minimise human effort, and increase reliability.
- Link KPIs to digital workflows, allowing faster escalation, issue spotting, and action planning.
- Bind KPIs with analytics tools to identify trends, anomalies, and opportunities for optimisation.
- Unify KPI tracking across processes, so finance, operations, quality, and leadership access a single source of truth.
Why it works: Digital integration translated KPIs from static metrics into dynamic drivers of improvement, making performance management efficient, transparent, and aligned with modern business needs.
3. Continuous monitoring and iterative improvements
- Assess KPI performance often to identify positive or negative trends early.
- Use variance analysis to comprehend gaps between targets and actuals.
- Adjust targets as business strategy, capabilities, or market conditions evolve.
- Conduct periodic root cause analysis when KPIs fall short and tie outcomes with corrective actions.
- Motivate continuous feedback loops across teams to refine functions, tools and targets.
- Benchmark performance internally across shifts/sites and externally against industry standards.
Why it works: Continuous tracking keeps KPIs important, prevents stagnation, and ensures business adapt quickly – turning KPIs into a cycle of learning, improvement, and competitive growth.
Discover how LTS Data Point can optimise your KPIs effortlessly
Future trends in KPI management: LTS Data Point version
1. Increased emphasis on live, continuous performance monitoring
- LTS Data Point live KPI dashboards and real-time tracking of metrics across Safety, Quality, Delivery, Cost, People, Customer etc.
- Trend: KPI systems will move further toward continuous performance management instead of periodic assessments. Companies will increasingly depend on live data to spot issues, take corrective action, and maintain agility.
- Why it matters: This allows faster fact-based decisions and hinders problems from accumulating until monthly/quarterly analysis.
2. Deep integration of strategy, execution and improvement – KPI systems as “single source of truth”
- LTS Data Point unites strategic planning (via Balanced Scorecard / objective flow / Hoshin Kanri X Matrix), KPI tracking, and lean continuous improvement execution (including root cause analysis, action plans, project tracking) in one ecosystem.
- Trend: Future KPI management will blur the lines between strategy, operational execution, and process improvement. KPI tools will not just calculate performance – they will trigger, manage, and observe improvements automatically.
- Why it matters: Rather than KPIs being passive metrics, they become active levers: underperformance will automatically lead to root cause analysis, corrective planning, and tracking – making continuous improvement systematic and embedded.
3. Flexible, multi-level and context-aware KPI structures
- The system aids multiple frameworks (SQDCP, SQDCPS, FCIL, etc.), multi-level objectives (strategic, operational), and variable KPI cadences (daily/weekly/monthly).
- Trend: As business become more complex (multiple sites, global functions, varied business units), KPI platforms will offer even more flexibility – enabling each unit to define context-appropriate KPIs while preserving overall strategic alignment.
- Why it matters: This prohibits rigid KPI failures. Diverse teams or processes get KPIs suited to their context without compromising company-wide coordination and visibility.
4. Role-based, user-centric KPI access and collaboration tools
- LTS Data Point provides role-based portals or dashboards, customised view for various levels (shopfloor, management, executives) and mobile/global accessibility.
- Trend: KPI management will increasingly be user-centric, with custom-made dashboards and notifications – verifying each stakeholder sees what matters most to them. Collaboration features and transparency will grow.
- Why it matters: That aids drive accountability, ownership, and engagement. Users don’t get overwhelmed with irrelevant records; they get insights that matter to their role.
5. Automated analytics, reporting and data integration (ERP/MES)
- Current integration with ERP/MES and automated data flow minimises manual data entry, allows consolidated documenting, and keeps data precise and timely.
- Trend: KPI management tools will strengthen automation – integrating across more enterprise systems, pulling data automatically, generating dynamic records, and even giving predictive analytics (trend-forecasting, early-warning alerts).
- Why it matters: Lowers human error, enhances data reliability, and enables managers to act proactively based on predictive insights rather than just reactive insights.
6. Embedded continuous improvement – root cause analysis and action management as part of KPI workflow
- LTS Data Point includes built-in tools – root cause analysis (Fishbone/Ishikawa), quad charts, Hoshin Kanri X Matrix, digital value stream mapping, project trackers, and action-plan timelines.
- Trend: KPI systems will evolve from “measurement only” to “measurement + improvement” – whenever KPI deviates, the system leads teams through root cause analysis, corrective actions, and monitors remediation – making continuous improvement an integrated part of KPI management.
- Why it matters: Transforms performance tracking into a dynamic process of improvement – less blame, more organised problem-solving and operational excellence.
7. Scalability and global or remote governance with cloud-based access
- LTS Data Point supports global accessibility and multi-site governance and comes with cloud-based bowling chart tools that make KPI tracking more transparent and efficient.
- Trend: As industries function across locations, KPI management will embrace scalability; central governance yet local flexibility, global dashboards, remote access, cross-location benchmarking.
- Why it matters: Facilitates uniform standards, centralised oversight, yet permits to adapt KPIs to local conditions – beneficial for multinational or multi-facility enterprises.
KPI management is no longer just about reporting numbers, it’s evolving into a proactive, integrated, and improvement-driven system. By identifying issues in real time, organisations gain the speed and agility needed to solve problems quickly and prevent them from recurring. Reliable, consistent KPI data strengthens strategic decisions and drives operational excellence. With alignment, transparency, and accountability across teams – locally and globally – businesses can maintain focus and cohesion effortlessly. Continuous improvement shifts from being an occasional initiative to becoming an embedded part of everyday workflows. This is where LTS Data Point makes the difference – providing live dashboards, automated reporting, and integrated improvement tools that transform KPIs from static metrics into dynamic drivers of growth. With LTS Data Point, firms achieve clarity, responsiveness, and sustainable success in today’s digital era.
Your KPIs deserve clarity
FAQs
1. How often should you refresh KPI targets?
Quarterly for business outcomes; monthly for operational metrics. Update immediately after major strategy or capacity changes.
2. How can you prevent KPI gaming or unintended behaviours?
Pair metrics (e.g., speed with quality), use leading + lagging indicators, and review incentives for balanced outcomes.
3. What's a KPI tree and why use it?
A KPI tree breaks a top‑level outcome into drivers and sub‑drivers, clarifying cause‑and‑effect and helping teams pick actionable levers.
4. How can you choose leading indicators that actually predict results?
Validate with historical correlation and pilot tests; select process metrics that move first (e.g., first‑time yield before defect rate).
5. What's the best way to set baselines for new KPIs?
Run a data capture period (4–8 weeks), remove anomalies, and use median or control‑chart limits rather than a single average.
6. How do seasonality and demand spikes affect KPI interpretation?
Model seasonal patterns; compare like‑for‑like periods; use trendlines and control limits to distinguish normal variation from true change.
7. What's a bowling chart and when should you use it?
A bowling chart shows target vs actual by period, with colour‑coded variance – ideal for concise performance reviews.
8. What's the difference between SLAs and KPIs?
SLAs are external commitments (often contractual); KPIs are internal measures. Use both to align service and performance.

Abel Jiménez, Lean Consultant
Abel is a Lean Consultant with over 30 years of expertise in operational analysis, process improvement, and organisational change across Mexican industries. Currently serving as Director of Insurance Promotions at CESCEMEX, he helps organisations leverage technology and lean practices to improve efficiency and manage change with continuity.