Manufacturing Capacity Planning: How a Daily Capacity Management Board Keeps Production Balanced and Teams Aligned
A daily capacity management board links planned targets with real-time hourly performance tracking, helping manufacturers balance capacity and improve shift execution.
Contents
- What is a daily capacity management board?
- What Is Manufacturing Capacity Planning?
- The Challenges with Traditional Manufacturing Capacity Planning
- What Is a Daily Capacity Management Board?
- Manufacturing Capacity Planning vs Daily Capacity Management: Two Layers, One System
- What a DCM Board Must Track to Be Useful
- Capacity Balancing: The Part Most Manufacturers Miss
- What a connected digital DCM platform looks like in practice
- From the Shopfloor to the Leadership Meeting: How the Data Flows
- Who Uses a Daily Capacity Management Board
- Common Reasons DCM Boards Stop Working
Last updated on : June 29, 2026
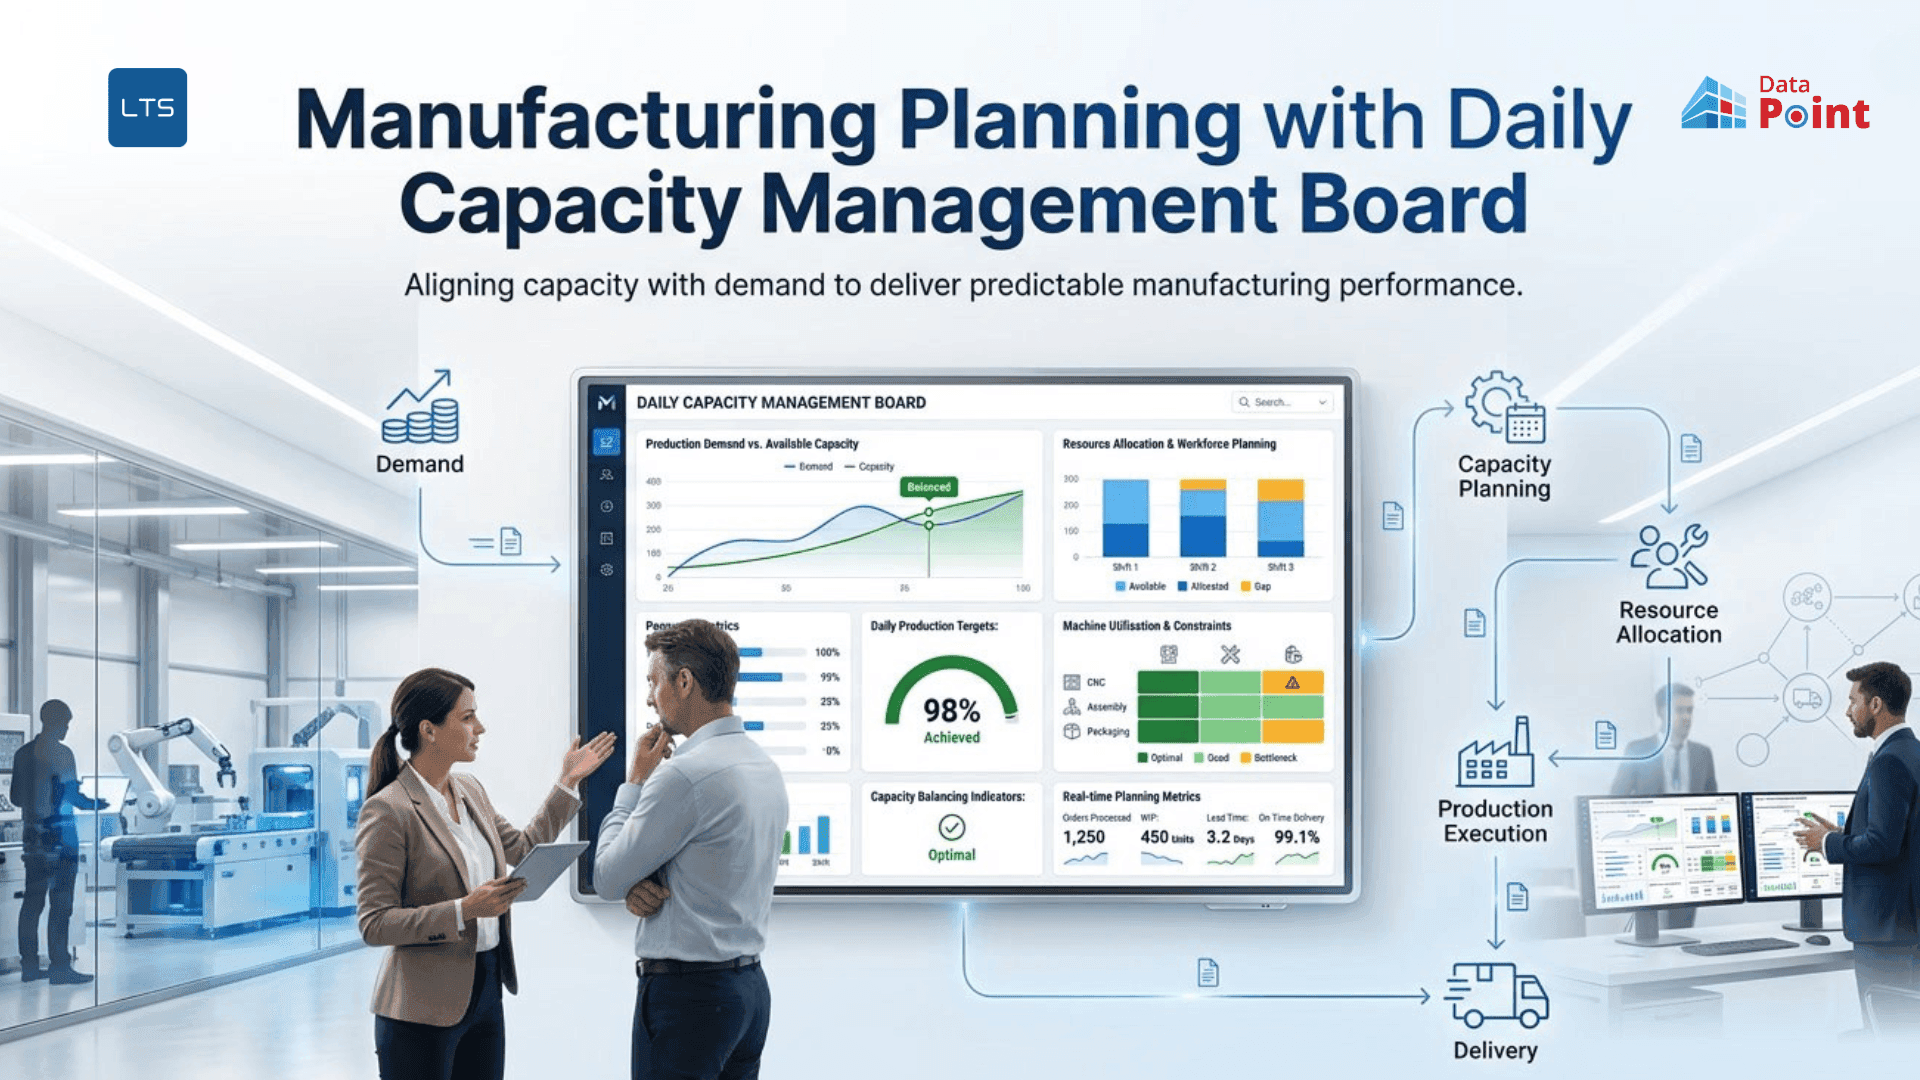
What is a daily capacity management board?
A daily capacity management board is a visual management tool used in manufacturing to track production performance against planned targets on an hourly basis. It gives supervisors and area leaders real-time visibility of output, adherence, and line balance, enabling corrective action within the shift, not after it.
What Is Manufacturing Capacity Planning?
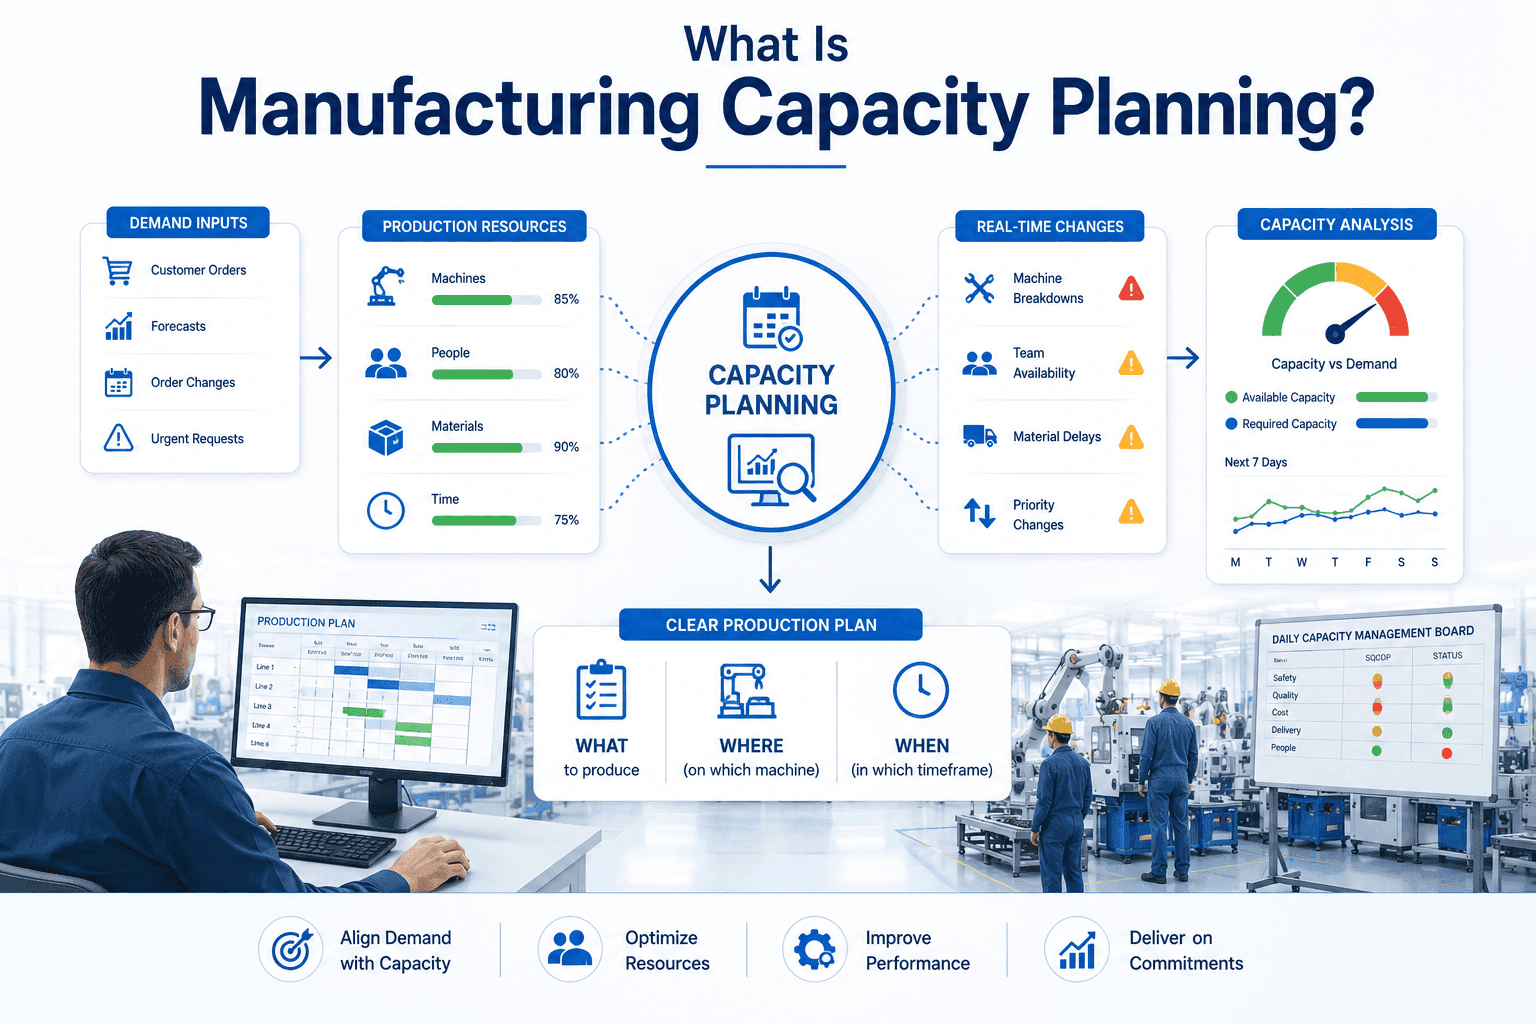
Manufacturing capacity planning is the process of working out whether your production resources, such as machines, people, materials, and time, are enough to meet the demand in front of you.
It is not a one-time exercise. It happens weekly, sometimes daily, as orders change, machines go down, and teams shift. Done well, it gives every team a clear starting point: what to produce, on which machine, and in which timeframe.
Three questions manufacturing capacity planning answers:
- Can we fulfil this period's orders with the machines and staff we have available?
- Are jobs assigned to the right shifts and production cells?
- Where will we fall short before we actually fall short?
Where capacity planning typically lives in manufacturing:
The challenge:
Each of these tools works in isolation. When planners update one system, supervisors often don't see it. When a machine goes down, the plan doesn't update automatically. That gap between plan and reality is where output loss happens.
The Challenges with Traditional Manufacturing Capacity Planning
The plan is set. The shift starts. Reality takes over.
Most manufacturers do have a capacity plan. The problem is how that plan is communicated, tracked, and updated. In most plants, there is a significant gap between what was planned and what is actually visible on the floor.
The most common pain points in traditional capacity planning:
- Planning data is split across multiple tools: an ERP, a spreadsheet, and sometimes a printed sheet on the floor, none of which talk to each other.
- Targets are set at the start of the shift, but deviations only become visible at the end of day in a shift report.
- There is no single view that shows planners, supervisors, and managers the same information at the same time.
- Shift reports are filled in manually at the end of a shift, reflecting memory rather than real-time events.
- Breakdowns are logged retrospectively; root causes become guesses, and the same issues repeat.
- Plan changes happen informally: verbally, on a shared spreadsheet, or not at all, creating version control problems.
A real example
A real example from UK automotive manufacturing: a plant running three shifts found that shift two consistently fell 12% short of daily targets. The issue was not machine downtime. It was a 15-minute bottleneck at one assembly station that cascaded down the line. Without live tracking data, this pattern took three months to identify. With hourly tracking and balance data, it became visible in the first week.
What Is a Daily Capacity Management Board?
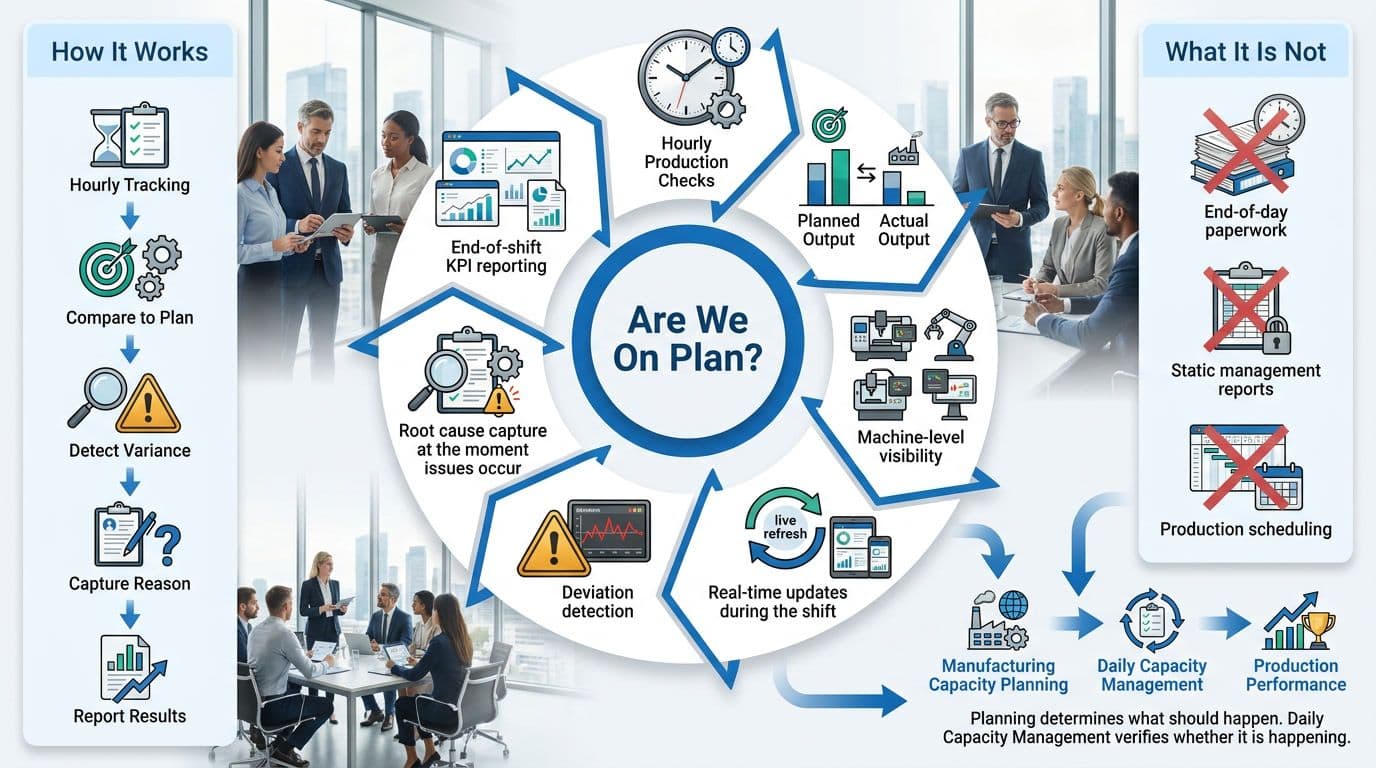
A DCM board is a visual management tool that tracks production performance against planned targets, hour by hour, throughout the shift. It gives supervisors one question to answer every hour: are we on plan?
How it works:
- Displays planned vs actual output at set intervals, usually every hour
- Operates at machine or cell level, so each production unit has its own view
- Updated throughout the shift as actuals are recorded, not at the end of the day
- Captures the reason for any deviation at the point it occurs, not retrospectively
- Data rolls up automatically at end of shift for KPI reporting and leadership reviews
What a DCM board is not:
- Not a shift report filled in at end of day from memory
- Not a static dashboard built for management presentations
- Not a replacement for the production schedule: it tracks execution against the plan, it does not create the plan
The DCM board is the execution layer. Manufacturing capacity planning is the planning layer. Both are necessary. Neither works well without the other.
Manufacturing Capacity Planning vs Daily Capacity Management: Two Layers, One System
Think of manufacturing capacity planning as the architecture and daily capacity management as the construction crew. The architect sets the plan. The construction crew tracks whether it is being built to schedule, material by material, hour by hour.
Using Data Point as an example, the table below compares manufacturing capacity planning and Daily capacity management.
When both layers work in one connected system, every conversation in a daily production meeting is grounded in real data: what was planned, what was delivered, and what needs to change for tomorrow.
See planning and execution connected live with Data Point
What a DCM Board Must Track to Be Useful
Not all DCM boards deliver the same value. The boards that drive real decisions track five metrics consistently. Most manufacturers start with one or two. The teams that consistently hit their daily targets track all five.
Plan adherence, the time-based metric, is the one most manufacturers are missing. A team that produces the right number of units but takes 90 minutes over plan is not on track. Units produced says yes. Plan adherence says no.
Making all five visible without manual work:
In a digital DCM system, these metrics update automatically from the moment actuals are entered. Data Point calculates plan adherence and workload balance in real time, per machine, per hour. Supervisors see the full picture on one screen without compiling a single number manually.
For teams running a quality and performance framework, a connected digital SQCDP board extends the same DCM data into a daily review covering Safety, Quality, Cost, Delivery, and People: all in one view.
Overall equipment effectiveness adds another lens. An OEE tracker uses availability, performance, and quality rates to show where capacity is genuinely being lost and where it can be recovered.
Capacity Balancing: The Part Most Manufacturers Miss
Capacity balancing means distributing workload evenly across production stations, cells, or machines, so that no single point becomes a constraint that slows the whole line.
Here is the problem: imbalances are invisible without the right metric.
Picture a five-station production line. Station 3 consistently runs at 70% of designed pace. The other four stations absorb the backlog and look busy. The line appears productive. But capacity is being lost silently at station 3, every hour, across every shift. Without a live balance metric, the supervisor sees activity; they do not see the gap.
How to make workload imbalance visible:
- Track actual pace versus designed pace per station at each production interval
- Compare workload per station throughout the shift, not just at the end of it
- Watch for the cumulative gap: a small hourly imbalance compounds into a significant daily loss
Understanding real-time takt time tracking gives teams the reference point they need: the designed pace of production. Without it, imbalance is a feeling. With it, it becomes a number you can act on.
How Data Point Planning and execution board shows balance in real time:
Data Point displays workload distribution across production stations lives on the shift tracking board. Supervisors see where the line is running heavy or light and can rebalance within the same hour. That is the difference between spotting a problem at three in the afternoon and spotting it at ten in the morning.
Manual vs Digital DCM Boards: What Has Changed
Daily capacity management boards started on whiteboards. Many plants still run them that way today. The core purpose has not changed: track execution against plan, hour by hour. What has changed is what becomes possible when you move to a digital system.
The shift to digital DCM is not about removing people from the process. It is about removing the manual overhead that slows them down and makes their data unreliable.
The tools that support this digital shift, from tracking boards to structured daily management routines, are covered in detail in this guide to lean daily management tools for manufacturing teams.
See how Data Point AI identify capacity risks before they cost you output.
What a connected digital DCM platform looks like in practice
Data Point's digital visual management boards give every production team a live shift tracking board. Hourly targets, actuals, deviation reasons, and breakdown records all sit in one system. That system connects directly to the daily management review and leadership KPI board, without a manual data transfer step.
From the Shopfloor to the Leadership Meeting: How the Data Flows
A DCM board that stays on the shopfloor is only half a system. The real value comes from what the data does after each shift.
The flow works like this:
Hourly board input -> End-of-shift aggregation -> Daily KPI review -> Huddle board meeting -> Trend reporting -> Improvement decisions
Each step adds context. Each step creates accountability. The supervisor sees the hourly reality. The team leader sees the shift summary. The plant manager sees whether the site hit its daily target. The operations director sees whether that target is being hit consistently.
Well-designed manufacturing KPI dashboards draw from this daily data stream, giving operations leaders a consistent performance picture across machines, shifts, and production lines without waiting for a weekly report.
A digital huddle board puts this daily data at the centre of the morning meeting. Every conversation is grounded in what actually happened on the shift, not what someone remembered or estimated.
Who Uses a Daily Capacity Management Board
A DCM board is used at every level of the manufacturing operation. But each role uses it differently and needs something different from it.
Common Reasons DCM Boards Stop Working
Most DCM boards fail for predictable reasons. None of them are technical.
1. Inconsistent hourly entry
When operators fill in actuals at the end of the shift instead of every hour, real-time value disappears. The board becomes a reporting tool, not a decision tool.
What good looks like: actuals recorded at the end of each hour, before the next one starts, as part of the normal work routine.
2. No governance on plan changes
If the plan can be changed informally, verbally, on a shared file, or by anyone with access, the board tracks against a moving target. The board is only as reliable as the plan behind it.
What good looks like: a locked plan at the start of execution, with a controlled process for any changes that need to be made mid-shift.
3. Data that never reaches the leadership review
A board filled in every hour but disconnected from daily KPI reviews and huddle meetings is effort without impact. The data must flow upward for the discipline to sustain.
What good looks like: shift data feeding automatically into the next morning's review, with no manual compilation required.
How a connected platform removes all three failure conditions:
When the system handles plan governance, automatic rollup, and makes hourly entry fast, the conditions that cause DCM boards to fail are removed by design. Data Point builds these three elements into the platform structure: the plan locks on execution start, KPIs roll up automatically, and entry is designed for real-time use, not retrospective reporting.

Abel Jiménez, Lean Consultant
Abel is a Lean Consultant with over 30 years of expertise in operational analysis, process improvement, and organisational change across Mexican industries. Currently serving as Director of Insurance Promotions at CESCEMEX, he helps organisations leverage technology and lean practices to improve efficiency and manage change with continuity.