Value Stream Mapping Example: The Complete Manufacturing Guide (What Is VSM, How to Read It, and the Exact Math)
Learn what Value Stream Mapping (VSM) is, explore a real-world value stream mapping example, understand the meaning of every VSM symbol, and compare digital vs. manual VSM tools.
Contents
- What Is Value Stream Mapping? (A Clear, Shop-Floor Definition)
- How Does Value Stream Mapping Work? (The 4-Step Process)
- How to Read a Value Stream Map - VSM Symbols Explained
- A Real Value Stream Mapping Example: Automotive Bracket Manufacturing
- Value Stream Mapping Examples Across Industries
- What Are the 8 Wastes That VSM Helps You Identify?
- What Is the Difference Between VSM and Process Mapping?
- Why Real Manufacturing Teams Struggle with VSM
- Can Value Stream Mapping Be Applied to New Product Development (NPD)?
- Digital VSM vs. Paper and Static VSM - Which Should You Use?
- Data Point Value Stream Mapping Software- Your complete manufacturing VSM system
- Types of Value Stream Mapping Tools (From Sticky Notes to Smart Software)
- How Do You Know Your Value Stream Map Is Working- Benefits of VSM
- Ready to Build Your Own Value Stream Map?
Last updated on : July 9, 2026
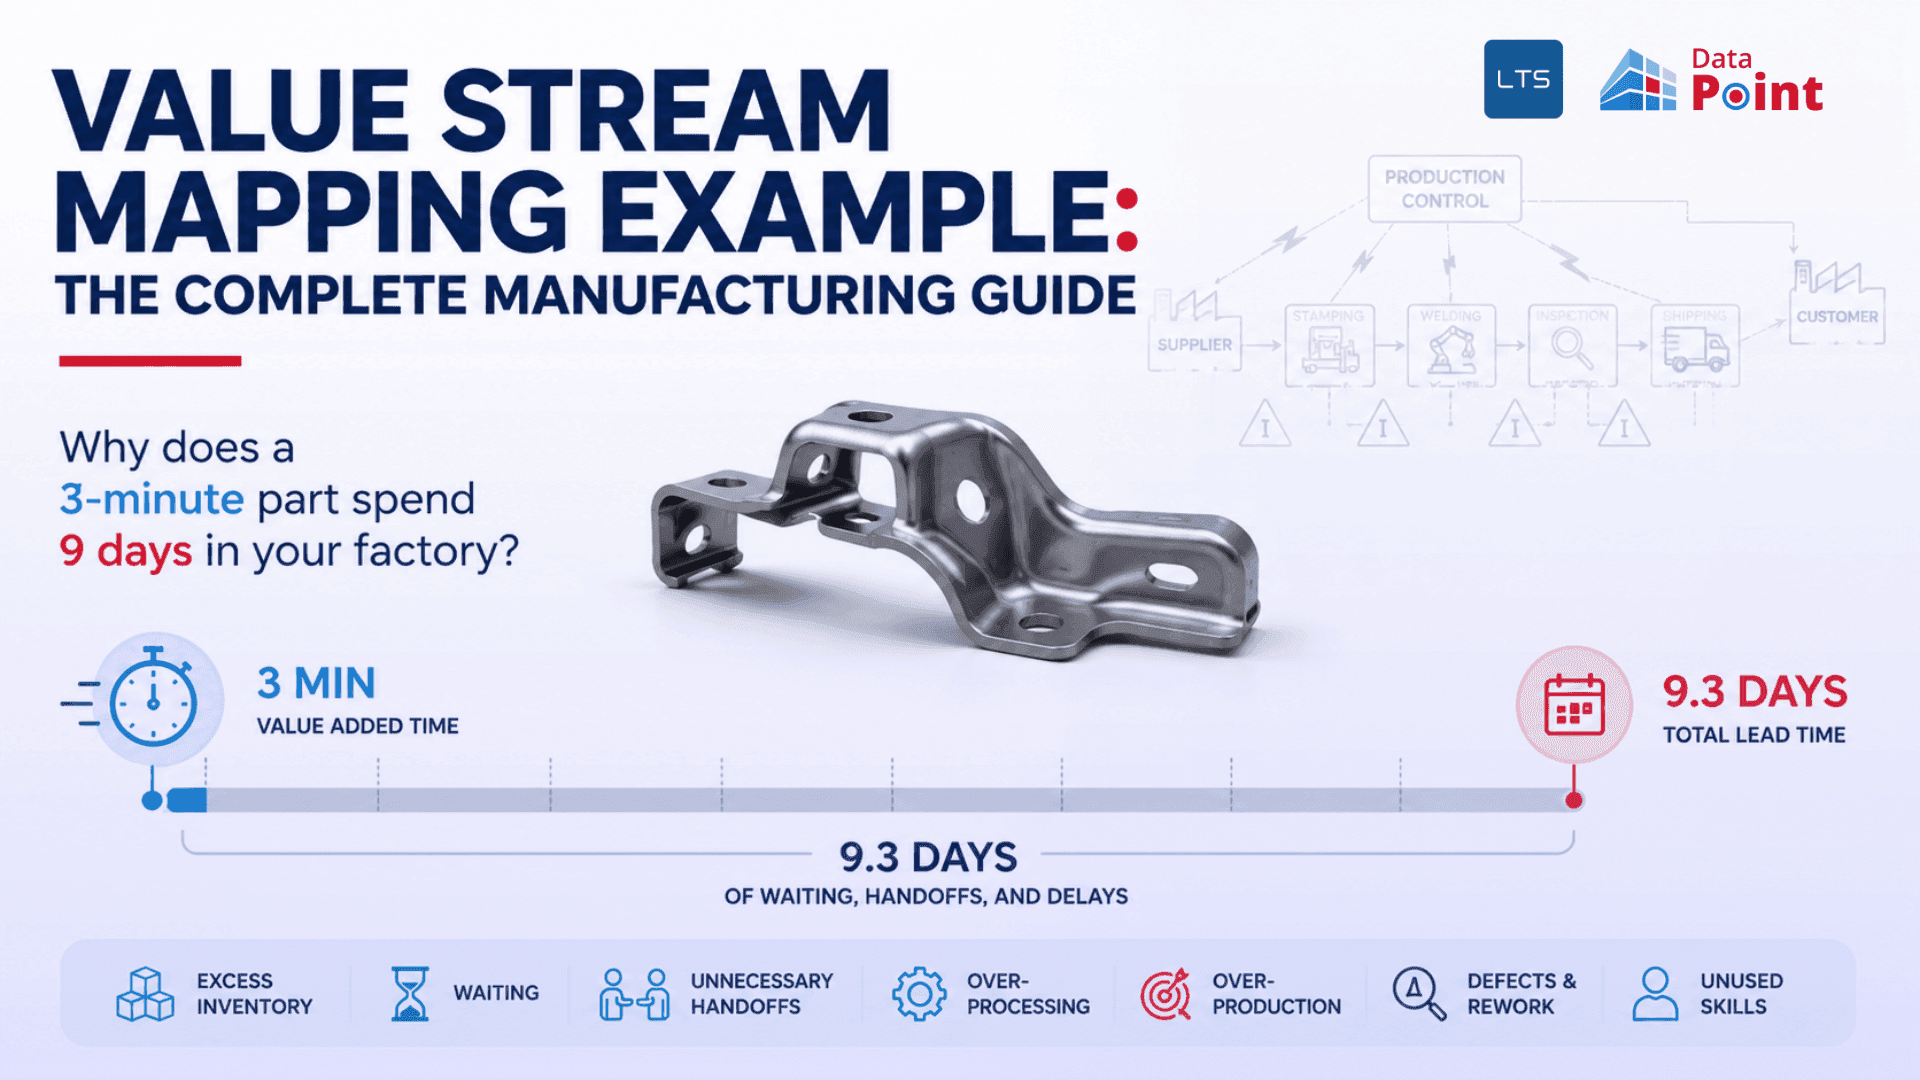
If you have ever stood on a shop floor wondering why a part that takes three minutes to make spends nine days getting through your factory, a value stream mapping example will answer that question in one diagram. This guide gives you exactly that- a complete value stream mapping guide. A real, worked manufacturing example complete with takt time, cycle time, production lead time, and process cycle efficiency calculations - alongside everything else your team needs to understand VSM end-to-end: what it is, how to read the symbols, how it works across industries, how digital tools are changing the practice, and the exact mistakes that cause most VSM exercises to fail before they even reach the kaizen stage.
Whether you are a plant manager in Ohio's auto corridor, a lean coordinator in Pune's components belt, or a continuous improvement engineer in the UK's West Midlands, this page is built for you.
What Is Value Stream Mapping? (A Clear, Shop-Floor Definition)
The technique was formalised by Mike Rother and John Shook in Learning to See (1998), which Toyota itself calls a "material and information flow diagram." It remains the foundational continuous improvement (Kaizen) tool in lean manufacturing worldwide, used from small component fabricators to global automotive OEMs.
Three pillars drive every VSM:
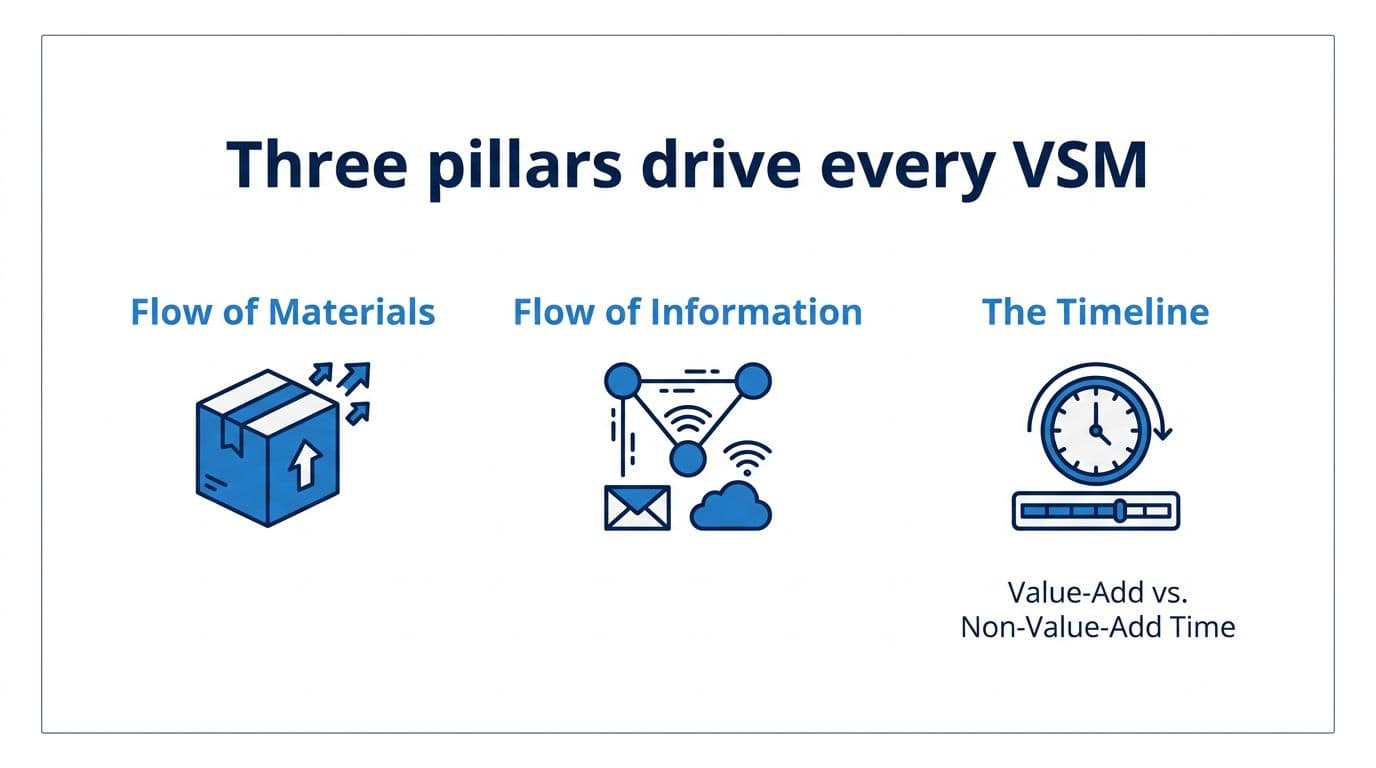
- Flow of Materials: Tracks how physical product moves from your suppliers through each process step to your customers. Every inventory triangle on the map represents waiting - which, in lean thinking, is waste (muda).
- Flow of Information: Shows how production orders, schedules, and customer signals travel through your organisation. On most shop floors, this flow is more broken than the material flow, and it is frequently the root cause of WIP accumulation.
- The Timeline (Value-Add vs. Non-Value-Add Time): Is the zigzag bar at the bottom of every VSM. The peaks represent wait time. The valleys represent actual process time. Almost every manufacturer is shocked by how little of their total lead time is genuinely value-adding.
How Does Value Stream Mapping Work? (The 4-Step Process)
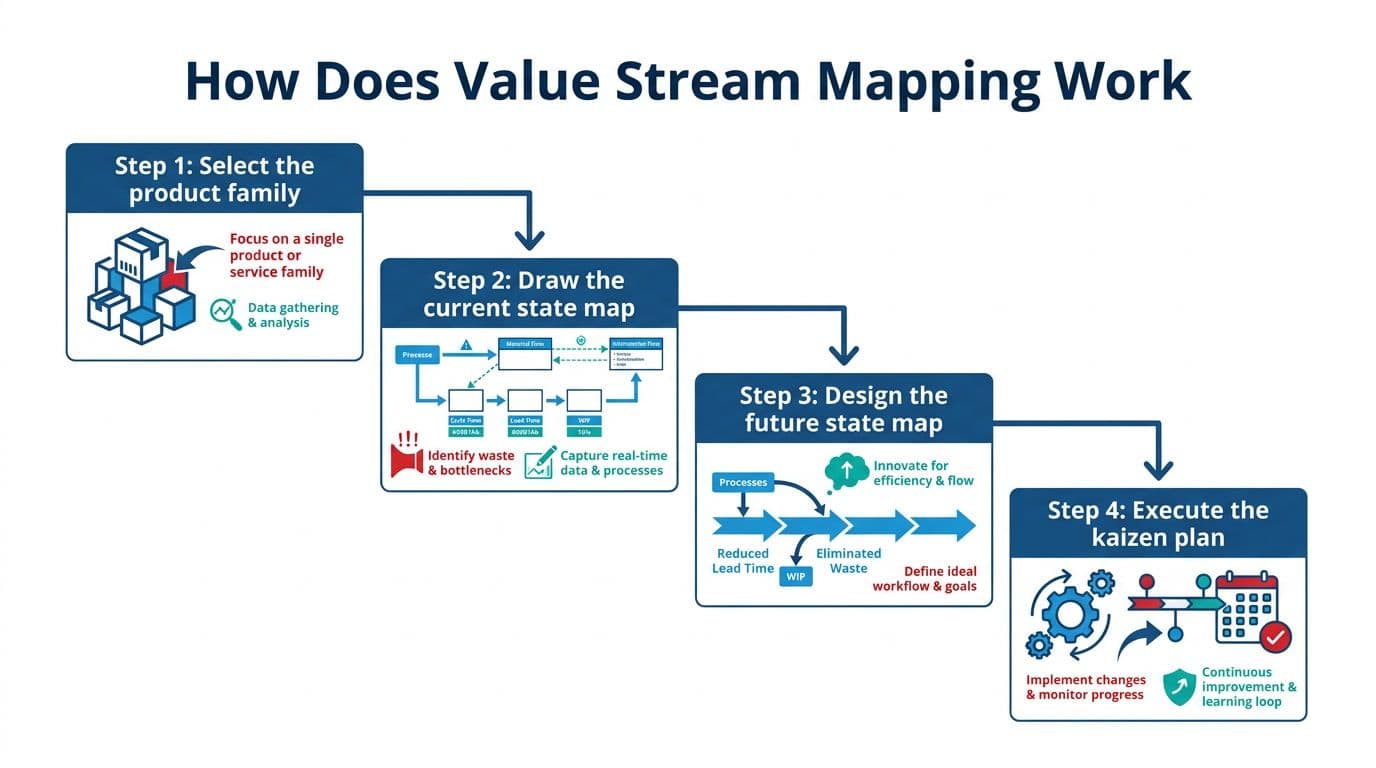
VSM follows a clear, repeatable cycle that lean teams have applied across manufacturing facilities worldwide:
Select the product family.
Do not attempt to map everything at once. Build a product family matrix to identify which family of SKUs shares the most process steps, then focus your first map on the highest-impact family by volume or margin.
Draw the current state map.
Walk the process from shipping dock back to receiving (many experienced practitioners map in reverse). Use a stopwatch. Capture real data - cycle times, changeover times, uptime percentages, and WIP quantities at every inventory point. Do not draw from memory or from standard operating procedures; draw what you actually see.
Design the future state map.
Analyse the current state for waste sources: bottlenecks where cycle time exceeds takt time, inventory mountains caused by push scheduling, and information flows that trigger overproduction. Design how the value stream should flow, then mark each improvement point with a kaizen burst symbol.
Execute the kaizen plan.
The map is not the goal. The map is the blueprint. Assign owners, set timelines, and run focused kaizen events for each improvement identified. Redraw the current state after each cycle to measure progress.
How to Read a Value Stream Map - VSM Symbols Explained
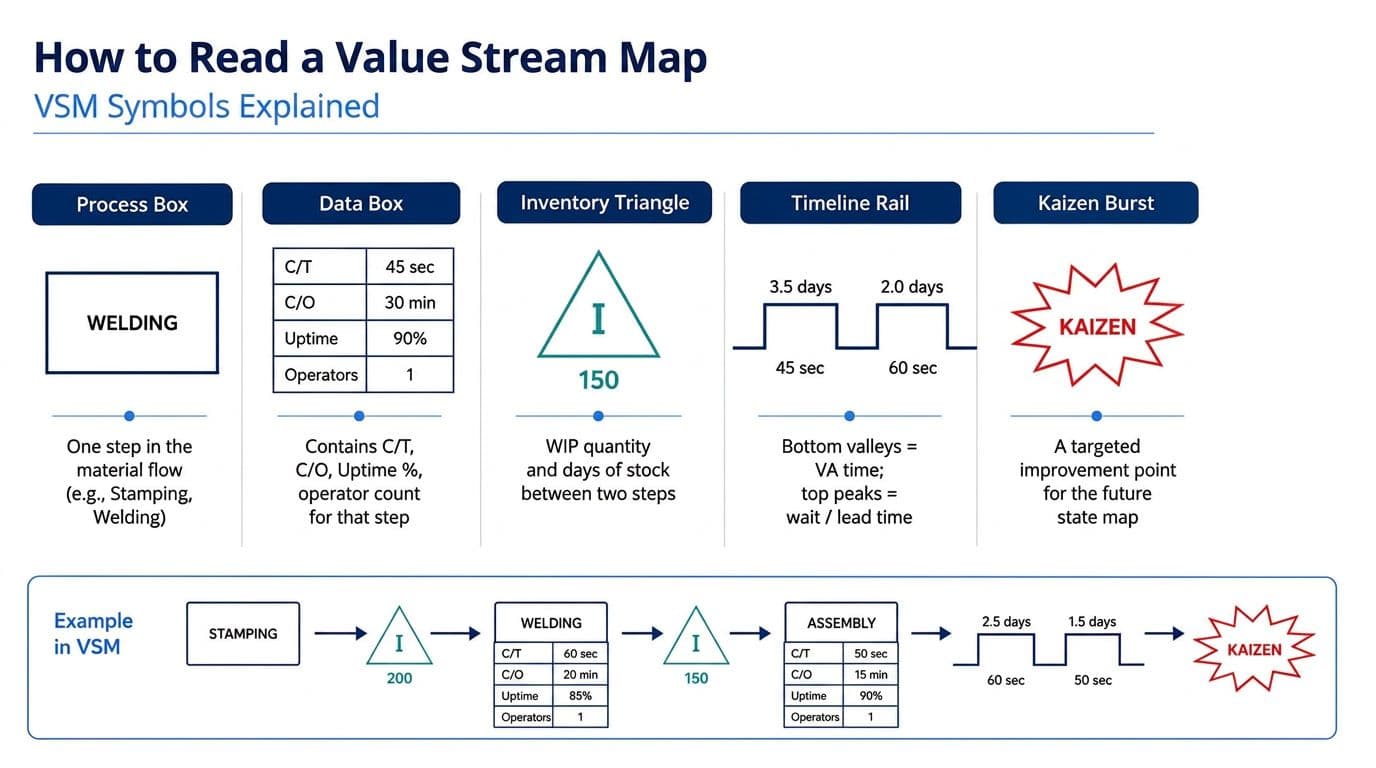
Understanding VSM iconography is essential both for practitioners and for anyone reading a map for the first time. Here are the standard symbols used in every value stream mapping example in manufacturing:
Process and Data Box Symbols
Material Flow Symbols
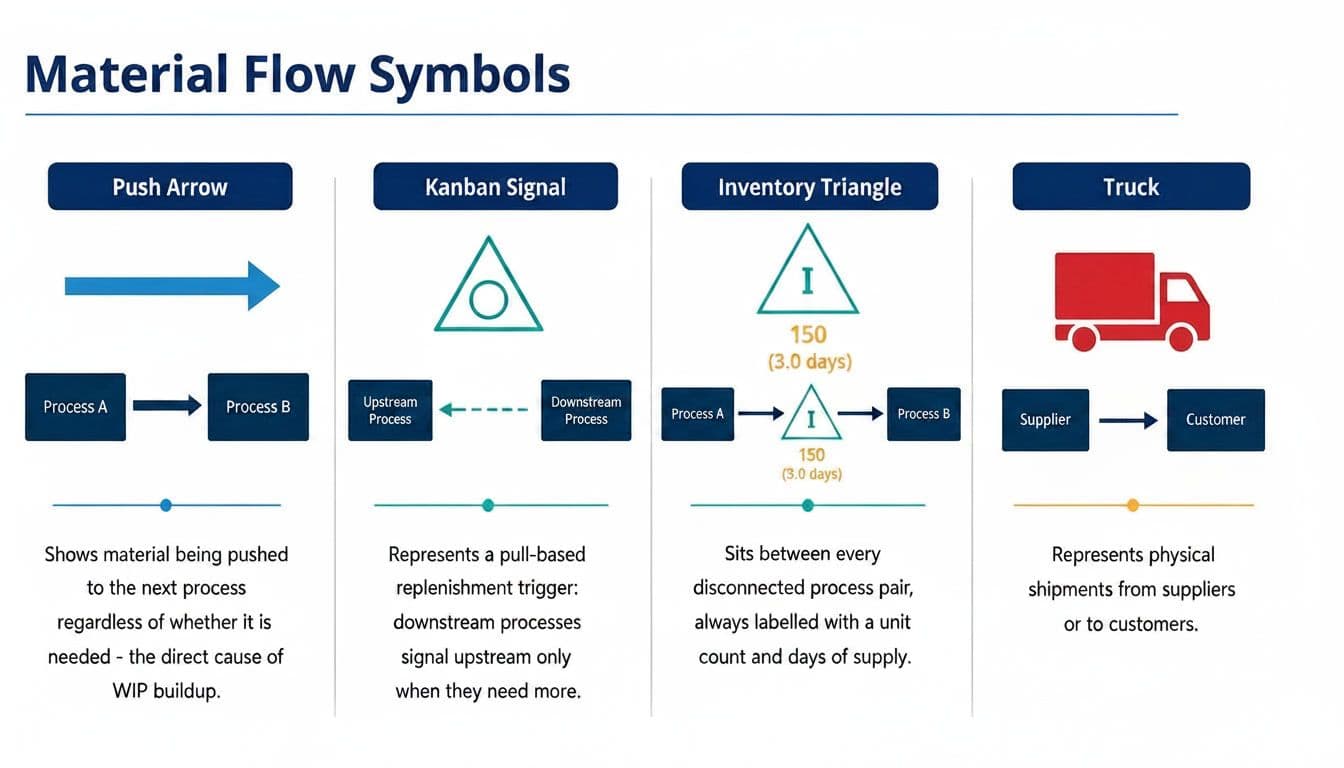
- The Push Arrow (straight filled arrow) shows material being pushed to the next process regardless of whether it is needed - the direct cause of WIP buildup.
- The Kanban Signal (triangle with circle) represents a pull-based replenishment trigger: downstream processes signal upstream only when they need more.
- The Inventory Triangle sits between every disconnected process pair, always labelled with a unit count and days of supply.
- The Truck icon represents physical shipments from suppliers or to customers.
Information Flow Symbols
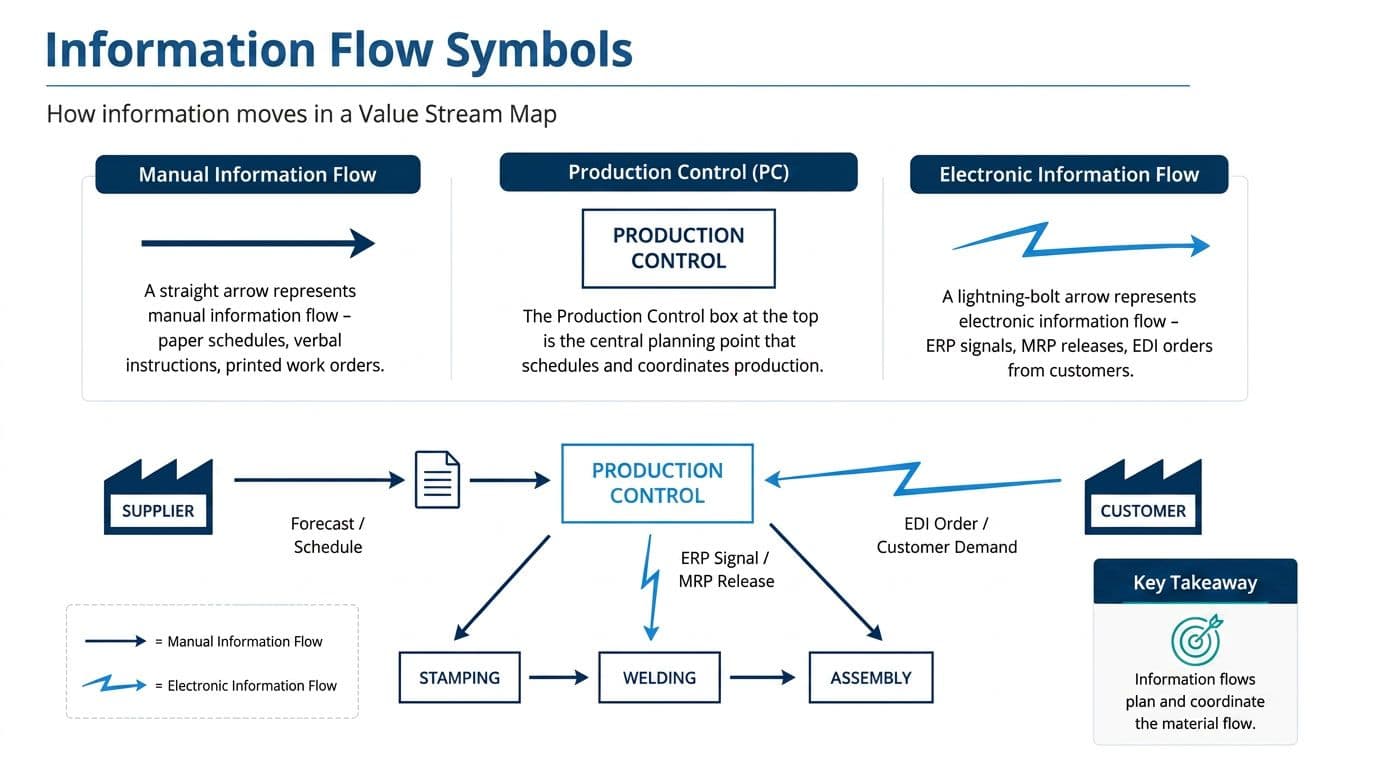
- A straight arrow represents manual information flow - paper schedules, verbal instructions, printed work orders.
- A lightning-bolt arrow represents electronic information flow - ERP signals, MRP releases, EDI orders from customers.
- The Production Control box at the top of the map is your scheduling function.
On most current-state maps, it connects individually to every process box, which is the visual signature of a push system.
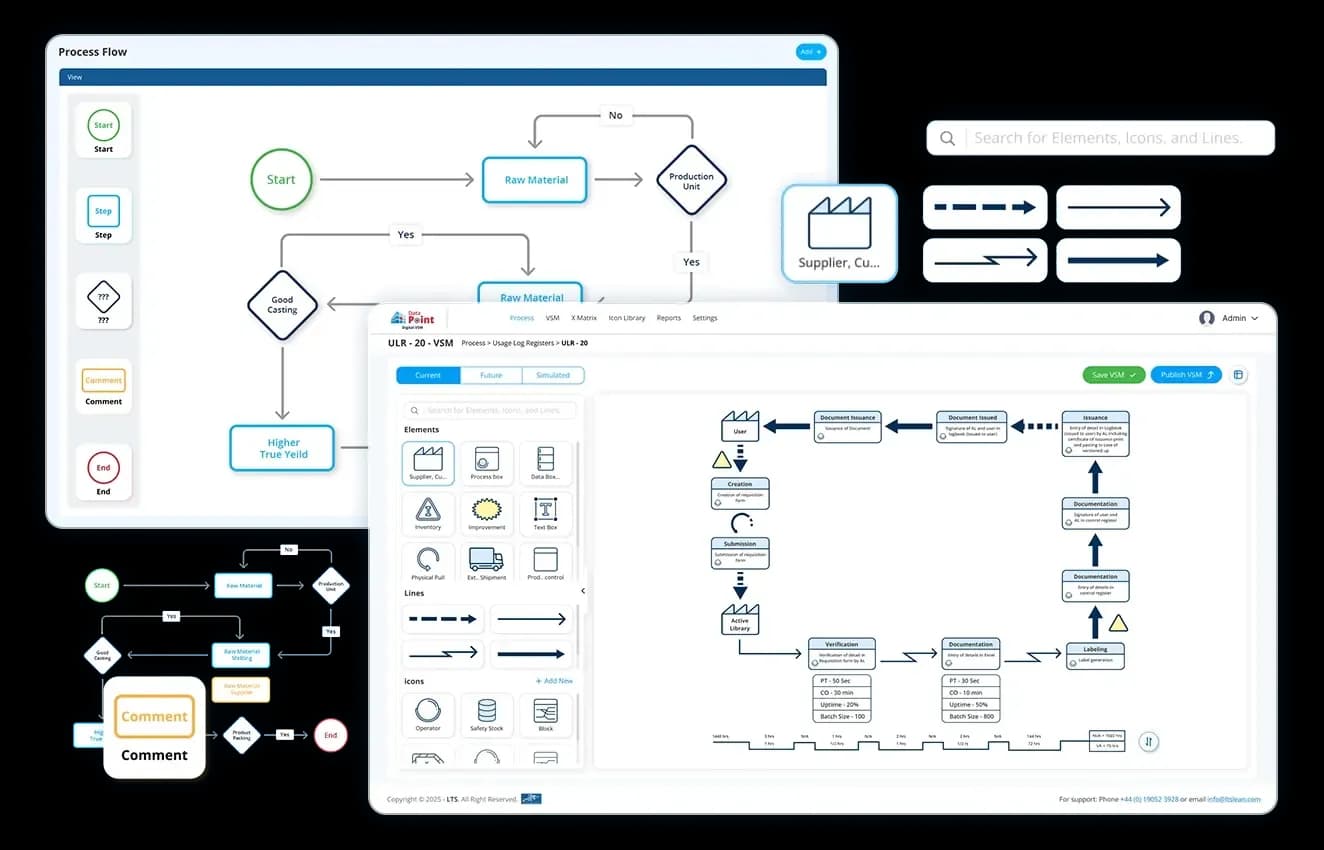
See VSM in Action - Without Drawing a Single Line
Data Point Value Stream Mapping Software connects to your live production data and generates current-state maps automatically. No Visio. No whiteboards. No stale diagrams.A Real Value Stream Mapping Example: Automotive Bracket Manufacturing
Here is the value stream mapping example that matters. A complete, end-to-end manufacturing scenario with real data boxes, a working timeline, and the calculations that expose exactly where your waste is hiding.
The scenario: A tier-two automotive supplier produces stamped steel mounting brackets. Customer demand is 500 units per day. One production shift is available, with 450 minutes of net working time after breaks.
Calculate Takt Time (Your Production Heartbeat)
Takt time is how fast you must produce to match customer demand. Every process step faster than takt time has idle capacity. Every step slower is a bottleneck.
Takt Time = Available Working Time ÷ Customer Demand
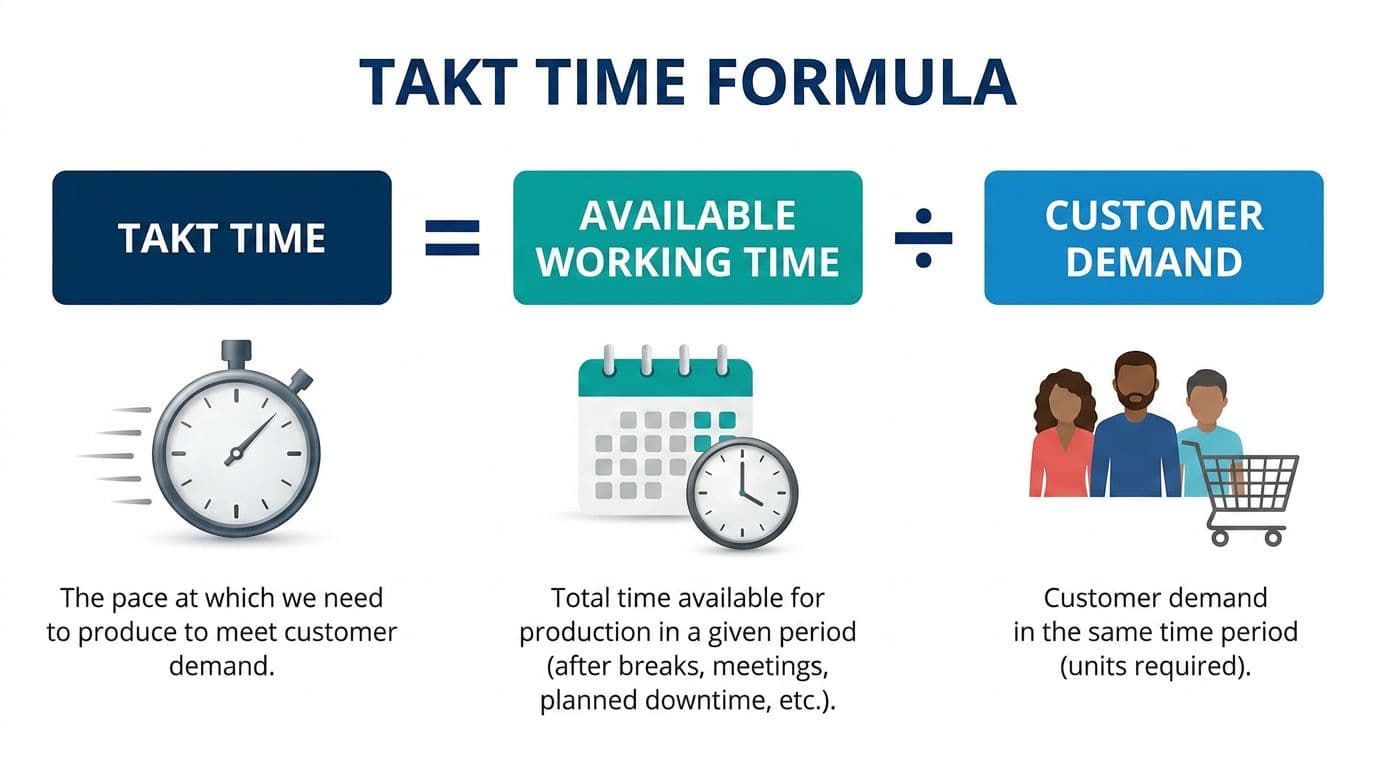
Takt Time = (450 min × 60 sec) ÷ 500 units = 54 seconds per unit
Map the Current State with Data Boxes
The current state maps reality as it exists today - not as documented in SOPs, and not as supervisors describe it. Walk the floor. Measure with a stopwatch. Capture what you see.
Welding's 60-second cycle time immediately exceeds the 54-second takt time - it is the constraint. The 2,500-unit WIP mountain (five days of stock) upstream of it is the direct consequence of Stamping and Deburring running faster than the constraint can absorb.
Build the Timeline: Production Lead Time vs. Value-Adding Time
- Value-Adding Time (VA-T) = 42 + 35 + 60 + 25 + 20 = 182 seconds (~3 minutes)
- Production Lead Time (PLT) = 2.0 + 1.0 + 5.0 + 0.8 + 0.5 = 9.3 days
A bracket that takes 3 minutes to make spends 9.3 days in your factory. That gap is the story of your current state.
Calculate Process Cycle Efficiency (PCE)
- PCE = VA-T ÷ PLT PCE = 182 sec ÷ (9.3 days × 28,800 sec/day) = 0.07%
Less than one tenth of one percent of your total lead time is creating value. Most manufacturers land between 0.05% and 5% on their first current-state map. The shock of that number is exactly what drives kaizen action.
Identify the Kaizen Bursts (Future State Targets)
Three kaizen bursts emerge immediately from this value stream mapping example:
Kaizen #1 - Welding Constraint. Reduce welding C/T from 60 sec to ≤50 sec through fixture redesign or operator cross-training. Eliminates the 5-day WIP mountain.
Kaizen #2 - Stamping Changeover (SMED). A 45-minute changeover forces large batch production, creating 2 days of inventory buffer. Applying Single Minute Exchange of Die reduces this to under 10 minutes, enabling smaller, demand-matched batches.
Kaizen #3 - Pull System. Replace ERP push scheduling to all five processes with a kanban-controlled pull system from the pacemaker (Welding) only.
Future state target PLT: 1.8 days. Future state PCE: ~0.4% — a 5× improvement.
Tired of Drawing This by Hand?
Data Point auto-generates VSM directly from your production floor data.Value Stream Mapping Examples Across Industries
While manufacturing is where VSM was born, the technique has proven effective wherever there is a repeatable flow of work. Here are value stream mapping examples adapted to five major sectors.
VSM in Discrete / Automotive Manufacturing
The bracket example above. Key metrics: takt time, cycle time, changeover time, OEE, WIP days. The primary wastes identified are overproduction, waiting, and excess inventory. Data boxes contain C/T, C/O, and Uptime %.
VSM in Process / Chemical Manufacturing
Process VSMs map batch flow rather than unit flow. Process steps become "blending tanks," "reactors," and "filling lines." Cycle time is replaced by batch cycle time and changeover refers to clean-in-place (CIP) duration. WIP is measured in tonnes or litres. The bottleneck analysis logic is identical - but the symbols and terminology adapt to the process environment.
VSM in Healthcare
Hospitals use VSM to map patient pathways; from emergency triage to discharge, or from referral to surgery. Value-adding steps are clinical interventions. Non-value-adding steps are wait times in queues, duplicate paperwork, and handoff delays. Lead time becomes "door-to-discharge time." VSM has been used to cut patient wait times in stroke pathways and surgical booking processes by 40–60%.
VSM in Logistics and Supply Chain
Supply chain VSMs extend the map beyond the four walls of a single factory to include supplier lead times, inbound freight schedules, and distribution centre dwell time. The goal is to identify where stock accumulates across the chain - not just inside the plant. This version of VSM is sometimes called "extended VSM" or "macro VSM."
VSM in Software Development (Agile / DevOps)
In software, the "product" is a feature or user story. Process steps become backlog refinement → design → development → code review → QA → deployment. Value-adding time is active coding or testing. Non-value-adding time is queue wait between stages, rework loops, and approval bottlenecks. VSM in software often reveals that features spend 80–90% of their time waiting in queues, not being worked on.
Looking for a complete Value stream mapping software for your manufacturing operations? Read this guide and choose: 7 Best Value Stream Mapping software for Manufacturing & Operations Teams
What Are the 8 Wastes That VSM Helps You Identify?
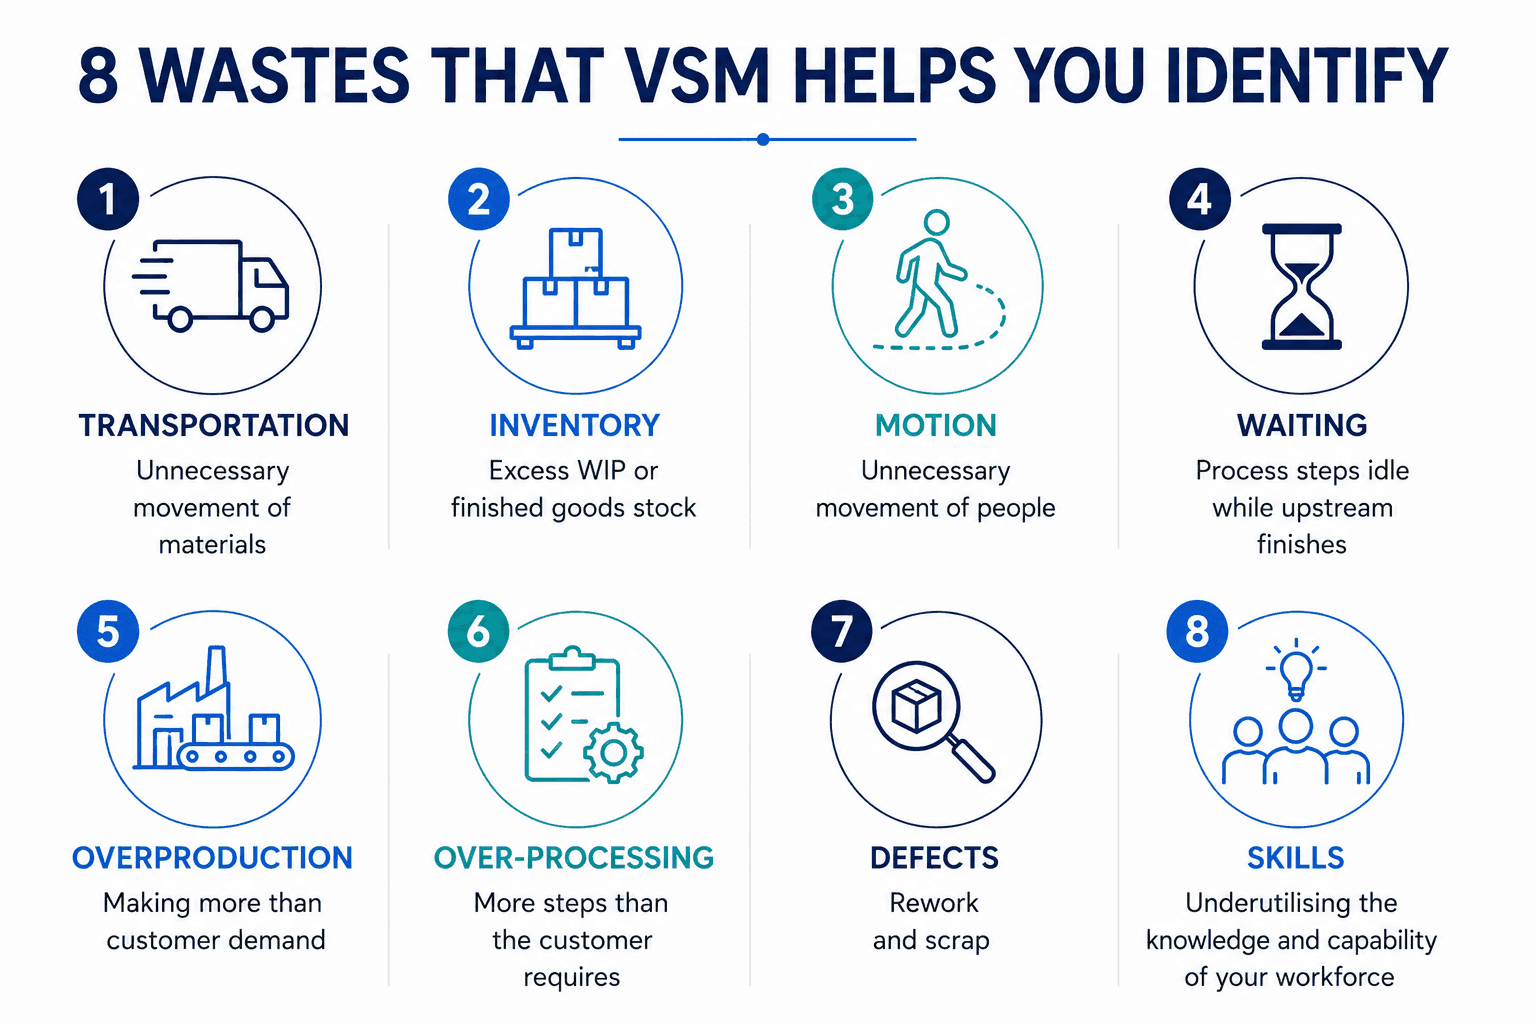
One of the primary reasons lean teams use a value stream mapping example as their starting point is that it makes the Toyota Production System's eight wastes visible - not as a checklist, but as a live map of your process.
The eight wastes (often remembered as TIM WOODS) are:
- Transportation (unnecessary movement of materials)
- Inventory (excess WIP or finished goods stock)
- Motion (unnecessary movement of people)
- Waiting (process steps idle while upstream finishes)
- Overproduction (making more than customer demand)
- Over-processing (more steps than the customer requires)
- Defects (rework and scrap)
- Skills (underutilising the knowledge and capability of your workforce)
In our bracket manufacturing value stream mapping example, the map immediately surfaced Inventory (2,500 units before Welding), Waiting (9.3-day PLT against 3-minute VA-T), and Overproduction (Stamping running faster than the constraint). Without the map, these would remain invisible to leadership — felt as "it's always been like this" rather than quantified as a specific, fixable cost.
What Is the Difference Between VSM and Process Mapping?
A process map (or flowchart) documents the sequence of activities within a single process or department. It answers: "what steps happen, and in what order?"
A value stream map captures the entire flow from supplier to customer, across all departments, and adds the critical dimension of time and inventory quantity at every step. It answers: "how does value actually flow, where does it stop, and how long does everything take?"
Why Real Manufacturing Teams Struggle with VSM
Even with a textbook value stream mapping example in hand, implementation fails more often than it should. Practitioners in lean communities are direct about the reasons.
- Mapping from memory, not from the floor: The most cited mistake across lean forums is teams drawing the current state from SOPs or supervisor descriptions rather than walking the process with a stopwatch. Memory flatters. The stopwatch does not.
- Skipping the information flow: Most teams accurately map material movement but draw a single arrow from "ERP" to "Shop Floor." In reality, how demand signals reach upstream processes - and how they trigger overproduction - is often where the root cause of WIP lives.
- Choosing the wrong product family: Picking the highest-volume SKU instead of the most problematic family is a classic shortcut that produces a clean map of a healthy process while the real pain point goes unexamined.
- Creating a beautiful map that drives no action: A Reddit r/manufacturing thread on VSM results surfaced this repeatedly: VSM delivers strong results when plant leadership actively participates in the kaizen. When the map becomes a management presentation artifact instead of a kaizen trigger, it generates no return. As one practitioner put it: "A laminated VSM on the wall is its own kind of muda."
- Confusing cycle time with lead time: These are not interchangeable. Cycle time is how long one operator takes to complete their work elements. Lead time is how long it takes one unit to travel the full length of the value stream. Your PCE is the ratio of total cycle time to total lead time - and for most manufacturers, it is under 1%.
Can Value Stream Mapping Be Applied to New Product Development (NPD)?
Yes. This is one of the most active questions in lean and product development communities. Applying VSM to NPD means mapping the flow of information and decisions rather than the flow of physical materials.
Value-adding time is active design or testing work. Non-value-adding time is approval queue wait, rework loops caused by late-stage changes, and cross-functional handoff delays.
The core challenge is that NPD flows are less repetitive than manufacturing flows - each project is somewhat unique. The solution is to map the type of flow (the generic NPD process), not a specific project, identify the systemic bottlenecks (often the approval gates), and apply kaizen to the process infrastructure rather than to one project. Companies that have applied VSM to NPD consistently find that 60–80% of development time is spent waiting rather than doing.
Digital VSM vs. Paper and Static VSM - Which Should You Use?
This question divides lean practitioners, and the answer depends honestly on where your team is in its lean journey.
Paper VSM is still the right starting point when a team is learning to see. Walking the floor, drawing by hand, and arguing about what belongs on the map is itself a learning experience that no software can replicate. But for ongoing operations management; where the value stream is changing every week - a static map is a liability, not an asset.
Data Point Value Stream Mapping Software- Your complete manufacturing VSM system
This is exactly the problem Data Point Value Stream Mapping Software is built to solve.
Ready to Run Live VSM Across Your Plant?
Types of Value Stream Mapping Tools (From Sticky Notes to Smart Software)
Not every team needs enterprise VSM software on day one. Here is a practical breakdown of the tool categories available:
1. Hand-drawn / Whiteboard
The original method. A roll of brown paper, a pencil, sticky notes for data boxes, and standard VSM icon stamps. Ideal for first-time mapping exercises and Gemba-based team workshops. Zero cost. Maximum learning.
2. General diagramming software (Visio, Lucidchart, PowerPoint)
Widely used for producing shareable, presentation-ready maps. VSM stencil libraries are available for all three. The limitation is manual data entry and no connection to live production systems - the map is a snapshot that ages immediately.
3. Dedicated VSM drawing tools (iGrafx, Minitab Workspace)
Purpose-built for lean teams. Include VSM-specific symbol libraries, built-in waste analysis, and some simulation capability for future state modelling. Still manually updated, but the workflow is faster and the output more standardised than general tools.
4. Live / Automated VSM platforms (LTS Data Point)
Connect directly to production data sources - MES, ERP, IoT sensors to generate and maintain a current-state map without manual data collection. Data boxes populate in real time. Lead time and PCE calculations update automatically. Kaizen improvements are visible in the map the moment they take effect on the floor. This is the category purpose-built for operations teams who need VSM to be a living management tool, not a periodic workshop output.
How Do You Know Your Value Stream Map Is Working- Benefits of VSM
This is the question lean teams rarely ask but should ask first. A VSM exercise is working when it produces measurable, tracked improvement - not just a map. Here are the three metrics every team should monitor after completing a current-state map and launching kaizen actions:
- Production Lead Time (PLT) reduction
Your current-state PLT is your baseline. Measure it again after each kaizen cycle. In our bracket example, the target is to move from 9.3 days to 1.8 days. Any improvement in WIP inventory quantity at any inventory triangle should translate directly to PLT reduction.
- Process Cycle Efficiency (PCE) increase
Your current-state PCE is your diagnostic number. Rising PCE means your kaizen actions are successfully converting wait time into flow. Moving from 0.07% to even 0.5% represents a transformational shift in how your value stream operates.
- Kaizen completion rate
How many of the kaizen burst actions identified on the future state map were actually executed, on time, with measured outcomes? In lean communities, a common insight is that the quality of the kaizen follow-through matters more than the quality of the map itself. Track it explicitly.
Ready to Build Your Own Value Stream Map?
This value stream mapping example gives you the what and the how. The next step is applying it to your own shop floor.
- To explore manual and software VSM options: Read our guide to the Best Value Stream Mapping Software for a full tool comparison with templates.
- To automate your value stream map with live production data: Explore Data Point Value Stream Management Software and see how manufacturing teams generate accurate, always-current maps without a single manual drawing session.