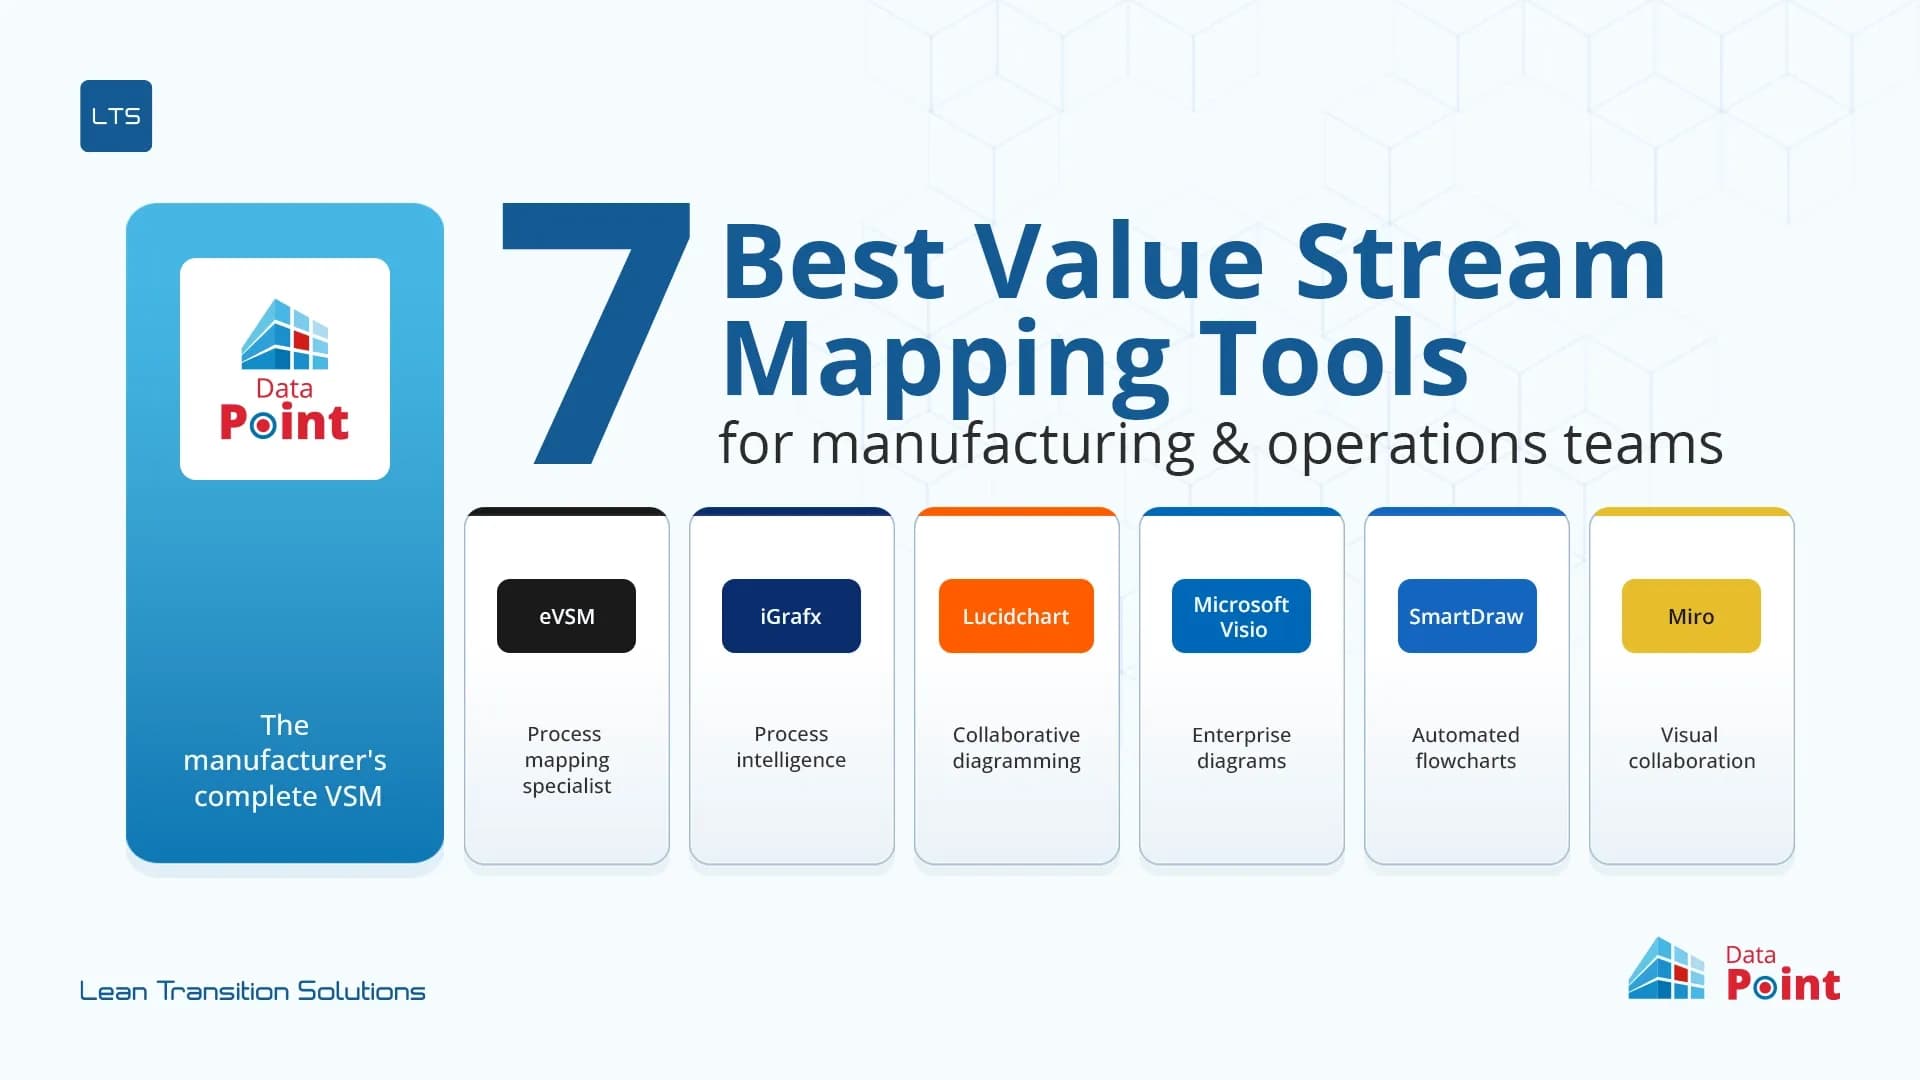
7 Best Value Stream Mapping software for Manufacturing & Operations Teams (2026)
Last updated on : May 11, 2026
Value stream mapping (VSM) is a lean management technique used to visualise, analyse, and improve the flow of materials and information required to bring a product or service to the customer.
Choosing the Right VSM Software
Choosing the best value stream mapping software for manufacturing is one of the most impactful decisions a lean or operational excellence team can make. The wrong tool keeps improvement inside the workshop. The right one sustains it long after the workshop ends.
This guide compares seven leading VSM platforms across the capabilities that matter most to manufacturing and operations teams: mapping quality, VA/NVA automation, process simulation, strategy alignment, and structured execution. Whether you are digitising paper VSMs for the first time or replacing a tool that no longer meets your needs, this comparison gives you a clear picture of what each platform actually does and, just as importantly, where it stops.
What to Look for in VSM Software
Not all value stream mapping tools are built for the same purpose. Before comparing platforms, it helps to know the capabilities that separate a drawing tool from a genuine lean improvement system:
- Dynamic VA/NVA/BVA classification: automated, not manual
- PCE (Process Cycle Efficiency) calculation: built-in, per process and per VSM version
- Process simulation: ability to test improvements before committing resources
- Strategy alignment: connection to Hoshin Kanri X Matrix or equivalent
- Structured execution: Kaizen, Breakthrough Plans, action tracking
- Version control: full history, duplication, and audit trail
- Enterprise readiness: SSO, multi-user, unlimited storage, compliance
- Pricing: transparent tiers suited to team size and lean maturity
With those criteria set, here are the seven best value stream mapping software platforms available to manufacturing and operations teams in 2026.
1 LTS Data Point Digital VSM by Lean Transition Solutions
The best value stream mapping software for manufacturing: map, simulate, align, and execute in one platform
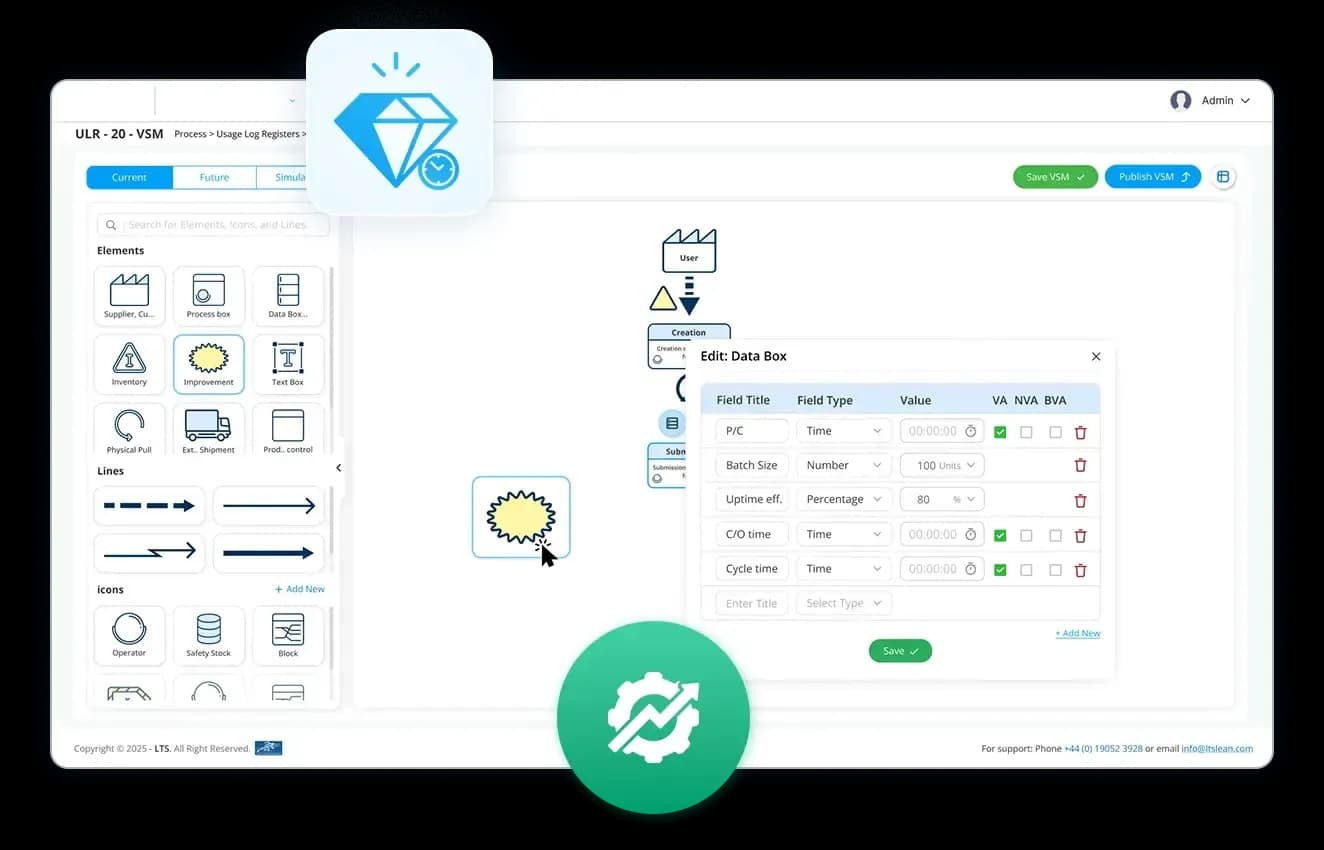
LTS Data Point Digital VSM is the best value stream mapping software for manufacturing and operations teams that need improvement to move beyond the workshop and into sustained execution. It is built as a complete lean operating system. But it is also a fully featured value stream mapping software and process flow mapping tool with an intuitive drag-and-drop interface, the full lean symbol set, and real-time collaboration. Teams can create, share, and iterate on value stream maps from day one, with no specialist training required.
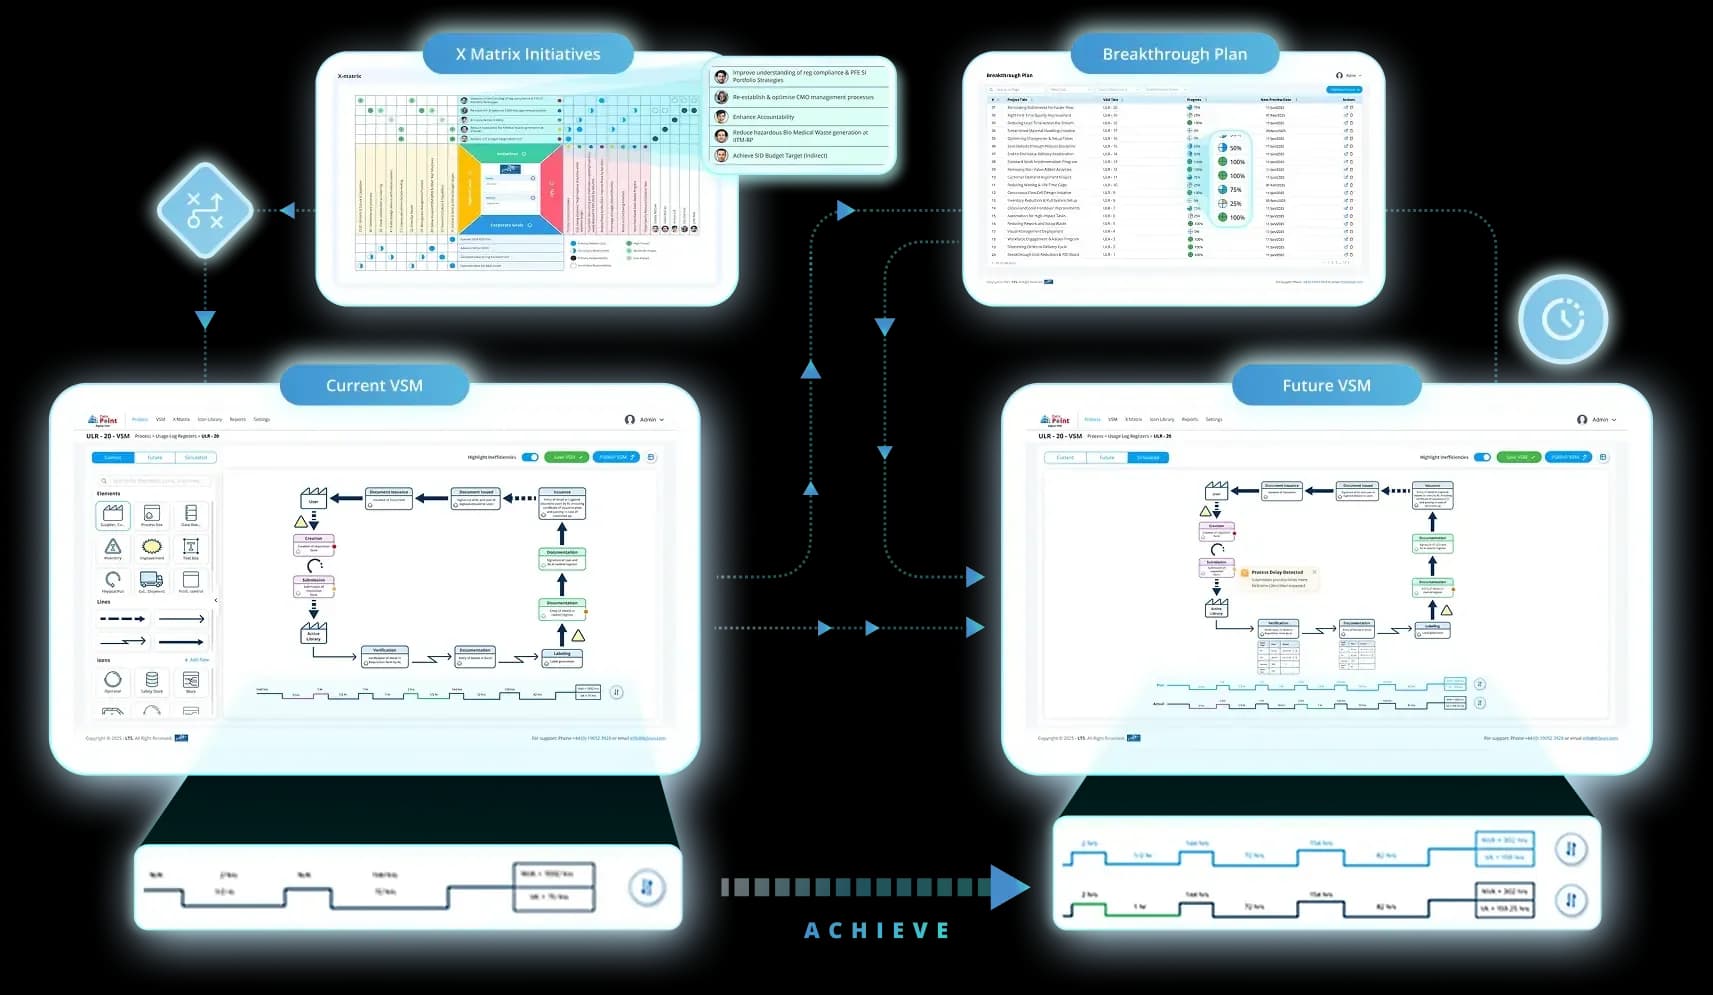
What separates Data Point from every other platform in this list is what happens after the map is drawn. Where other tools stop at the diagram, Data Point connects four integrated capabilities: Digital VSM creation, live process simulation, Hoshin Kanri X Matrix strategic alignment, and Breakthrough Action Planning, all in a single connected system.
Start with the map. Go as deep as you need.
Data Point is designed to meet teams at every stage of lean maturity. Whether you are creating your first digital current-state map or running multi-site improvement programmes across a regulated enterprise, the platform scales with you.
Mapping and diagramming:
- Drag-and-drop VSM builder with the full lean symbol library: ready to use from day one
- Intuitive interface comparable to Lucidchart or Visio, with the analytical depth neither offers
- Real-time collaboration: multiple users editing simultaneously, with live updates and version tracking
- Process flow and value stream mapping for both simple workflow visualisation and complex multi-level VSMs.
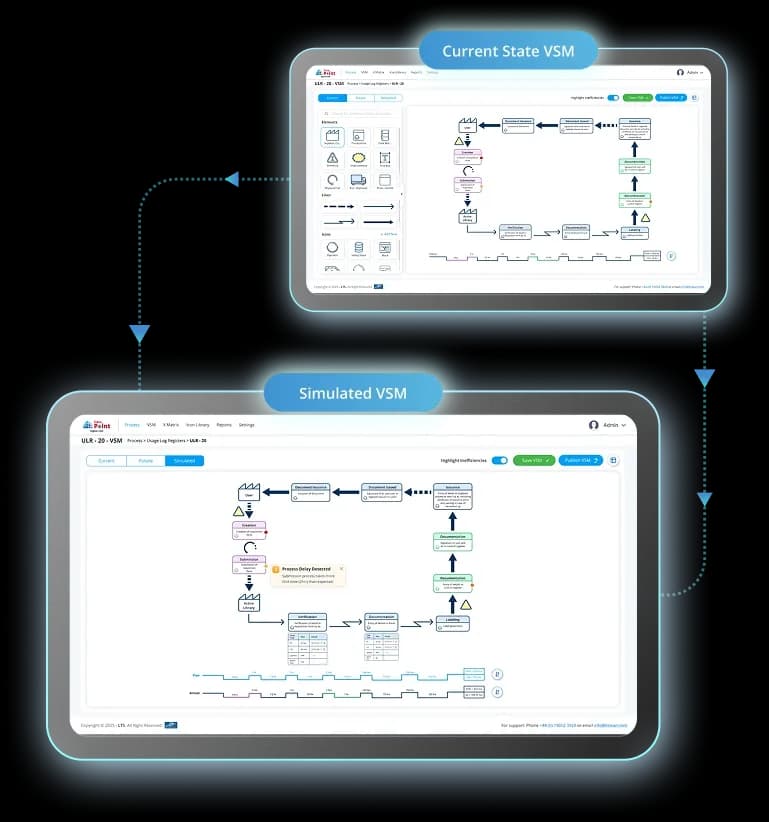
- Three VSM types switchable in one click: Current State, Future State, and Simulated View
- Interactive data boxes per process step: cycle time, changeover, batch size, uptime, and custom fields
- Multi-level VSM hierarchy: process, department, and organisation
Lean analytics:
- Automatic VA/NVA/BVA classification with real-time PCE (Process Cycle Efficiency) calculation
- Colour-coded time ladder: highest NVA bottleneck flagged automatically in red/orange
- PCE Deviation report: Standard vs. Future vs. Simulated across all versions
- PCE trend tracking across versions
Simulation:
- Live process simulation with real-time step timers and Process Delay Detected alerts
- Plan vs. Actual comparison across simulation runs
- What-if scenario testing before committing resources or implementing changes
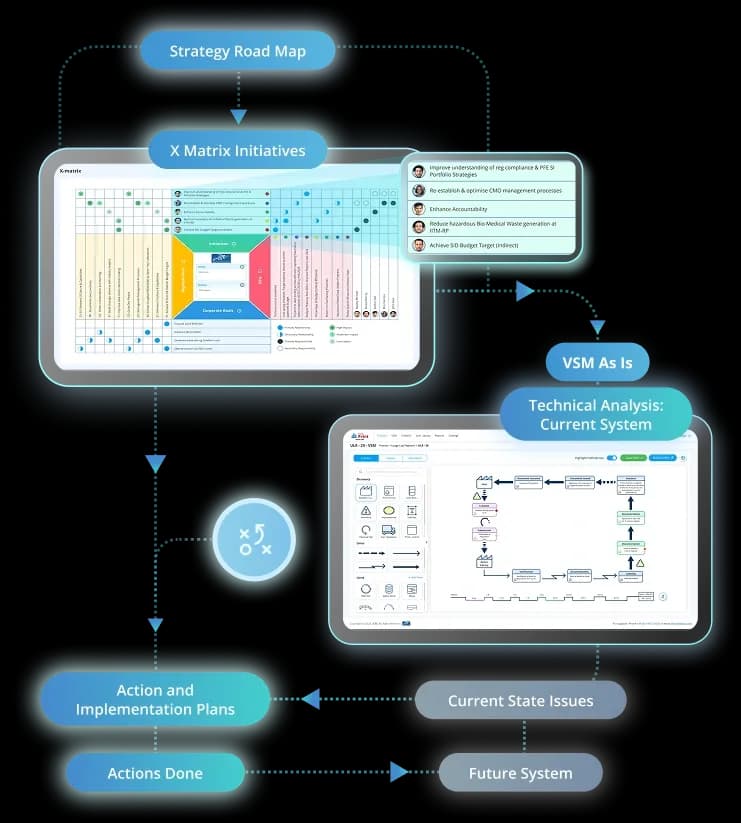
Strategy alignment:
- X Matrix Hoshin Kanri: multi-tier strategic roll-down from enterprise level through to individual process step
- Direct VSM-to-strategy linkage: process insights connect upward to enterprise KPIs
- Strategic alignment dashboards connecting team-level actions to organisation-wide priorities
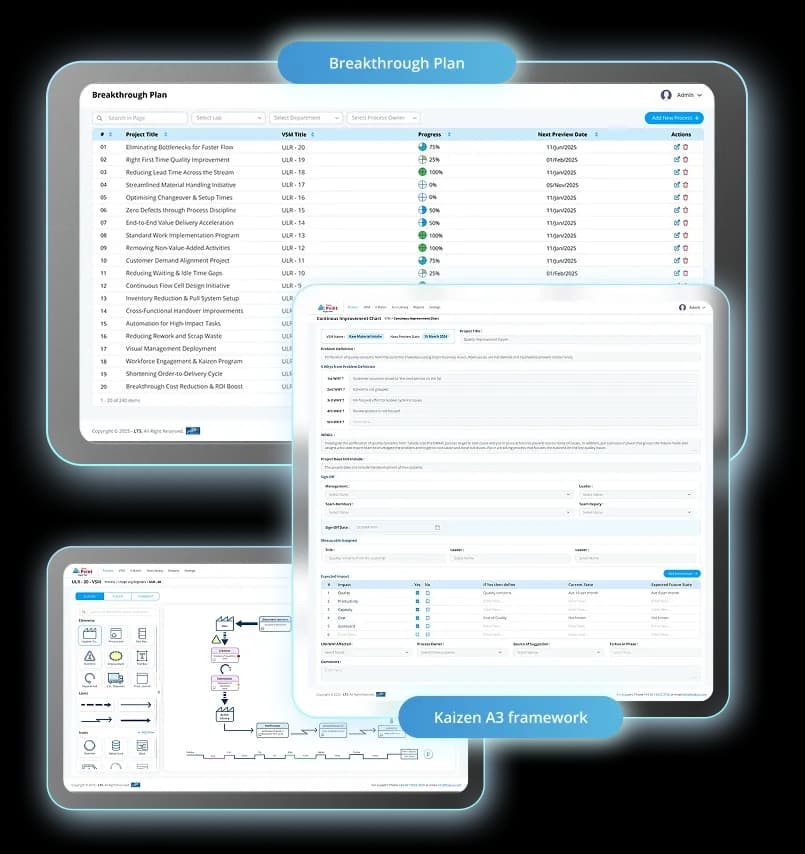
Execution and continuous improvement:
- Breakthrough Action Plans with Kaizen A3 (5-Why, WDGLL, PDCA), impact matrix, and management sign-off
- Continuous improvement tracking: owners, deadlines, and verified closure
- KPI tracking software linked from VSM insights through to enterprise performance dashboards
- Customised reports: Goal vs. Actual, PCE trends, task completion, and breakthrough plan progress
Enterprise readiness:
- Full version control, activity log, and audit history: essential for regulated industries
- SSO integration, unlimited users, unlimited storage: enterprise-ready out of the box
- MES and ERP integration: connect existing operational data directly into your value stream maps
- Secure cloud hosting, backup, and recovery support
- Guided onboarding, team training, and dedicated implementation support
Pricing: flexible packages built for lean teams
Data Point is available on custom pricing across three tiers, designed to reflect the size, scope, and lean maturity of your programme:
Best for: Manufacturing, pharma, autombile, aerospace and any other regulated industries needing a complete map-to-execution lean system. Lean and CI leaders who need strategy and VSM connected. Multi-site enterprise teams. Teams replacing Visio, Lucidchart, or Miro with a dedicated lean improvement platform.
Limitation: Focused on lean manufacturing and operations. Not designed for software delivery pipeline management.
Why Data Point is ranked #1
It is the only platform that closes the entire lean loop. Map waste in the current state, validate improvements through simulation, align to strategic priorities via the X Matrix, and drive to verified closure through structured Kaizen and Breakthrough Plans. Every other tool in this list handles one or two of these layers. Data Point handles all four, in one system, at any scale.
Your current VSM tool shows you the waste. Data Point helps you eliminate it, validate the fix, align it to strategy, and track it to closure.
2. eVSM by the eVSM Group
The specialist for mixed-model, multi-product value stream mapping
eVSM has been a dedicated digital VSM tool for over two decades. It is particularly strong for mixed-model production environments where multiple product variants share the same resources. It automates key lean metrics including lead time, capacity, inventory, and cost, and supports plant production, supply network, and transactional VSM types.
- Mixed-model VSM: multiple product variants with different demands on shared resources
- Automated analytics for lead time, capacity, resource utilisation, inventory, and cost per VSM
- Industry-specific applications for manufacturing, pharma, food, chemicals, and healthcare
- Full improvement cycle: current state, waste identification, improvement ideas, future state
- Spaghetti diagramming, Kanban calculations, and changeover lean tools included
- Partial simulation capability for basic scenario modelling
Best for: Mixed-model and multi-product manufacturing sites. Lean teams needing deep automated metric analytics. Pharma and food production environments.
Limitation: No X Matrix/Hoshin Kanri integration, no live simulation mode, no structured action planning or Kaizen A3. Improvement insights require external tools to track through to execution.
3. iGrafx
Enterprise process intelligence with strong simulation capability
iGrafx is an enterprise process modelling and management platform with a strong VSM module and one of the more mature simulation engines in this category. It is widely used for business process management (BPM) and governance, risk, and compliance (GRC) alongside lean process mapping. Its simulation capability enables what-if analysis before implementation.
- Advanced VSM diagramming with lean symbol support and process analytics
- Process simulation and what-if analysis for improvement validation
- Enterprise BPM, GRC, and compliance management alongside VSM
- Customisable dashboards and reporting for process performance
- Strong integration with enterprise tool ecosystems
Best for: Enterprise organisations needing combined BPM, GRC, and lean process improvement. Teams requiring simulation with compliance traceability.
Limitation: No Hoshin Kanri X Matrix or strategy alignment module. No Kaizen A3 structured action planning. VA/NVA classification is not automated in the same way as specialist lean platforms. Higher complexity and implementation cost.
4 .Lucidchart
The most accessible collaborative VSM diagramming tool
Lucidchart is a cloud-based intelligent diagramming platform used widely across industries for VSM and process visualisation. Its strength is ease of use: a clean interface, VSM-specific shape libraries, templates, and excellent real-time collaboration features. It is the natural starting point for teams creating their first digital value stream maps.
- VSM-specific shape libraries and current/future state templates
- Real-time collaboration with comments and simultaneous editing
- Data linking for basic lead time and cycle time annotation
- Integrates with Google Workspace, Microsoft Office, Confluence, and Slack
- Accessible pricing with individual and team plans
Best for: Teams creating their first digital VSMs. Cross-functional collaboration and stakeholder communication. Organisations needing a simple, accessible diagramming tool.
Limitation: No automated VA/NVA/BVA classification or PCE calculation. No simulation. No strategy alignment or action planning. Essentially a drawing tool: process improvement must happen outside the platform.
5. Microsoft Visio
The familiar diagramming standard with VSM templates
Microsoft Visio is the most widely used diagramming tool in enterprise environments and offers VSM templates with standard lean symbols. Its primary advantage is familiarity: most organisations already have it, and most people can open a Visio file. For teams transitioning away from paper-based VSM, Visio is often the first digital step.
- Full lean VSM symbol library and pre-built templates
- Deep Microsoft 365 integration: Teams, SharePoint, Excel data linking
- Widely known interface with a minimal learning curve for Office users
- Available as desktop and web versions
- Supports custom shapes and stencils for specialised processes
Best for: Organisations already using Microsoft 365 needing a basic digital VSM. IT or process teams creating documentation-level maps for stakeholder communication.
Limitation: Static diagrams only. No live data, no VA/NVA automation, no PCE, no simulation, no strategy alignment, no action tracking. Maps become outdated immediately. Collaborative editing requires a separate SharePoint or Teams setup.
6. SmartDraw
Automated diagramming with VSM symbol support
SmartDraw is a feature-rich diagramming tool that automates much of the layout and formatting work involved in creating process maps and VSMs. It supports all standard lean VSM symbols, auto-aligns process flows, and offers templates for current and future state maps. Its standout feature is intelligent auto-formatting: adding or removing a step automatically redraws the diagram.
- Intelligent auto-formatting: VSM redraws automatically when steps are added or removed
- Full lean VSM symbol library with current and future state templates
- Available as web and desktop versions: compatible with Visio files
- Integration with Teams, Slack, and Confluence for collaborative sharing
- Broad template library covering 70+ diagram types beyond VSM
Best for: Teams wanting faster VSM creation with less manual formatting. Organisations migrating from Visio who need improved diagramming efficiency.
Limitation: No VA/NVA/BVA automation or PCE calculation. No simulation. No strategy alignment or action planning. Improvement analysis must be done manually in separate tools.
7. Miro
Visual collaboration whiteboard with VSM templates
Miro is an online collaborative whiteboard platform used widely for brainstorming, process mapping, and team workshops. It offers VSM templates with lean symbols as part of a much broader visual collaboration toolkit. Its primary strength is facilitation: it is excellent for running live VSM workshops with distributed teams.
- VSM templates with standard lean symbols on an infinite canvas
- Excellent real-time collaboration for remote and distributed teams
- Wide range of workshop facilitation tools: sticky notes, voting, timers
- Integrations with Jira, Confluence, Google Workspace, and more
- Well suited to rapid ideation and collaborative current-state capture sessions
Best for: Remote and distributed teams running VSM workshops. Initial brainstorming and current-state capture sessions. CI teams needing a flexible digital whiteboard.
Limitation: No VA/NVA/BVA classification, no PCE, no simulation, no strategy alignment, no action planning. No structured lean methodology: functions as a whiteboard, not a VSM system.
Feature Comparison at a Glance
The table below summarises the core lean capabilities of each platform across eight dimensions that matter most to manufacturing and operations teams.
How to Choose the Right VSM Software for Your Team- The Bottom Line
The right tool depends on where your team sits in the lean maturity journey and what you need the software to do after the map is drawn.
Most value stream mapping software helps teams draw better maps. Fewer help teams act on what those maps reveal. Almost none connect what the map reveals to the organisation's strategic priorities.
- For teams at the diagramming stage, Lucidchart, SmartDraw, or Miro are solid, accessible starting points.
- For teams needing deeper analytics in mixed-model environments, eVSM and iGrafx offer genuine specialist capability.
- For manufacturing and operations teams serious about lean transformation, the best value stream mapping software for manufacturing is Data Point Digital VSM.
It is the only platform in this comparison that integrates VSM creation, process simulation, Hoshin Kanri strategy alignment, and Breakthrough Action Planning in a single connected system. Not four tools bolted together. One platform, designed end to end for lean improvement.
FAQs
1. What is the best free value stream mapping software?
Lucidchart and Miro both offer free plans that include VSM templates and basic diagramming. They are well suited to teams creating their first digital maps or running collaborative workshops. For teams that need automated lean analytics, simulation, or strategy alignment, a paid platform will be necessary. Data Point Digital VSM offers a free demo and trial so teams can assess the full system before committing.
2. Can I do value stream mapping in Excel or PowerPoint?
Yes, basic VSMs can be built in Excel or PowerPoint using shape libraries and manual annotations. However, these are static documents with no automation, no live metric calculation, no version control, and no connection to execution or strategy. They require significant manual effort to maintain and quickly become outdated. Purpose-built VSM software eliminates these limitations.
3. What is the difference between value stream mapping and process mapping?
Process mapping documents the steps in a single process, typically showing inputs, outputs, and decision points. Value stream mapping takes a broader view: it maps the entire flow of materials and information from supplier to customer, quantifies waste at each step, and calculates process cycle efficiency (PCE). VSM is specifically designed to identify and eliminate lean waste across the whole value stream, not just within a single process. Data Point supports both: process flow and value stream mapping are available within the same platform.
4. Which VSM tool is best for pharma and regulated industries?
Regulated industries require version control, audit trails, and traceability of changes. eVSM has industry-specific applications for pharma. Data Point Digital VSM includes full version history, activity logs, audit trails, and SSO integration, making it particularly well suited to pharma, healthcare, and life sciences environments where compliance and traceability are non-negotiable.
5. Does Data Point replace tools like Lucidchart or Visio entirely?
For manufacturing and operations teams, yes. Data Point includes a full drag-and-drop VSM builder with the lean symbol set, real-time collaboration, and all the diagramming functionality those tools offer, plus the analytical, simulation, strategy, and execution layers they do not. Teams migrating from Visio, Lucidchart, or Miro will find everything they needed from those tools already inside Data Point, with significantly more depth.
6. What does PCE (Process Cycle Efficiency) mean in VSM?
Process Cycle Efficiency is the ratio of value-added time to total lead time in a value stream, expressed as a percentage. A higher PCE means more of the time spent in the process is adding value to the customer. PCE is one of the key metrics in lean manufacturing: identifying and eliminating non-value-added (NVA) activities raises PCE and reduces waste. Data Point calculates PCE automatically for each process step and across the full value stream, and tracks it across VSM versions so improvement is measurable.
7. Can Data Point connect VSM to our KPI dashboards?
Yes. Data Point connects VSM insights directly to KPI tracking and data visualisation dashboards, Hoshin Kanri X Matrix strategy alignment, and balanced scorecard performance dashboards. Process-level improvements in the VSM are traceable through to enterprise KPIs, giving leadership full visibility from the shop floor to the boardroom.