Top Features of an Aerospace Metrics Management Dashboard for Performance Tracking

Last updated on : March 3, 2026
Managing performance in the aerospace industry isn’t easy. Between juggling Key Performance Indicators (KPIs), keeping teams aligned, and making sense of scattered data, managers often feel like they’re flying blind. Reports take too long, insights come too late and tracking what really matters becomes a daily struggle. That’s where an aerospace metrics management dashboard steps in – bringing all your key data into one place, helping you spot issues early, and make smarter decisions faster. In this blog, we’ll take a closer look at what an aerospace metrics management dashboard is, why it’s essential, and the key features that help aerospace teams monitor KPIs, improve quality, ensure compliance, and stay ahead of potential issues before they escalate.
Discover the best aerospace metrics management dashboard with LTS Data Point
What is an aerospace metrics management dashboard and why does it matter?
An aerospace metrics management dashboard is a centralised, real-time digital system that monitors and visualises the key performance metrics that matter most in aerospace operations – quality, safety, production, maintenance, compliance, supply chain performance, and program delivery.
Think of it more like the original source of truth that links data across shopfloor, engineering, quality, procurement, and program management so leaders can make fast, confident decisions.
Aerospace metrics management dashboard: Why it matters?
How many plane crashes have you heard of that are accidents or due to system failure? Or how many airlines have you heard delayed? Rare, right? That's mainly because aerospace has zero tolerance for defects, delays, or compliance gaps.
An aerospace metrics dashboard is necessary for several reasons:
- Faster, data-driven decisions: No waiting for weekly or monthly reports – teams can act instantly when a process drifts out of control.
- Prevents defects and nonconformities: Real-time visibility assists in spotting issues before they escalate into rework, scrap, or escapes.
- Ensures safety and regulatory compliance: Live tracking of audit findings, FOD events, NC trends, and documentation ensures readiness for AS 9100, NADCAP, and FAA/EASA regulations.
- Reduces cost and enhances throughput: Better monitoring = less downtime, fewer delays, improved OTD, and optimised resource utilisation.
- Strengthens supplier performance: Dashboards emphasise supplier risks early so teams can intervene before a line stoppage.
- Aligns teams across the process: Everyone – from shopfloor operators to directors – works with a single unified view, minimising miscommunication.
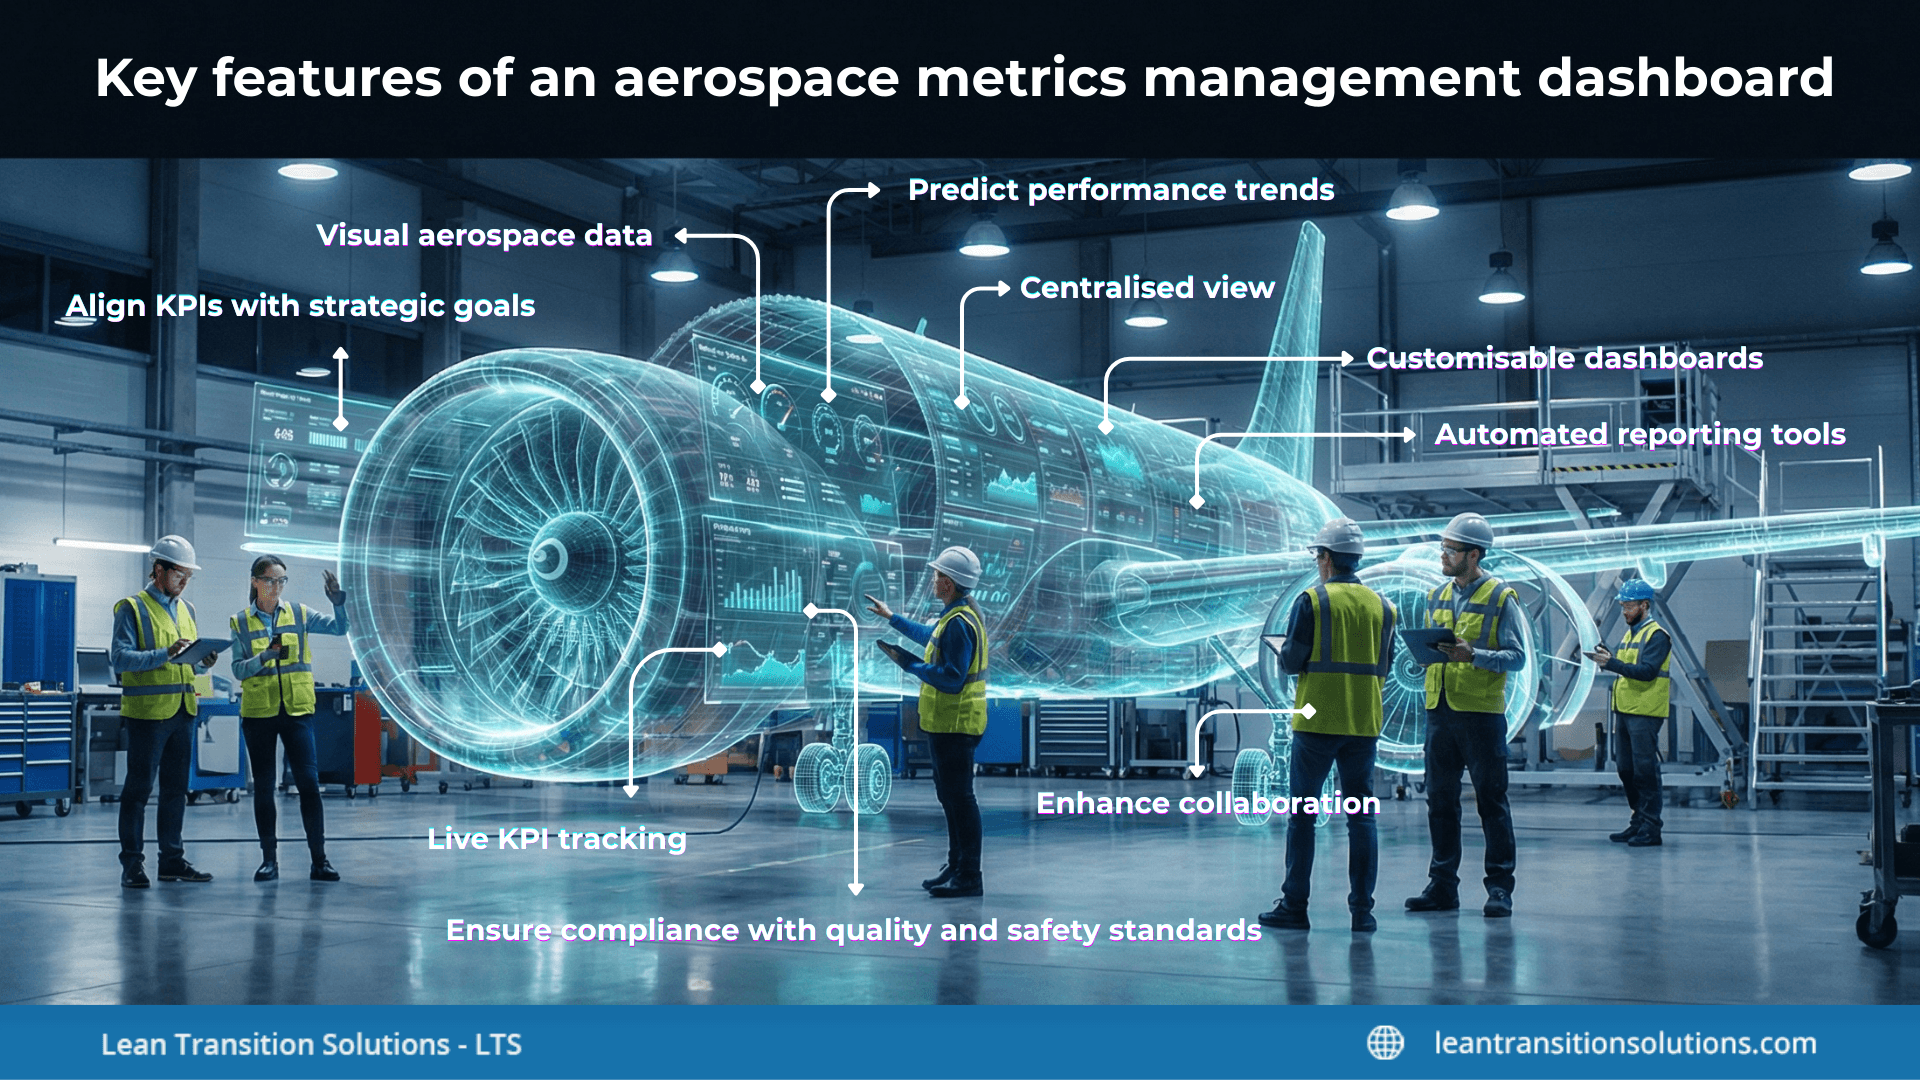
Key features of an aerospace metrics management dashboard
When you're managing aerospace operations, every second counts – and so does every metric. But without the right tools, tracking performance can feel like chasing turbulence. From delayed reports to disconnected data, managers often struggle to get a clear picture of what’s happening on the ground and in the air. That’s where an aerospace metrics management dashboard makes a real difference. It’s not just about displaying numbers – it's about turning data into decisions.
Let's explore some of the top features of an aerospace metrics management dashboard one-by-one:
- Live KPI tracking: Monitors KPIs in real-time by providing managers immediate visibility into manufacturing, quality, and safety performance by pulling live reports from shopfloor systems, inspections, and supplier updates. Instead of waiting for the shift to end or week to end to get details, teams see deviations the moment they happen – whether it’s a rising defect trends, a bottleneck in assembly, or a supplier delay. This instant insight enables managers to act early, correct issues before they escalate, and maintain consistent schedule adherence, compliance, and throughput across operations.
- Centralised view: Pulls data from MES, ERP, QMS, MRO, and supplier systems into one unified interface, eliminating the need to chase information across multiple tools or spreadsheets. By combining quality, manufacturing, maintenance, and supply chain metrics in a single view, teams get a clear, consistent picture of operational health. This integration lowers data silos, enhances precision, and helps managers quickly spot cross-functional issues – making decision-making quicker, more coordinate, and far more reliable.
- Customisable dashboards: Enable each team, whether it be engineering, quality, manufacturing, maintenance, or supply chain, to tailor metric views to their specific responsibilities. Instead of going through irrelevant data, users can filter KPIs, choose priorities, and design layouts that match their workflow. Quality teams may pinpoint on defect trends and audit findings, engineering may monitor configuration changes, while production tracks takt time, throughput, and station bottlenecks. This role-based customisation ensures every team sees the insights that matter most, improving clarity, accountability, and speed of action across the operation.
- Visual aerospace data: Translates complex functional data into clear charts, graphs, and trend lines that make patterns easy to comprehend at a glance. Instead of interpreting dense reports or raw tables, teams can instantly detect deviations, potential risks, and performance trends. Colour codes, heatmaps, and threshold alerts underlines where attention is needed, helping managers prioritise actions and communicate insights more efficiently. This clarity leads to faster, more accurate decisions that keep production, quality, and compliance enroute.
- Align KPIs with strategic goals: Aerospace KPI dashboards assists teams remain aligned with strategic business goals by connecting daily performance metrics to high-level objectives such as delivery reliability, cost reduction, safety, and regulatory compliance. Rather than monitoring aerospace KPIs in isolation, dashboards show how each metric contributes to broader functional targets and industrial priorities. Leaders can track progress against goals in real time, make sure teams are working toward the same outcomes, and quickly adjust resources or actions when performance drifts. This alignment creates a direct line of sight from the shopfloor to strategic results, strengthening focus, accountability, and execution across the organisation.
- Automated reporting tools: Eliminates the need for manual data collection, spreadsheet updates, and repetitive report preparation. By pulling live information directly from operational systems, these tools generate precise, up to date data instantly saving hours of administrative work and lowering the risk of human error. Teams receive scheduled summaries, alerts, and analytics without much work, enabling managers to focus on problem-solving instead of paperwork. This automation not only enhances efficiency but also assures consistent, reliable documenting across the industry.
- Ensure compliance with quality and safety standards: Support compliance by continuously monitoring the quality and safety metrics required for AS 9100, FAA/EASA regulations, and customer-specific standards. They combine audits, NCRs, FOD events, corrective actions, calibration status, and inspection results into one live view – making it easy to identify gaps before they become findings. Automated alerts notify teams when a metric steps out of tolerance level or when recording is overdue, ensuring nothing is missed. This constant visibility keeps operations audit-ready, strengthens trackability, and helps maintain the rigorous compliance demanded in aerospace.
- Predict performance trends: Makes use of historical reports, patterns and machine-learning models to predict potential issues before they affect operations. By evaluating trends in defects, throughput, maintenance events, and supplier performance, the system can forecast where bottlenecks may form, when equipment might fail, or when quality risks are likely to rise. These forward-looking insights enable teams to take preventive action – adjusting schedules, relocating resources, or addressing root causes early – so operations stay stable, efficient, and disruption-free.
- Enhance collaboration: Shared aerospace dashboards provide every team access to the same live information, creating a transparent and unified view of operational performance. With everyone working from one source of truth, transference become smoother, misunderstandings reduce, and issues are resolved faster. Team members can comment, share insights, and collaborate on corrective actions directly from the dashboard, verifying that problems aren’t isolated within a single department. This enhanced visibility strengthens cross-functional alignment, accelerates decision-making, and cultivates a culture of teamwork across the entire aerospace operation.
- Global aerospace sites: Makes it easy to manage performance across multiple global sites by offering a unified, real-time view of KPIs for every facility, supplier, and operations. Rather than depending on separate data from each location, leaders can compare performance side-by-side, standardise metrics, and ensure consistent quality and compliance worldwide. Centralised visibility assists in spotting regional risks early and rollout enhancements quickly across the network. This scalability allows organisations to maintain uniform standards, streamline operations, and drive global excellence across all aerospace locations.
LTS Data Point: Best software solutions for your organisation
1. Digital Balanced Scorecard (BSC):
- Offers real-time visibility into KPIs (Safety, Quality, Delivery, Cost, Lean etc.) and links strategic goals into operational metrics.
- Integrates with core systems (MES, ERP, maintenance systems) so that the data can be unified from across aerospace operations.
- Supports role-based dashboards and visual strategy maps so that different levels see relevant information.
- The software design enables digital SQDCL (Safety, Quality, Delivery, Inventory/ Lean/ Cost) scorecards to be built and customised to aerospace-specific performance frameworks.
- It also supports root cause analysis and corrective or improvement actions monitoring, which is very valuable for quality control in aerospace.
2. Strategy and execution alignment:
- Through strategy maps, initiatives, and action tracking, aerospace leaders can assure that their lean or continuous improvement operations are aligned to business objectives.
- Supports multiple scorecard frameworks (e.g., SQDCP, SQDCL) so it can be tailored to aerospace-specific performance measurement models.
- Allows structured, auditable action plans – so when a KPI shows a problem (e.g., quality defect spike), managers can assign, track, and close corrective actions.
3. Zero Defect Manufacturing (ZDM) support:
- Offers live tracking of quality metrics (first pass yield, scrap, rework), root cause analysis, and traceability, all of which are key for high-reliability aerospace manufacturing.
- Assists standardise processes (SOPs), which is essential for consistency and reproducibility in aerospace.
4. Scalability and multi-scale visibility:
- Can scale across multiple aerospace sites – production plants, MRO centres, global operations.
- Offers centralised KPI database so leadership can compare performance across units and geographies.
- Historical trend analysis helps in continuous improvement across all locations.
5. Automated reporting and governance:
- Automates the report generation (balanced scorecard reports, KPI dashboards) - lowering manual overhead and risk of error.
- Supports governance through role-based access, meaning only the right people get the data they need, and data security is maintained.
- Due to efficient integration with systems, there’s less rework in data acquisition or normalisation.
Managing aerospace operations can be tough – there's a lot to track, from safety and quality to delivery and compliance. Without the right tools, it’s easy to miss important details or spend too much time chasing reports. That’s where an aerospace metrics management dashboard makes a real difference. It helps teams see what’s happening in real time, spot problems early, and make better decisions faster. If you're looking for a reliable and easy-to-use solution, LTS Data Point is one of the best choices. It brings all your key metrics into one place, supports smart reporting, and helps your team stay focused, efficient, and ready for whatever comes next.
So, what are you waiting for? Choose LTS Data Point now.
FAQs
1. What KPIs should be prioritised in an aerospace metrics management dashboard?
Focus on KPIs that directly impact safety, quality, delivery, and compliance. Examples include first-pass yield, on-time delivery rate, defect rate, audit findings, and supplier performance. These help teams act quickly and avoid costly delays.
2. How often should aerospace metrics management dashboards be updated?
Ideally, dashboards should update in real-time or at least daily. This ensures managers can respond to issues as they happen, rather than waiting for weekly or monthly reports.
3. Can dashboards help with supplier performance tracking?
Yes. Dashboards can highlight supplier delays, quality issues, and delivery trends early allowing teams to intervene before problems affect production.
4. Is it possible to automate data entry in aerospace dashboards?
Absolutely. Most modern dashboards integrate with systems like MES, ERP, and QMS to pull data automatically, reducing manual work and errors.
5. How do dashboards support regulatory compliance?
They track metrics required for standards like AS9100, FAA, and EASA – such as NCRs, FOD events, and audit readiness – making it easier to stay compliant and prepare for inspections.
6. What's the difference between lagging and leading indicators in aerospace KPIs?
Lagging indicators show past performance (e.g., defect rate), while leading indicators predict future risks (e.g., audit findings trend). A good dashboard includes both to support proactive decision-making.
7. Can dashboards be customised for different aerospace teams?
Yes. Role-based dashboards allow engineering, quality, production, and leadership teams to view the metrics that matter most to them, improving clarity and accountability.
8. What's the best way to keep teams engaged with dashboard data?
Keep dashboards simple, relevant, and visual. Use alerts, colour coding, and summaries to make insights easy to understand and act on during daily reviews.
9. Can dashboards be used across multiple aerospace sites?
Yes. Scalable dashboards allow managers to compare performance across global locations, standardise KPIs, and roll out improvements consistently.

Abel Jiménez, Lean Consultant
Abel is a Lean Consultant with over 30 years of expertise in operational analysis, process improvement, and organisational change across Mexican industries. Currently serving as Director of Insurance Promotions at CESCEMEX, he helps organisations leverage technology and lean practices to improve efficiency and manage change with continuity.