Key Success Indicators in Project Management: What C-Suite Leaders Should Be Monitoring Across Every Initiative
Last updated on : May 18, 2026
Most project portfolios contain more data than any executive team can act on. Research shows that 70% of projects globally fail to deliver on their original objectives because of inadequate planning and poor executive visibility. Only 42% of organisations report strong alignment between their active projects and strategic goals.
This means, project volume does not guarantee decision-relevant insight.
The solution? Introduce Key Success Indicators in project management.
See how LTS Data Point tracks key success indicators in project management across your portfolio
What are Key Success Indicators in project management and how do they differ from standard KPIs?
Keeping track of project activity and project success are entirely different processes.
Research shows that high performing organisations use 44% more performance metrics to measure the project success than average organisations. They evaluate strategic alignment, quality outcomes, and customer satisfaction along with execution metrics.
Consider a manufacturing plant that completed a new line of installation on schedule. Every KPI showed green. But none had tracked the KSIs such as quality delivery and operational readiness. Three days into operation, unresolved calibration issues stopped production. The project met its performance metrics but failed its success indicators at the same time.
Research shows that only 54% of projects worldwide are completed on time. Despite that, on-time delivery remains one of the most commonly tracked KSI as it reflects deeper insights such as planning quality, team execution, and stakeholder trust simultaneously.
Key Success Indicators are qualitative metrics, and they show whether strategic success has been achieved or not. Unlike Key Performance Indicators which are quantitative metrics which measure progress, KSIs assess outcome. Measuring KSIs enable risk detection early on, by tracking indicators such as issue resolution rates and resource shortages. This allows leaders to spot threats and act before they escalate.
Why most C-suite leaders are tracking the wrong project signals

Just because a project status shows green flags doesn’t mean it’s healthy.
A manufacturing management team gathered for their quarterly portfolio review. Twelve projects were aligned to its agenda. Nine showed green status. The three flagged amber had vocal sponsors who reframed each risk as a resourcing issue and walked away with additional budget. Six months later, two of the nine green projects missed their strategic targets entirely. No one tracked whether those projects were delivering value, they focused on whether they were on schedule.
Lack of visibility is the main issue in project management. Leaders often find it difficult to make accurate financial predictions, assess project value, or track project baselines in real time.
When the visibility gaps exist, the project portfolios fail to answer even the three basic questions in single view:
- What is being funded?
- What is the realistic delivery capacity?
- What value is actually landing?
In the absence of visibility, governance becomes political and executives back the loudest sponsor rather than the best outcome.
Gartner research concludes that most PMOs fail to provide the data senior managers actually need. This creates a gap between executive expectation and portfolio reality that more data does not mean better decisions.
The core key success indicators every executive portfolio needs
Not all project management indicators are equal. Their relevance varies according to the requirements. The ones that most executives overlook are the ones that examine whether the work actually delivered what it was funded to create.
On-time delivery
Tracks whether the project was completed within the agreed schedule.
- Why it matters: Meeting a deadline signal that the team planned realistically, executed without major disruption, and maintained stakeholder trust throughout.
- How to measure: Schedule Performance Index (SPI) = Earned Value (EV) / Planned Value (PV) [SPI > 1.0 = ahead of schedule. SPI < 1.0 = behind]
Budget control
Monitors whether the project was delivered within its approved financial boundaries.
- Why it matters: Overspending erodes stakeholder confidence and signals poor planning or scope management. Staying within budget demonstrates efficient resource use.
- How to measure: Cost Variance (CV) = Earned Value (EV) - Actual Cost (AC) [+ve CV = under budget. -ve CV = overspent]
Scope tracking
Tracks whether the project delivered exactly what was agreed: no more, no less.
- Why it matters: Unmanaged scope creep is one of the leading causes of budget overruns and missed deadlines. Clear scope boundaries protect both delivery and stakeholder expectations.
- How to measure: Scope Creep % = (Number of unapproved changes / Total approved scope items) x 100
Quality delivery
Observes whether the project output met the defined quality standards.
- Why it matters: A project can finish on time and within budget while still failing to deliver something the business can use. Quality KSIs surface that gap before it reaches operations.
- How to measure: Defect Rate = (Number of defects identified / Total deliverables reviewed) x 100
Stakeholder satisfaction
Monitors how engaged and satisfied key stakeholders are with the project and its outcomes.
- Why it matters: Low stakeholder satisfaction is an early signal of misalignment between what was promised and what is being delivered, often visible before the project closes.
- How to measure: Stakeholder Satisfaction Score = Average rating from structured stakeholder surveys at defined project milestones
Risk mitigation
Tracks how effectively the project team is identifying and resolving risks before they escalate.
- Why it matters: Unresolved risks are the most common hidden cause of project failure. Tracking mitigation rate gives executives early visibility into portfolio vulnerability.
- How to measure: Risk Mitigation Rate = (Number of risks resolved / Total risks identified) x 100
Benefits realisation rate
Observes whether the project delivered the strategic value it was funded to create.
- Why it matters: This is the KSI most consistently overlooked at portfolio level and the most direct measure of whether an investment was worth making. A project can clear every other KSI and still fail this one.
- How to measure: Benefits Realisation Rate = (Actual benefits delivered / Projected benefits at approval) x 100
Strategic goal alignment rate
Tracks the percentage of active projects directly linked to the organisation’s strategic objectives.
- Why it matters: Projects consuming resource without a clear strategic mandate dilute portfolio focus and reduce overall business impact.
- How to measure: Strategic Alignment Rate = (Number of projects tied to strategic goals / Total active projects) x 100
Portfolio balance score
Observes whether the project portfolio is appropriately distributed across short-term delivery and long-term strategic investment.
- Why it matters: An unbalanced portfolio, especially weighted toward operational fixes or too speculative, signals a misalignment between leadership priorities and business strategy.
- How to measure: Assessed via portfolio mapping across a two-axis matrix: strategic value vs delivery complexity
Executive visibility score
Monitors how consistently C-suite leaders have access to accurate, current portfolio-level performance data.
- Why it matters: Decisions made on stale or incomplete data carry compounding risk across a portfolio. Visibility quality directly affects governance quality.
- How to measure: Scored via periodic audit of dashboard currency, reporting frequency, and data accuracy across portfolio tools. [Rated on a 1-5 scale]
Change alignment rate
Observes whether approved project scope changes are re-evaluated for strategic fit before implementation.
- Why it matters: Scope changes that are approved on delivery grounds alone, without strategic check, are a leading cause of portfolio drift.
- How to measure: Change alignment rate = (Number of scope changes re-assessed for strategic fit / Total approved scope changes) x 100
Dependency health index
Tracks the status of cross-project dependencies and whether they are being actively managed.
- Why it matters: In a portfolio, one delayed project can silently undermine three others. Unmanaged dependencies are among the hardest risks for executives to see from the top.
- How to measure: Dependency health score = (Number of dependencies on track / Total active dependencies) x 100
How to use project health metrics to catch drift before it becomes failure
Project failure does not arrive without warning. It appears after warnings no one acted on.
A project sponsor received a verbal “on track” update on Monday. But by Thursday, two critical path tasks had already slipped within a week’s time. This subjective status update buried serious project problems within the green signal, and hence, did not appear in any formal report.
Project drift can be observed way before it appears in any formal report. It could pop up as irregular spending trends, task completion rates and even milestone slippage which could accumulate into two to three review cycles quietly. This ends up compounding before a project manager can formally act on it.
This could be solved by using governance frameworks with predefined performance thresholds that would escalate any critical path task slipping beyond its float within 24 hours. It ensures that the drift triggers an executive response – supported by structured management reporting – at the point it is detectable, not after it has compound into a missed milestone.
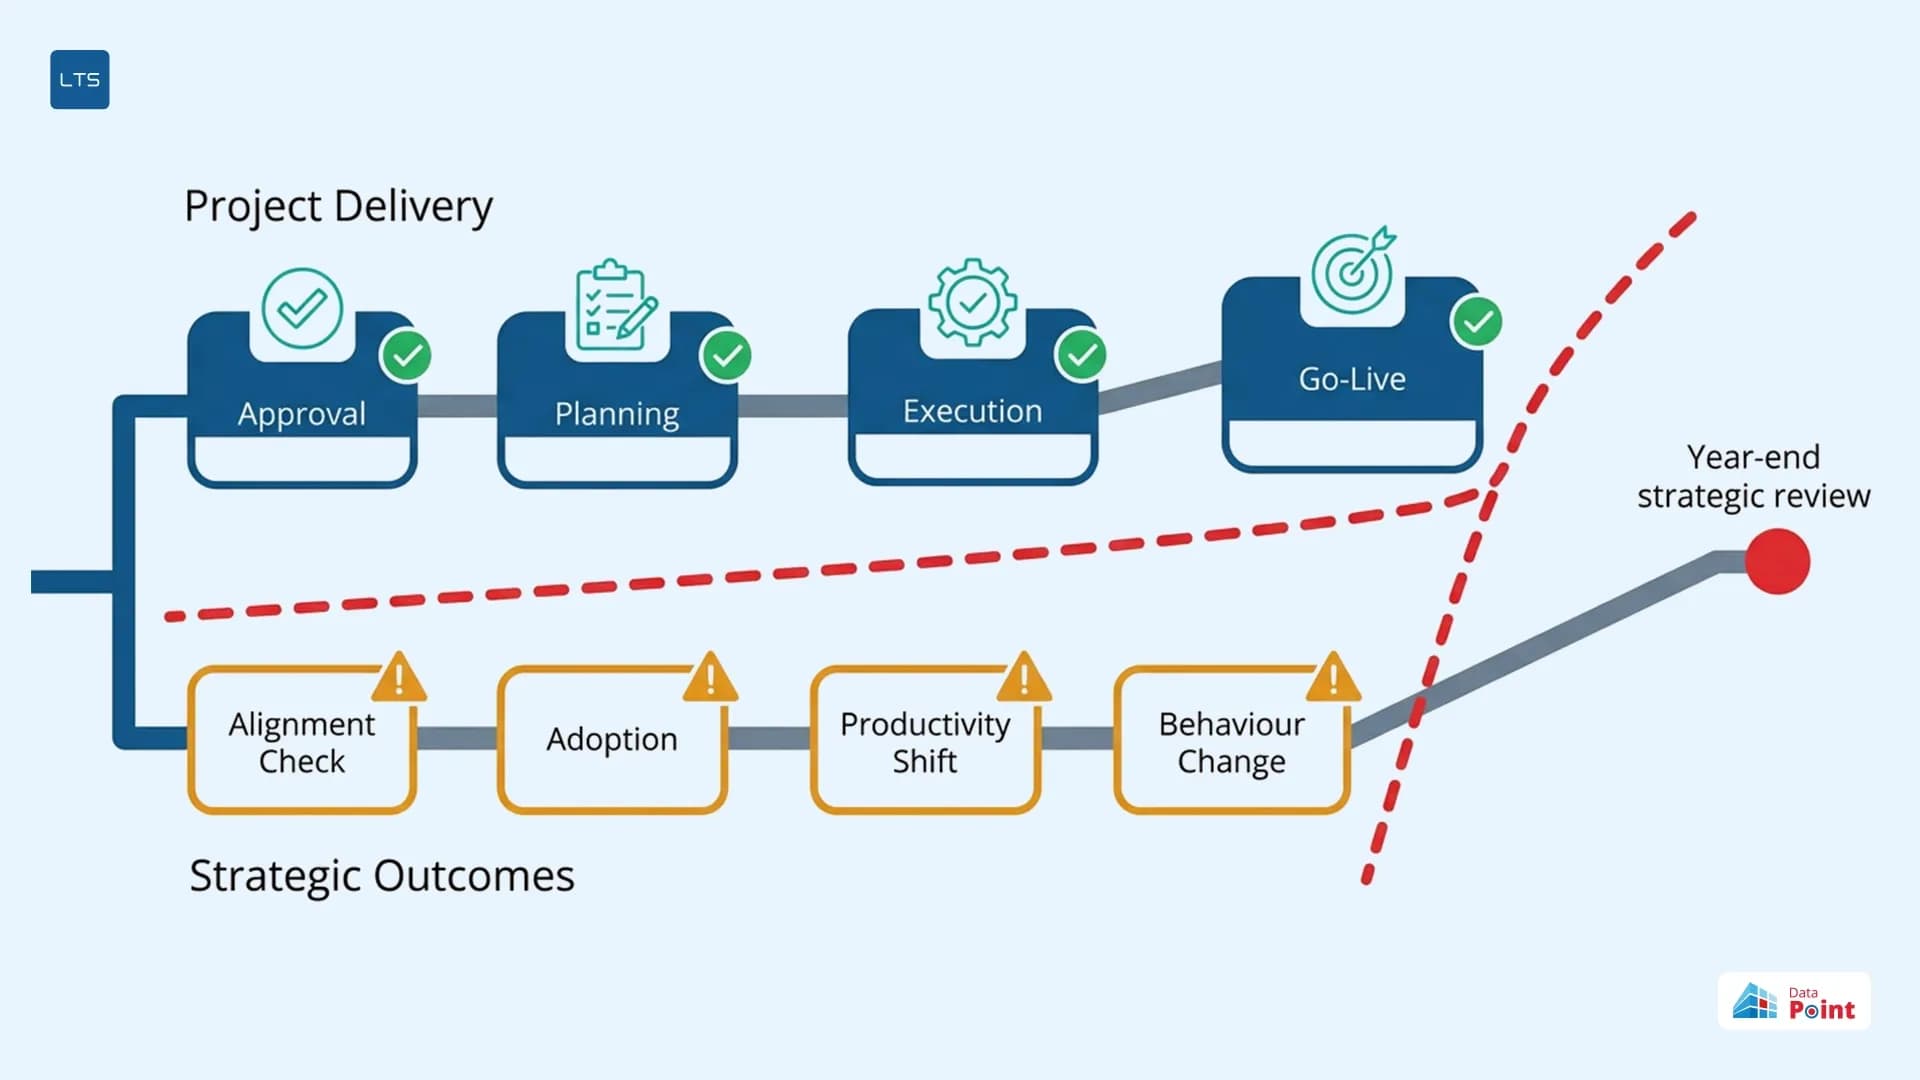
Even in the absence of desired strategic outcomes, organisations routinely declare delivery a success. Systems are implemented with low adoption, transformation programmes launch without productivity shifts, and digital platforms go live without changing customer behaviour.
Consider a business unit that was able to complete four major projects in a financial year, all on time, all within budget. But at the year-end strategic review, it still missed its strategic targets because no one had formally assessed whether the projects are strategically aligned during approval.
Why this project failure happens is that most companies see strategic alignment as a one-time event. But in reality, it is not.
Strategic alignment is not a checklist ticked off at the beginning of a project and then forgotten. Even during the progress of the project, it must continue to align and demonstrate value and relevance at all its stages.
How LTS Data Point helps you track key success indicators in project management
Tracking key success indicators is only half the equation. The other half is what happens when one moves off track.
Most executive teams receive KSI data through consolidated reports that arrive too late to act on. LTS Data Point structures visibility by organisational tier (operators, managers, and C-suite). They see only the indicators relevant to their level. Leaders get the strategic signal without the operational noise.
The KPI Bowler gives executives a live read of every KSI across the portfolio — Goal, Actual, Variance, and Variance % — with RAG colour coding and trend arrows updated across weekly, monthly, and year-to-date views. When an indicator begins drifting, it is visible before it becomes a missed milestone.
When a KSI turns red, LTS Data Point does not wait for the next reporting cycle. An action plan is raised within the same view: owner assigned, due date set, status tracked.
Fishbone analysis and Quad Charts are linked directly to underperforming KSIs. When an executive sees a red indicator, the root cause investigation is one click away, keeping the response window tight and the governance loop closed.
Key success indicators in project management give C-suite leaders something delivery metrics alone cannot — early, outcome-focused signals that separate portfolios quietly drifting from ones actively delivering strategic value. The executives who act on those signals early spend less time managing failure and more time compounding success.
Not sure which project health metrics matter most for your organisation?
FAQs
1. How many KSIs should a project have?
Most projects track between five and eight KSIs. Too few and you miss early signals; too many and no single indicator gets the attention it deserves.
2. Who is responsible for setting KSIs on a project?
The project sponsor sets them at approval, in alignment with the C-suite. Project managers monitor them — but ownership sits at the strategic level, not the delivery level.
3. How often should KSIs be reviewed?
Leading KSIs such as resource utilisation and stakeholder satisfaction should be reviewed weekly. Lagging KSIs such as benefits realisation are reviewed at defined post-completion intervals — typically three and six months after handover.
4. Can KSIs change during a project?
Yes — but only through a formal change process. Informal KSI drift is itself a governance risk. Any change to a KSI mid-project should trigger a re-assessment of strategic alignment.
5. What is the difference between a KSI and a milestone?
A milestone marks when something was completed. A KSI measures whether what was completed actually delivered the intended outcome. Projects can hit every milestone and still fail their KSIs.