5 Whys of Lean: How Plant Managers Can Use It to Find Real Root Causes, Not Just Quick Fixes

Last updated on : May 14, 2026
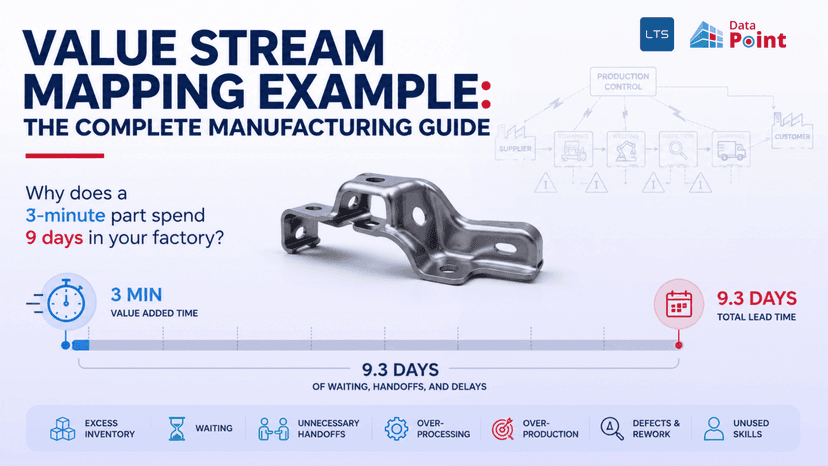
The 5 Whys of Lean is one of the most recognised tools in manufacturing, and at the same time, one of the most consistently misapplied.
Consider a plant manager at a high-volume assembly site who notices the same conveyor fault recurring every six weeks. Each time the fault appears, the team replaces that part and records it as resolved issue. The issue kept repeating.
The problem here was not that they didn’t respond. The problem was that they didn’t ask why.
For a plant manager, the 5 Whys of Lean is not simply a form to fill in after something goes haywire. It is a structured method for finding the reason why it happened in the first place.
See how LTS Data Point connects root cause analysis to verified corrective action
What the 5 Whys of Lean actually is, and what it was designed to do
The 5 Whys root cause analysis technique was introduced in 1930s by Sakichi Toyoda, founder of Toyota Industries. It ended up becoming the cornerstone of the Toyota Production System. It aimed to explore the cause-effect relationship by repeatedly asking “Why?” until a fixable process failure is reached.
Later, a machine shop manager from Toyota Industries, Taiichi Ohno began observing his team stopping at the initial breakdown, fixing it, and then moving on. This resulted in problems occurring again and again.
To solve this issue, he trained himself and his team to follow the causal chain all the way to the root cause. The number of whys didn’t matter, but reaching the root cause did.
Do I have to have the evidence to answer each Why?
Yes. The most reliable 5 Whys analysis demands every answer in the chain to be based on what the team can check. If a “why” cannot be answered with observable evidence, that gap itself becomes meaningful. This gap tells you exactly where your process documentation or visibility is missing.
Rather than treating 5 Whys of Lean as a reporting tool, treating it as a technique to analyse root cause and nipping it in the bud, saves you productive time.
Why most teams stop too early and fix the wrong thing

- The first answer feels sufficient: Most of the time the first answer seems like the finish line. This is because it looks convincing enough that the team acts on it. The method fails because the first answer is treated as the end point instead of the starting point. The method is not broken. The investigation is.
- Blame culture shortens the chain: When team leaders create a culture where they question the person in charge instead of why they did that, the team feels unsafe to question the process or management decisions. This results in the investigation stopping at the nearest person. This is not because the team lacks method. It is because going deeper feels like escalating blame upward. Depth requires safety.
- No standard defines what complete looks like: Lack of reference to what a finished 5 Whys problem-solving technique looks like, stops the team from going deeper. The team won’t know if they have gone deep enough or not.
- Analysis done away from the work: Conducting analysis later, in a separate meeting room without people responsible for the issue prevents direct observation that each answer in the chain depends on. This turns the causal chain into a series of assumptions rather than verified facts.
How to run a 5 Whys analysis correctly
Define the problem precisely
How clearly you define the problem decides how efficiently you reach your root cause. Instead of vaguely reporting, “Everything lags,” mention the time the problem happened, what the problem led to, and how often it repeated.
Assemble the right people at the right place
The next step is to bring together the people who were present when the problem occurred. This gives access to different perspectives on why something went wrong and why this particular decision was made about it.
Ask why repeatedly and validate every answer
Never stop at the first why. Knowing how to do a 5 Whys analysis correctly means validating every answer, not just collecting them. Repeatedly ask why this went wrong, or why that went wrong. Validate every answer you get with proper evidence.
Stop when you reach a cause you can control
If you’ve reached a problem that you can control, then that is most likely your root cause. Fix that and analyse if the problem still repeats.
Document the full chain
Once the problem is solved, record the whole chain of process. This will benefit in the future as a reference to the completed 5 Why technique which enables the subsequent teams to pick up and analyse.
When to use a Fishbone Diagram alongside 5 Whys

Consider a plant manager who investigated a new filling line that showed repeated stoppages. He used 5 Whys technique to find the root cause and the tool pointed towards “blocked filter” as the cause. The filter was cleaned thoroughly, and the problem was logged as resolved. Three weeks later, the stoppages return. Nobody asked why the filter was getting blocked, and thus, the maintenance schedule for the new equipment was never set.
The problem here, was not that the technique was faulty. The technique followed the same method it was meant to, but it hit its own limit. When multiple factors arise for a single issue, 5 Whys technique becomes no longer a viable tool.
This where a Fishbone Diagram can help greatly. Fishbone Diagram gives the branching that the 5 Whys technique lacked. A Fishbone Diagram displays potential causes across six main categories which include man, machine, method, material, measurement, and environment. This provides the team members with all the contributing factors before focusing one causal chain. Furthermore, using a digital Fishbone Diagram enables the team to update, share, and revisit the diagram in real time as new evidence emerges during the investigation.
These limitations don’t indicate elimination of 5 Whys technique. These limitations provide insight on how 5 Whys alone cannot solve the problem. Combining 5 Whys with Fishbone Diagram will help solve the issue. Fishbone provides the breadth, while 5 Whys gives the depth.
How to turn a completed 5 Whys into a corrective action that sticks
5 Whys technique is conducted effectively with the help of a Fishbone Diagram.
The root cause analysis is done.
What next?
Fix the root cause.
The only way to prevent recurrence of the problem is to fix the verified root cause. But most teams note down corrective actions against what they saw not what they found at the end of the causal chain.
A corrective action is valid only if it meets three conditions:
- The cause is within the organisation’s control
- A specific action can be defined to address it
- Measurable outcome exists to verify it worked
If these three conditions haven’t met, you haven’t done the corrective action. You simply reached a conclusion.
Ticked all the three conditions off. Did the corrective action. But how do I know if this corrective action actually worked?
After the corrective action has been completed and the owner is assigned, continuous monitoring for at least six months is necessary. Tracking measurable metrics such as defect rate, a downtime frequency etc., would help to see if the root cause analysis is done properly. After analysing, if there’s no issue, then it can be closed officially.
How LTS Data Point connects 5 Whys analysis to corrective action tracking
Running a 5 Whys analysis is one thing. Having a platform that brings together the lean root cause analysis tools to connects the trigger, the investigation, and the corrective action in one place is another.
This is where LTS Data Point tools comes in:
- Huddle boards: These keep track of critical business metrics across Safety, Quality, Delivery etc. in real time. It uses RAG colour coding and trend arrows giving the plant manager an immediate visual signal when performance deviates. Each KPI card also includes a direct Action Plan section.
- Bowler charts: It displays goal, actual, variance, and variance percentage across Weekly, Monthly, and Year-to-Date views, also providing drill down into team-level or even individual KPIs. A problem appearing once can be treated as an anomaly while a repeating problem in three weeks is a signal.
- One Minute Manager: It provides a timestamped log of key issues, current highlights, and future opportunities linked directly to KPI performance. It also includes a built-in rating system flagging whether a KPI target has been achieved or requires improvement. It captures the issue and alerts the responsible parties immediately.
- Quad chart: It combines KPI trend analysis, a daily scorecard, failure reason logs with day-wise breakdowns, and a Pareto chart identifying the most frequent root causes by count and percentage, all in a single view. It enables you to track trends, add comments, and maintain timelines of actions linked directly to the KPI being investigated.
- Fishbone Diagram: It can be launched directly from the KPI dashboard in the context of specific KPI deviation organising causes across Manpower, Machine, Method, Material, Measurement, and Environment. It supports multi-level cause breakdown, multiple layout options including Fishbone, Branching, and Layered views. It also integrates with Action Plans.
- Action Plans: Action Plan module requires you to enter root cause and corrective action before an action can be marked complete, making documentation non-negotiable by default. Each action carries a named owner, due date, priority level, and status across four stages: Open, Ongoing, Closed, and Overdue. An escalation flag surfaces overdue or critical items to leadership automatically. Actions are further linked directly to the KPI they address, creating a traceable chain from deviation to verified resolution.
The 5 Whys of Lean is a method that will enable you to find root cause. It will not solve the problem on its own, but it will lead you right towards the issue. The complication lies in how correctly you can apply it. The 5 Whys technique followed by a verified corrective action becomes one of the most reliable tools for continuous improvement a plant manager can have.
Not sure where your 5 Whys process is breaking down?
FAQs
1. What is the difference between a symptom and a root cause in manufacturing?
A symptom is the visible effect of a problem – a machine stopping, a defect appearing, a target being missed. A root cause is the underlying condition that made the problem possible. Fixing a symptom stops the immediate impact. Fixing the root cause stops it from returning.
2. Can the 5 Whys be used for safety incidents, not just quality or equipment failures?
Yes. It is particularly valuable for safety investigations because it moves the focus away from individual blame toward the process or system conditions that allowed the incident to occur. Most safety failures have a fixable systemic cause behind them.
3. What should a corrective action include to be considered complete?
A verified root cause, a specific action tied to that cause, a named owner, a due date, and a measurable outcome used to confirm the problem has not recurred. Without all five, the corrective action is incomplete by definition.
4. Can 5 Whys can be used alongside Six Sigma methodologies?
Yes. The 5 Whys fits naturally within the Analyse phase of a DMAIC project, helping teams move from identifying a problem to understanding its cause before defining a solution. It is a complementary tool, not a competing one.
5. What is the difference between 5 Whys and an 8D analysis?
The 5 Whys is a focused, lightweight root cause too suited to a single-cause problems identified quickly at the point of work. An 8D analysis is a structured eight-step process designed for complex, multi-cause failures – typically used when a customer complaint or serious quality escape requires a formal documented response.

Abel Jiménez, Lean Consultant
Abel is a Lean Consultant with over 30 years of expertise in operational analysis, process improvement, and organisational change across Mexican industries. Currently serving as Director of Insurance Promotions at CESCEMEX, he helps organisations leverage technology and lean practices to improve efficiency and manage change with continuity.