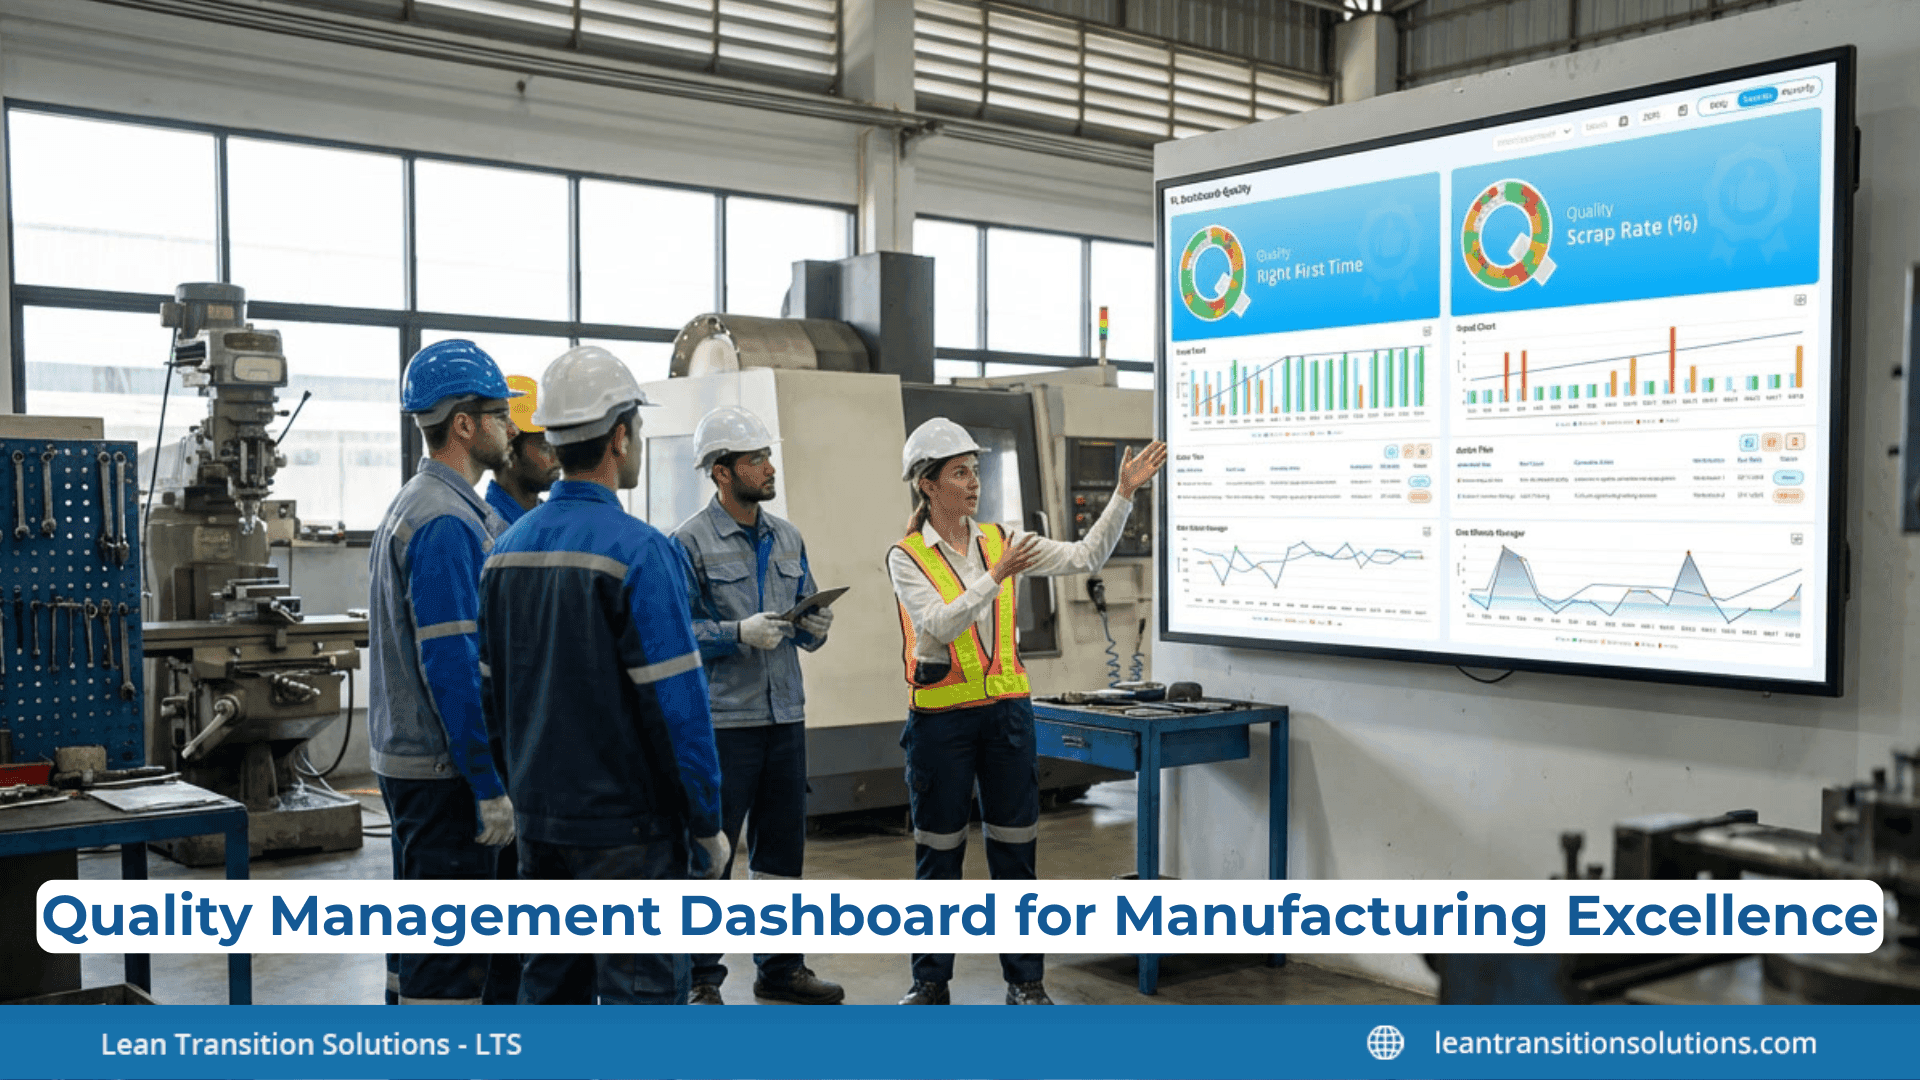
From KPIs to Action: Quality Management Dashboard for Manufacturing Leaders
Last updated on : March 10, 2026
If you’re leading a manufacturing team, you know the pressure never stops – tight deadlines, rising costs, and the constant demand for flawless quality. One small defect can throw off production and damage customer trust.
Traditional quality checks often leave teams reacting to problems instead of preventing them. A quality management dashboard helps change that by bringing quality metrics, defects, process data, and KPIs into a single real-time view so teams can monitor performance, identify issues early, and make faster decisions on the shop floor.
Instead of scattered spreadsheets and delayed reports, leaders gain a clear picture of what is happening across operations. In this blog, we’ll explore what a quality management dashboard means for the manufacturing industry, why SQDCP dashboards are widely used to track quality KPIs, the key benefits and features of quality dashboards, how to align KPIs with strategic goals, how dashboards support Lean and Industry 4.0, best practices for implementation (including common mistakes to avoid), and emerging trends with LTS Data Point.
Check out LTS Data Point quality management dashboard
Why does a quality management dashboard matter in manufacturing industry?
A quality management dashboard is a live visual tool that combines key quality metrics such as defect rates, first pass yield, and compliance performance into a single screen.
It assists manufacturers track production quality, identify problems early, and make informed decisions to enhance efficiency, consistency, and regulatory compliance.
But why do manufacturing leaders need a quality management dashboard, especially in the context of quality management?
Let's see why.
- Quality management dashboards enable manufacturing leaders to track defect rates, rework rates, first-pass yield, and deviations in real-time. This makes quality issues visible just as they emerge and thus, escalation can be avoided.
- They enable to manage quality as an integral part of operations by connecting quality performance to operational metrics (machine uptime, throughput, maintenance) and business outcomes (scrap cost, customer returns).
- Quality dashboards speed up root cause analysis by providing old trends, machine-specific defect data, supplier performance etc.
- By providing feedback loops, they support continuous improvement by speeding up improvement cycles.
SQDCP dashboard: The best way to track quality metrics
The SQDCP board stands for Safety, Quality, Cost, Delivery, and People. It is usually considered one of the best tools to track Quality as it offers a balanced, visual, and structured approach to daily performance management. By blending quality metrics within a broader operational context, it makes sure that quality is not tracked in isolation but as part of the entire manufacturing system.
The Quality section of the SQDCP dashboard typically monitors indicators like defect rate, right first-time percentage, rework, and customer complaints. These are assessed daily by frontline teams, by encouraging instant visibility and rapid response to any deviations. This daily pattern supports Lean principles by allowing quick problem-solving root cause analysis, and continuous improvement at the core.
But what makes SQDCP dashboard stand out from the crowd? Yes, you guessed it right. Its's simplicity and engagement.
SQDCP dashboard is visual, easy to interpret, and motivates team ownership of quality outcomes. Unlike purely digital dashboards, the SQDCP dashboard facilitates live discussions during daily huddles, reinforcing communication between operators, supervisors, and management.
By linking Quality performance to Safety, Cost, Delivery, and People, the SQDCP dashboard assures balanced decision-making – preventing teams from enhancing one area at the expense of another. In short, it’s the best way to monitor quality because it makes performance visible, productive, and aligned with both Lean culture and continuous improvement goals across all levels of manufacturing.
Other common quality management dashboards that track quality KPIs like SQDCP
- SQDC dashboard: Tracks Safety, Quality, Delivery, and Cost to ensure balanced operational performance.
- SQDCL dashboard: Adds Leadership to emphasize management engagement and continuous improvement in quality.
- SQDCM dashboard: Includes Morale, linking workforce motivation to sustained quality and productivity.
- SQDCPS dashboard: Expands with Productivity and Sustainability, integrating quality goals with efficiency and environmental performance.
Which quality KPIs can be tracked with SQDCP dashboards?
These quality management dashboards can be customised according to the needs of your industry, thus enabling you to improve your business and ensure growth. Even though you can tailor these quality management dashboards to your needs, SQDCP dashboard still ends up being the popular one as it helps track several quality KPIs that are relevant.
Let's explore those quality KPIs which can be monitored using SQDCP dashboard.
- Defect rate: Percentage of defective units produced versus total units.
- First pass yield (FPY): Percentage of products that meet quality standards without rework.
- Right first time (RFT): Measures how often production is completed correctly the first time.
- Customer complaint rate: Number of complaints or returns related to product quality.
- Scrap rate: Quantity or cost of materials scrapped due to defects.
- Audit nonconformance rate: Tracks internal and external quality audit results.
- Corrective and preventive actions (CAPA) closure rate: Measures the timeliness of resolving quality issues.
For more details on quality KPIs, visit our two latest blogs:
- Strategic KPIs for Quality Managers: Boosting Performance in Manufacturing
- Mastering KPIs for Operations Managers: What to Track and What to Skip
Key benefits of using quality management dashboard for manufacturing industry
- Improved decision-making: Managers and supervisors can see performance metrics in live by using quality management dashboards, allowing quicker data-driven decision-making rather than having to depend on intuitions or delayed reports. One article suggests that custom dashboards can reduce the time leaders spend on data interpretation by up to 70%.
- Enhanced efficiency and productivity: Problems like rising scrap, machine drift or quality deviations can be addressed quickly as the quality management dashboard tracks quality KPIs in real time. One source noted that industries using dashboard-driven analytics detected productivity improvements by approximately 15%.
- Improved compliance, transparency and accountability: Offer transparent views of metrics, allowing teams and shifts to see when performance deviates from expectations, creating accountability and encouraging a culture of continuous improvement.
- Proactive management: Traditional manufacturing often responds to quality issues after they’re spotted (e.g., final inspection or via customer complaints). Quality management dashboards, on the other hand, detects issues before it happens by surfacing trends, early deviations and triggering alerts.
Key features of an effective quality management dashboard
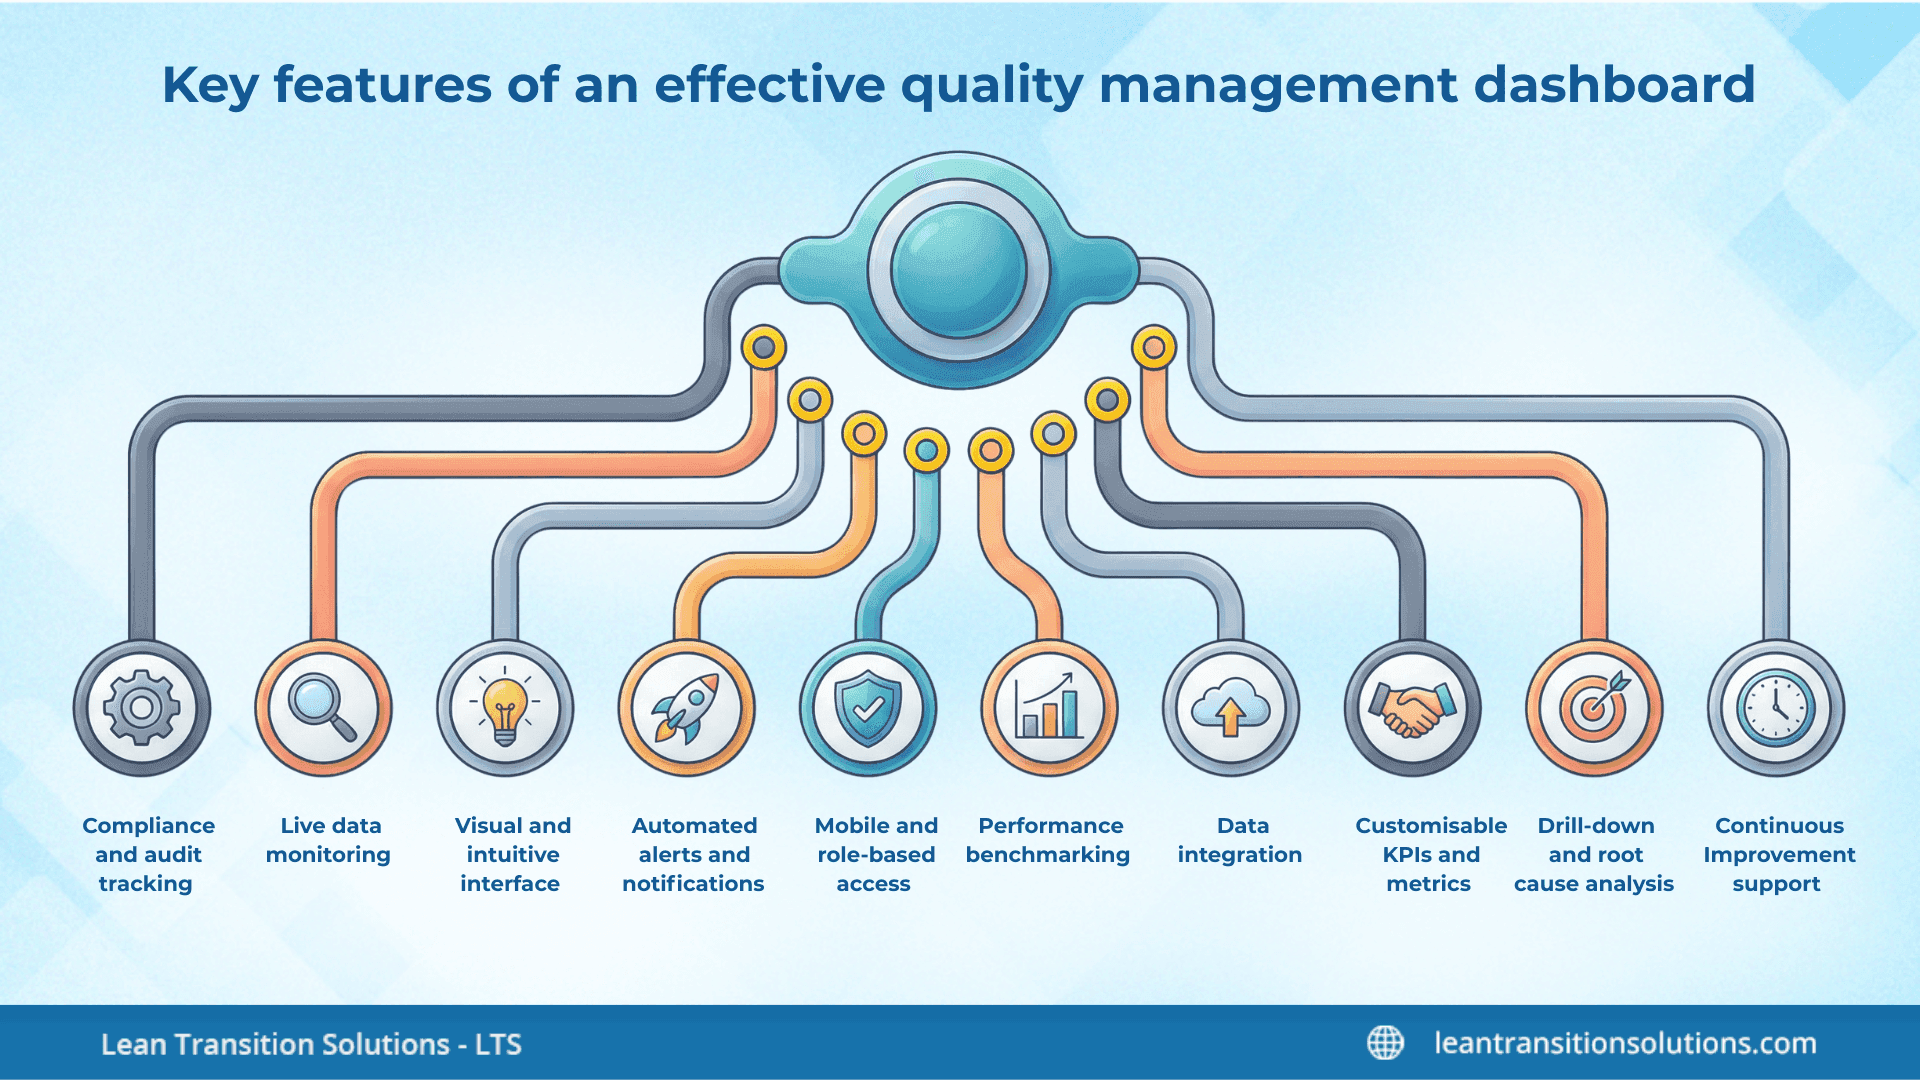
- Real-time data monitoring: Shows real-time updates on production quality metrics, allowing instant detection of defects, deviations, or operational issues.
- Customisable KPIs and metrics: Enables users to track key indicators such as defect rate, first pass yield, and supplier quality, altered to specific manufacturing goals.
- Data integration: Links flawlessly with MES, ERP, and QMS systems to provide a unified, precise view of quality performance across the production line.
- Drill-down and root cause analysis: Lets users to explore data by product, line, or operator to quickly spot underlying causes of quality issues.
- Visual and intuitive interface: Utilises colour coding and trend lines for easy analysis, making sure both operators and managers can act on insights quickly.
- Automated alerts and notifications: Sends live alerts when KPIs exceed defined thresholds, assisting teams react proactively to deviations.
- Compliance and audit tracking: Maintains records of quality checks, deviations, and corrective actions to support regulatory audits and traceability.
- Performance benchmarking: Compares current performance against old trends or industry standards to drive continuous improvement.
- Mobile and role-based access: Offers accessibility across devices and customised dashboards for various roles – operators, executives, and supervisors.
- Continuous improvement support: Blends with corrective and preventive action (CAPA) systems to track improvements and calculate their impact over time.
Why should you align KPIs with strategic goals?
Making sure your KPIs line up with your big-picture goals isn’t just a tick-box exercise – it’s what keeps quality and production moving in the right direction. A quality management dashboard makes this easier by linking day-to-day metrics to what really matters for the business. For example, keeping an eye on defect rates helps cut waste and boost product reliability, which means happier customers and lower costs. Tracking Overall Equipment Effectiveness (OEE) shows how downtime affects efficiency and profitability, while first-pass yield tells you how well your processes are running without wasting resources or missing delivery targets. When you can see all this in one dashboard, it’s clear how shopfloor performance impacts the bigger picture. That visibility builds accountability, encourages fact-based decisions, and supports a culture of continuous improvement – so teams can spot gaps, fix problems fast, and measure the results.
But how can you choose the right quality management dashboard to track quality KPIs? Let's explore some quality dashboards that monitor quality KPIs according to you needs.
Leveraging quality management dashboards for Lean and Industry 4.0
Quality management dashboards are powerful supporters of both Lean manufacturing and Industry 4.0 transformation. In the context of Lean manufacturing, quality dashboards offer live visibility into waste, bottlenecks, and deviations, helping teams act instantly to sustain flow and standardise best practices. They incorporate lean principles like continuous improvement and visual management by making performance data transparent and productive on the shopfloor.
Within the Industry 4.0 ecosystem, quality management dashboards integrate with IoT sensors, machine learning models, and automated systems to build a connected, intelligent manufacturing environment. For example, predictive analytics can forecast equipment failures or quality issues before they happen, while IoT integration feeds real-time data from machines and inspection devices into quality dashboards for immediate analysis.
Real-world example: An automotive parts manufacturer who improved business by using Lean principles and Industry 4.0 technology
At a leading automotive manufacturing plant, daily performance meetings once relied on manual SQDCP boards filled with handwritten notes and delayed updates. Quality issues often surfaced too late, and teams struggled to connect data across production lines. Determined to overcome these inefficiencies, the company partnered with Lean Data Point to digitise its entire SQDCP framework – transforming traditional boards into a real-time, interactive dashboard.
As the new system went live, operators and managers could suddenly see live data on Safety, Quality, Cost, Delivery, and People in one place. Quality deviations that once took days to detect were now flagged immediately, enabling instant action on the shopfloor. Bottlenecks and operational gaps became visible, and teams began solving problems collaboratively instead of working in silos. Over time, this digital transformation not only boosted quality consistency and productivity but also cultivated a culture of continuous improvement. What began as a simple modernisation effort evolved into a powerful example of operational excellence through end-to-end digitalisation – where data, people, and performance came together seamlessly.
Top practices for implementing quality management dashboards
Executing a quality management dashboard requires more than just technology; it demands the right strategy, details, and engagement across all levels of the organisation. Success relies on aligning people, operations, and systems to assure the quality dashboard drives meaningful improvement rather than becoming a reporting tool.
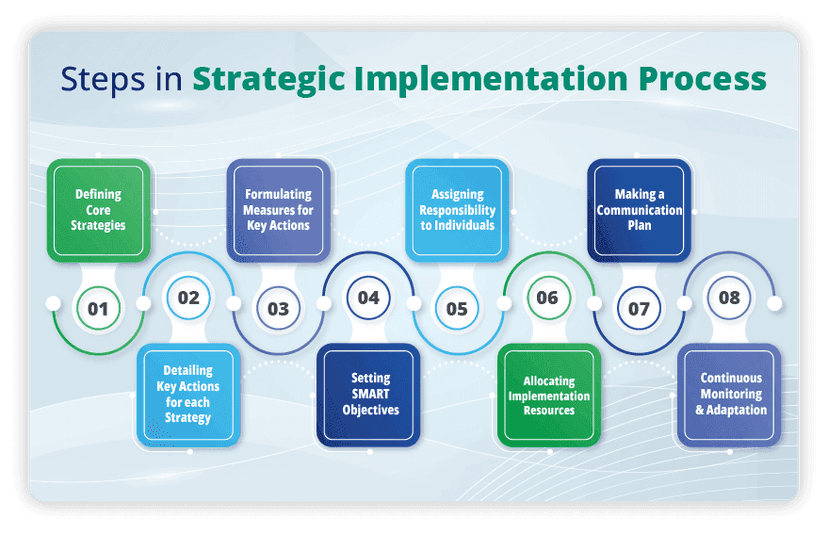
Steps: How to implement quality management dashboard successfully?
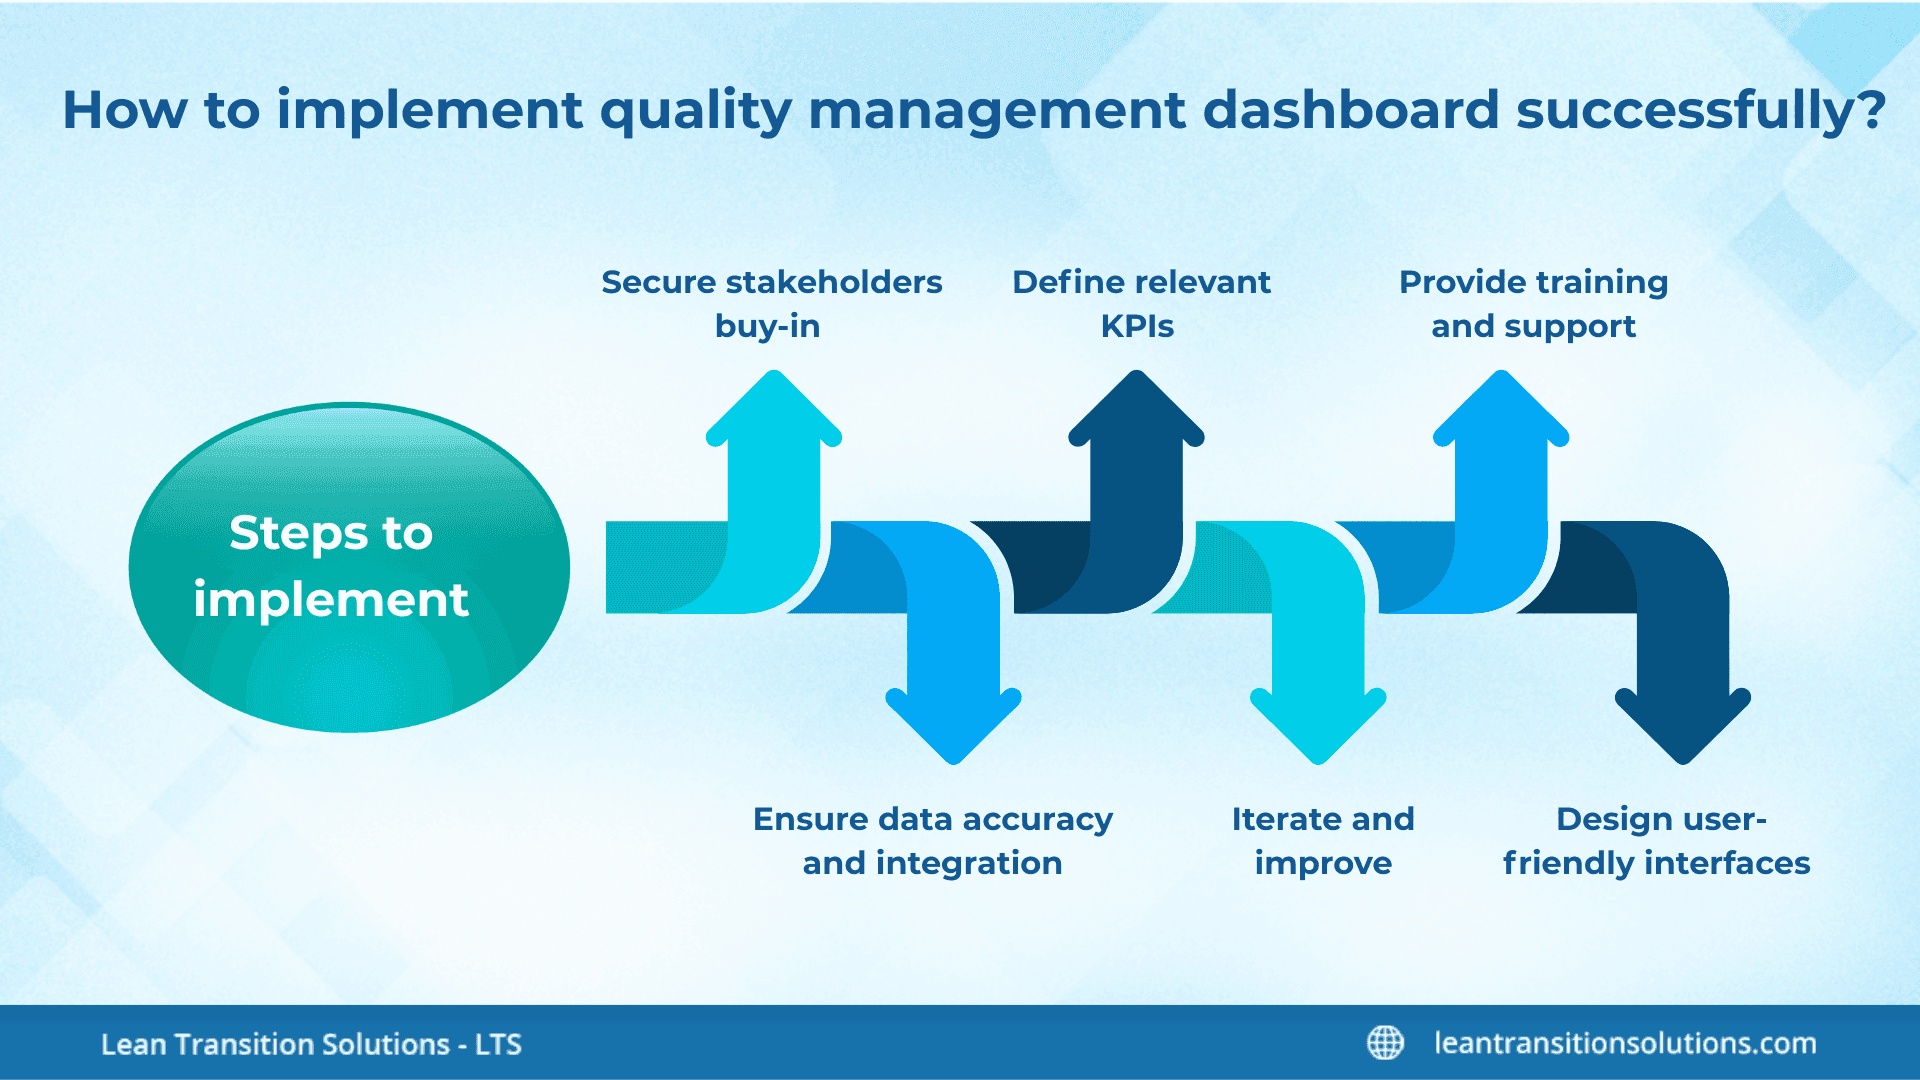
- Secure stakeholders buy-in: Involve leaders, quality teams, and production managers early to define shared goals and KPIs that indicates both operational and strategic goals.
- Ensure data accuracy and integration: Link the quality dashboard to valid data sources such as MES, ERP, and QMS systems. Clean and verify reports before rollout to avoid mistrust and poor decision-making.
- Define relevant KPIs: Aim on productive metrics such as defect rate, OEE, first pass yield, and customer complaints instead of monitoring too many indicators.
- Design user-friendly interfaces: Use intuitive visuals and role-based dashboards to make sure accessibility and clarity for operators, engineers, and executives.
- Provide training and support: Train users not only how to guide the quality management dashboard but also on interpreting insights and applying them to daily decision-making.
- Iterate and improve: Regularly review quality dashboard performance and user feedback to refine KPIs, layouts, and alerts as business needs evolving.
How to avoid mistakes while implementing quality management dashboard
- Too many KPIs: Monitoring too many KPIs can be overwhelming and can cause to lose focus. Define KPIs properly according to your company’s needs.
- Lack of quality data: Faulty or inconsistent reports undermine trust; establish data governance and validation processes.
- Absence of user adoption: If users don’t see it worthy, quality dashboards won’t be used; involve end-users in the design process and offer continuous support.
- No clear ownership: Assign responsibility for quality dashboard maintenance and updates to specific role or team to make sure sustainability.
- Neglecting change management: Treat quality management dashboard deployment as a cultural shift, not just a technical one; communicate benefits clearly and celebrate early wins.
Quality management dashboard implementation checklist
- Define clear goals and success criteria.
- Identify key stakeholders and secure executive sponsorship.
- Select relevant, actionable KPIs aligned with business objectives.
- Audit and clean existing data sources.
- Integrate systems (ERP, MES, QMS, IoT devices).
- Design a user-friendly, role-based interface.
- Establish alert thresholds and reporting measures.
- Conduct user training and feedback sessions.
- Pilot the dashboard before full rollout.
- Review performance regularly and refine continuously.
Future trends: What LTS Data Point quality management dashboard has to offer
As the manufacturing sector continues to evolve toward digital, linked, and clever operations, LTS Data Point takes the lead in guiding the next generation of quality management dashboards designed for agility, insight, and global scalability.
- AI-driven predictive quality analytics: LTS Data Point is pacing ahead by embedding AI-powered predictive analytics into its quality management dashboard. These tools make use of machine learning algorithms to spot patterns in quality data, predict potential deviations, and recommend corrective actions before problems occur. This proactive approach assists manufacturers reduce defects, minimise downtime, and nurture continuous improvement – aligning perfectly with Lean and Industry 4.0 goals.
- Cloud-based dashboards for global operations: Cloud-enabled design of LTS Data Point allows centralising of quality performance data from multiple sites, suppliers, and production lines into a unified global view. This lets enterprises to benchmark quality performance across facilities, make sure consistent compliance standards, and make data-driven decisions from anywhere. Cloud deployment also assures scalability, quicker execution, and seamless integration with MES, ERP, and QMS systems – backing digital transformation across the whole value chain.
- Mobile accessibility and remote monitoring: Identifying growing need for live visibility beyond shopfloor, LTS Data Point provides mobile-responsive quality management dashboards that encourage leaders and quality teams to track KPIs, receive signals, and analyse performance analytics remotely. This mobility assists 24/7 oversight, enabling instant response to deviations and better coordination across teams – critical for global manufacturing environments where operations span multiple time zones.
In short, the future of quality management dashboards with LTS Data Point lies in brilliance, connectivity, and accessibility. By integrating predictive AI insights, cloud-based scalability, and mobile flexibility, LTS Data Point continues to redefine how manufacturers achieve operational excellence, compliance, and continuous improvement in the digital area.
Step up your business to digital generation with LTS Data Point as you evolve
FAQs
1. What is a quality management dashboard?
A quality management dashboard is a digital tool that displays key quality metrics like defect rates, OEE, and first-pass yield in real time, helping manufacturers monitor and improve performance.
2. Why do manufacturing leaders need a quality management dashboard?
It provides instant visibility into KPIs, enabling proactive decisions, reducing waste, and improving compliance and customer satisfaction.
3. How does a dashboard help align KPIs with strategic goals?
By linking shop-floor metrics to business objectives such as profitability and delivery timelines, dashboards show how daily performance impacts overall success.
4. What KPIs should be tracked on a quality management dashboard?
Common KPIs include defect rate, first-pass yield, OEE, scrap cost, and customer complaints.
5. Can quality dashboards integrate with existing systems?
Yes, most dashboards integrate with MES, ERP, and QMS systems for a unified view of quality and production data.
6. How do quality dashboards support Lean and Industry 4.0?
They enable real-time visibility, predictive analytics, and IoT integration, helping manufacturers reduce waste and embrace digital transformation.
7. What are the benefits of using a quality management dashboard?
Improved decision-making, faster root cause analysis, better compliance, and enhanced efficiency across production lines.
8. What mistakes should be avoided when implementing quality management dashboard?
Avoid tracking too many KPIs, using poor-quality data, neglecting user training, and skipping stakeholder involvement.
9. Is quality management dashboard customisable for different roles?
Yes, quality management dashboards can be tailored for operators, supervisors, and executives with role-based access and relevant KPIs.
10. What’s next for quality management dashboard?
Future trends include AI-driven predictive analytics, cloud-based global dashboards, and mobile accessibility for remote monitoring.
11. What is an SQDCP dashboard and why is it popular?
SQDCP stands for Safety, Quality, Delivery, Cost, and People. It’s a visual tool that tracks quality alongside other key areas, promoting balanced decision-making and team engagement.
12. Which quality KPIs can be tracked using SQDCP dashboard?
Defect rate, first-pass yield, right-first-time percentage, customer complaints, scrap rate, audit nonconformance, and CAPA closure rate.

Amer Jumah, Senior Lean Consultant
Amer is co-founder of Agile Solutions and a certified Six Sigma Black Belt, Lean Black Belt, and PMP, with over nine years of experience implementing Lean, Six Sigma, and Agile principles across diverse industries. He specialises in process optimisation, waste elimination, and delivering cost savings through organisational change.