Why Delivery KPIs Keep Failing on the Shop Floor — and What Manufacturers Can Do to Fix Them

Last updated on : April 30, 2026
Your team reviews delivery KPIs every Monday morning – on-time delivery, schedule adherence, order completion – but by Friday, the same orders are late again.
And every Friday, this question pops up in your head:
What is going on? What did I do wrong? Where did my team fail?
But the reality is, this may not be your fault or your team’s fault. This may be the fault of the system that tracks these KPIs.
When the data arrives too late, means different things to different people, and lives in disconnected tools – no amount of effort on the floor closes the gap.
What is the solution?
Find the right system. Simple.
See how LTS Data Point connects your delivery KPIs to daily execution – giving every tier from shopfloor to leadership the visibility to act before an order is at risk
Your delivery KPI isn’t broken – your schedule is
You must have experienced this issue several times – your team tracks all the right delivery KPIs and still fails to achieve the results. This is quite common.
Most delivery failures are decided before the shift starts. The plan reaching your floor today may be built on data that is years out of date. Capacity parameters entered at ERP go-live are rarely revised, even as real-world throughput shifts by 40% or more.
The causes are structural, not operational:
- Setting up an unrealistic plan and trying to execute it within the due time will only result in late deliveries
- Schedules built on theoretical capacity create late orders before they reach the shopfloor
- Too many metrics in too many disconnected dashboard – and one person to oversee them – does not make work easy
- If the historical data is thin or outdated, changeover times modelled at 45 minutes in scheduling systems may run for two hours or more
- When every department reports a different number, nobody owns the delivery problem – and backorders keep climbing
Following a broken system of doing things will only guarantee broken results. No amount of running around the clock will fix the gap between planning and execution – and the manufacturers who close it treat manufacturing process improvement as a system problem, not a people problem.
Five reasons delivery KPIs fail before lunchtime
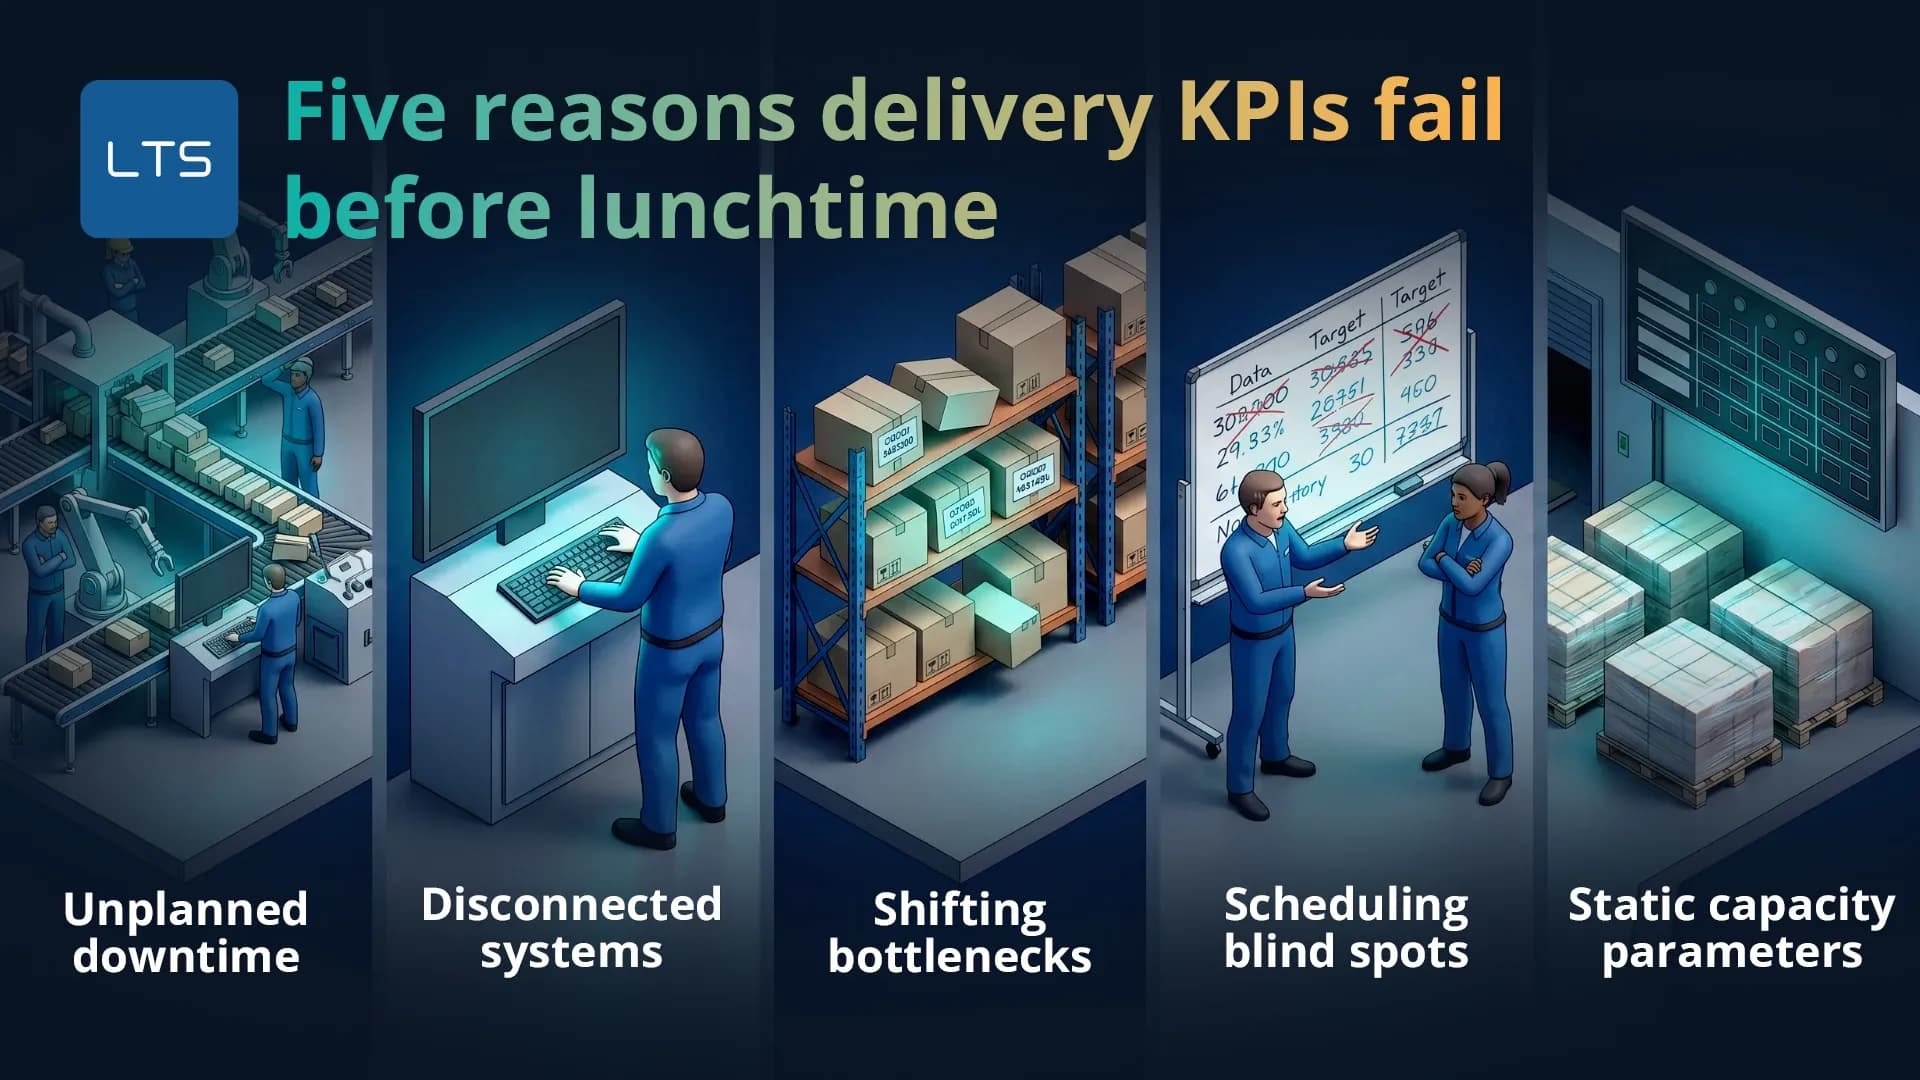
The schedule does not break at 4 pm – it breaks at 9 am, quietly, and for reasons that were knowable in advance. Five main reasons cause the breakdown of a manufacturing schedule:
- Unplanned downtime: Not considering machine failure as a possibility creates a huge delay falling like dominoes creating a chain of work-in-process. This happens because most scheduling system treats machines as always available, but real machines may not be.
- Disconnected systems: Lack of proper integration between ERP, MES, and QMS creates siloed data handling across the organisation. ERP handles orders and routings. MES tracks work. QMS captures inspection results. By the time each system is reconciled, the window to act has closed.
- High-mix scheduling blind spots: When you start running on several mixed numbers – many of which are also less frequent – your historical data becomes thin, inconsistent, or missing. When the historical data is thin, your team begins working on assumptions rather than actuals.
- Static capacity parameters: Most ERP systems often record capacity parameters such as downtime percentages, cycle times etc. These parameters might be rarely updated, and this creates issues because real-world scenarios are rarely static. For example, a machine that used to work a certain amount of time might take longer durations after years due to wear. This results in mismatches and unpredictability.
- Shifting bottlenecks: Constraints are never fixed – they vary according to changing routings, capacity parameters and several other factors. If there’s no real-time visibility into WIP levels, queue lengths, and work centre utilisation, your team won’t be able to detect where the constraint actually is.
Here’s what it looks like in practice:
A food and beverage manufacturer in Yorkshire operates an ERP system, a standalone QMS, and a manual production board. On a Tuesday morning, a batch quality hold is raised in the QMS at 8:47 am. The production scheduler, working from the ERP, has no visibility of the hold and releases the next three work orders as planned. By 11:30 am, two of those orders are queued behind a blocked line. The team discovers the clash at the 12 pm tier meeting. Two hours and forty-three minutes of recovery time – lost entirely because the systems did not speak to each other.
This is not an isolated failure. It is a structural one – and it is why shopfloor data isn’t delivering as it should be.
The measurement problem: How the same data reports 98% and 0%
A manufacturer receives an order for 400 units across four product variants – 100 of each. But on the due date, 380 units ship: all of variants A, B, and C, but only 80 of variant D. When measuring by units shipped, the on-time delivery is 95% – a result that would pass any internal review. But when measured by whether the customer received what they ordered, on time and full, it is 0%. The customer’s production line requires all four variants to run. The 20 missing units halt their assembly. The supplier reports a strong month, while the customer raises a formal complaint.
This shows that KPI definitions are not neutral. When thinking about KPI tracking, one would often think –
Oh, it’s just math with numbers and formula.
But the real issue lies in how you define a KPI.
The three variables that most commonly produce inconsistent OTD results are:
- Data baseline: Customer-requested date vs internally confirmed promise date
- Unit of measure: Line items shipped vs complete orders fulfilled
- Tolerance window: Exact date vs ±1 day vs ±3 days
Each combination produces a different number from the same shipment data. 95% sounds strong – until you discover it was measured the easy way.
For manufacturers supplying retail or automotive chains, OTIF manufacturing standards are even stricter – measured by complete order, on the original date, with no tolerance. World-class OTD sits at 95-98% when measured against the original customer-requested date, by complete order.
Manufacturers who want to close the gap will need to learn how to measure KPIs before any improvement programme can take hold.
Why chasing OEE can actively harm your delivery performance
Your machines are hitting record efficiency – and your customers are still waiting for their orders. The problem is often OEE itself.
Research shows this is more common than you think:
- A plant can achieve 95% OEE by running easy, long-duration jobs while simultaneously destroying its schedule adherence against customer orders
- Highly utilised equipment and large batch sizes may look productive but end up slowing the flow of work and extending lead times.
- Optimising OEE does not optimise for delivery; the two goals are not aligned and pursuing one can directly damage the other.
Consider a shift supervisor measured purely on OEE. To protect the number, the team sequences the longest production runs first — minimising changeovers, keeping utilisation high. Machine efficiency reads 88% for the week. Four urgent customer orders requiring short runs were pushed to Thursday. Two missed their delivery window. The machines performed well. The customers did not receive their orders on time.
A factory hitting record OEE while missing delivery targets has not performed well. It has optimised the wrong metric.
Schedule adherence as a KPI must be monitored and governed separately from equipment efficiency – because teams rewarded on OEE will always find ways to hit it, even at the expense of customer commitments. It is one of the clearest examples of why KPIs fail when the metric being chased stops reflecting the outcome that actually matters.
Leading indicators: Catch delivery failures before they happen
Delivery can also fail when your schedule assumes 100% of your planned production time is available, but in reality, your floor may be running on 82%.
An operations manager reviews OTD every Friday. The number always remains 11 to 14 percentage points below target. Every week, root cause analysis points to unplanned stoppages which are filled in paper sheets at the end of the shift. Meanwhile, the production audit reveals actual unplanned downtime is running a 21% of available time – the reported figure is 9%. The gap between those two numbers points exactly to the weekly delivery shortfall. The problem was never hidden – it was not being measured at a time when anyone could act on it.
The stakes? 18% hidden downtime is the equivalent of losing nearly one full working day per week, invisible, with no corrective action triggered.
This is mainly because:
- Hidden downtime consumes nearly 18% of available production time. These losses went undetected as the operators recorded stoppages manually on paper at the end of each shift.
- On-time delivery is a lagging indicator. By the time a delivery is late, the underlying problem has already occurred, and recovery options are no longer applicable.
These issues cannot be solved by working more hours. They are solved by measuring at the right time.
- Real-world evidence supports this: after implementing real-time machine monitoring, a precision machining company reduced hidden downtime by 30% and achieved a 14% lead time reduction – a direct result of manufacturing teams gaining visibility before the problem compounded.
- A separate manufacturer achieved a 20% increase in machine run rate and a 45% reduction in changeover time by replacing disconnected tracking with an integrated digital system – without any capital equipment investment.
Factories still running on manual boards that can no longer keep up with real-time production data repeat this cycle every week.
How LTS Data Point fixes delivery KPI failure at every level
Every failure mode shares one root cause: the right information did not reach the right person at the right time.
LTS Data Point closes that gap as a connected daily management system – not as a reporting layer on top of existing tools, but a platform that links planning to execution across every tier.
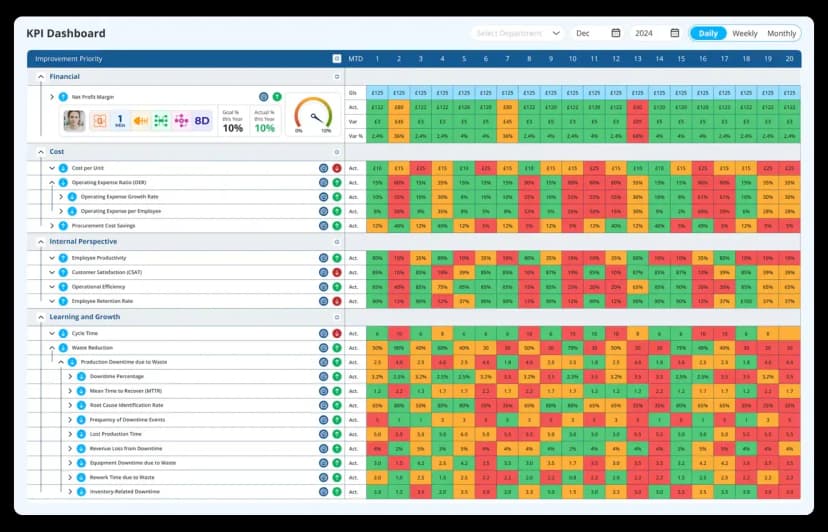
- LTS Data Point KPI management module tracks plan vs actual delivery performance across every shift, department, and tier – so the gap between the schedule and reality is visible before it becomes a missed order.
- It structures delivery performance as the D pillar within SQDCP – so it is reviewed alongside safety, quality, cost, and people at every tier meeting, daily.
- The 4C problem-solving framework – Concern, Cause, Countermeasure, Confirmed – ensures every red delivery KPI triggers an assigned, tracked, and closed corrective action with a full audit trail.
- KPI Bowling Charts and scorecard dashboards give operations managers a single manufacturing KPI dashboard view of delivery performance alongside quality, cost, and people – daily, weekly, and monthly.
- LTS Data Point supports tiered management from Tier 1 shopfloor to Tier 3 leadership – delivery issues unresolved at operator level are escalated with full context and accountability at each tier.
This is how manufacturers improve OTIF through daily management – not by chasing the number at month end, but by governing the conditions that produce it every shift.
See how Kineco achieved real-time KPI visibility and shopfloor accountability across every operational level with LTS Data Point: How Kineco Achieved Operational Excellence with Shopfloor Performance Tracking Software
Delivery KPIs do not fail because manufacturers stop caring about them. They fail because the data arrives too late, means different things to different people, and lives in systems that were never designed to talk to each other. Fix the system, and the KPI follows.
Your delivery KPIs are telling you something is broken – talk to an LTS Data Point expert and find out what
FAQs
1. What is the difference between OTD and OTIF?
On-time delivery measures whether an order arrived by the agreed date. On-time in-full measures whether it arrived on time and complete. A shipment can pass OTD and fail OTIF if any items are missing. OTIF is the stricter and more customer-relevant measure of the two.
2. What is realistic OTD target for a mid-size manufacturer?
For most mid-size manufacturers, a realistic starting target is 90-93% when measured by complete order against the customer-requested date. World-class performance sits at 95-98%. The gap between where you are and where you want to be is usually a measurement and visibility problem before it is an execution problem.
3. How does supplier delivery performance affect internal OTD?
Late or incomplete inbound deliveries push internal schedules before production even begins. The ISM Supplier Deliveries Index reached 58.9 in March 2026 – its highest since mid-2022 – signalling that external delivery pressure is increasing. Internal leading indicators and daily management routines are the only reliable buffer when supplier timelines become unpredictable.
4. Can small manufacturers benefit from delivery KPI tracking, or is it only for large operations?
Delivery KPI discipline matters more in smaller operations, not less – because smaller teams have fewer resources to absorb a missed order or a recovery cycle. The tools required are not enterprise-scale. A structured daily management system with clear ownership at each tier works at any size.
5. How long does it typically take to see improvement in OTD after implementing a daily management system?
Based on documented manufacturing cases, meaningful OTD improvement typically becomes visible within six to twelve weeks of implementing structured daily management – particularly when leading indicators replace end-of-week lagging reviews. The speed across tiers, not the complexity of the tool.