Food Manufacturing KPIs: Measuring Quality, Safety, Compliance, and Operational Efficiency
Last updated on : April 27, 2026
In food manufacturing industry, the margin for error is razor thin. A single quality failure can trigger a recall. One missed compliance check can result in a regulatory warning.
That is why food manufacturing KPIs matter – they are the metrics that keep your production team ahead of these risks, not scrambling to contain them. When you track the right food production performance metrics across quality, safety, compliance, and efficiency, you gain the visibility to make confident, timely decisions.
See how LTS Data Point helps food manufacturers track every KPI that matters – in real time, across every shift
Why you cannot afford to track the wrong metrics
Most food manufacturers track something. This something becomes worse when they are monitored on scattered spreadsheets, delayed reports, and disconnected systems creating blind spots, which will eventually burn your pockets.
When your team lacks a unified view of food safety KPIs and operational data, decisions get made on fragmented information.
Defects go undetected until they reach your customers. Near-misses go unreported. Compliance gaps surface during audits rather than before them.
Eventually, the most frequently asked question arises:
The consequences are well-documented:
- The average direct cost of a food recall sits around £8 million, with nearly a quarter exceeding £24 million
- FDA food recalls rose 8% in 2024, with hospitalisations and fatalities both increasing year-on-year
- Undeclared allergens remain the leading recall trigger — a failure that structured quality tracking consistently prevents
If you’re still struggling, then there’s a lot for you to consider before it gets worse. The right set of food manufacturing KPIs tracked in the right manufacturing KPI dashboard tailored for your needs will be the first step for you to get it right.
Food manufacturing KPIs that drive your industry
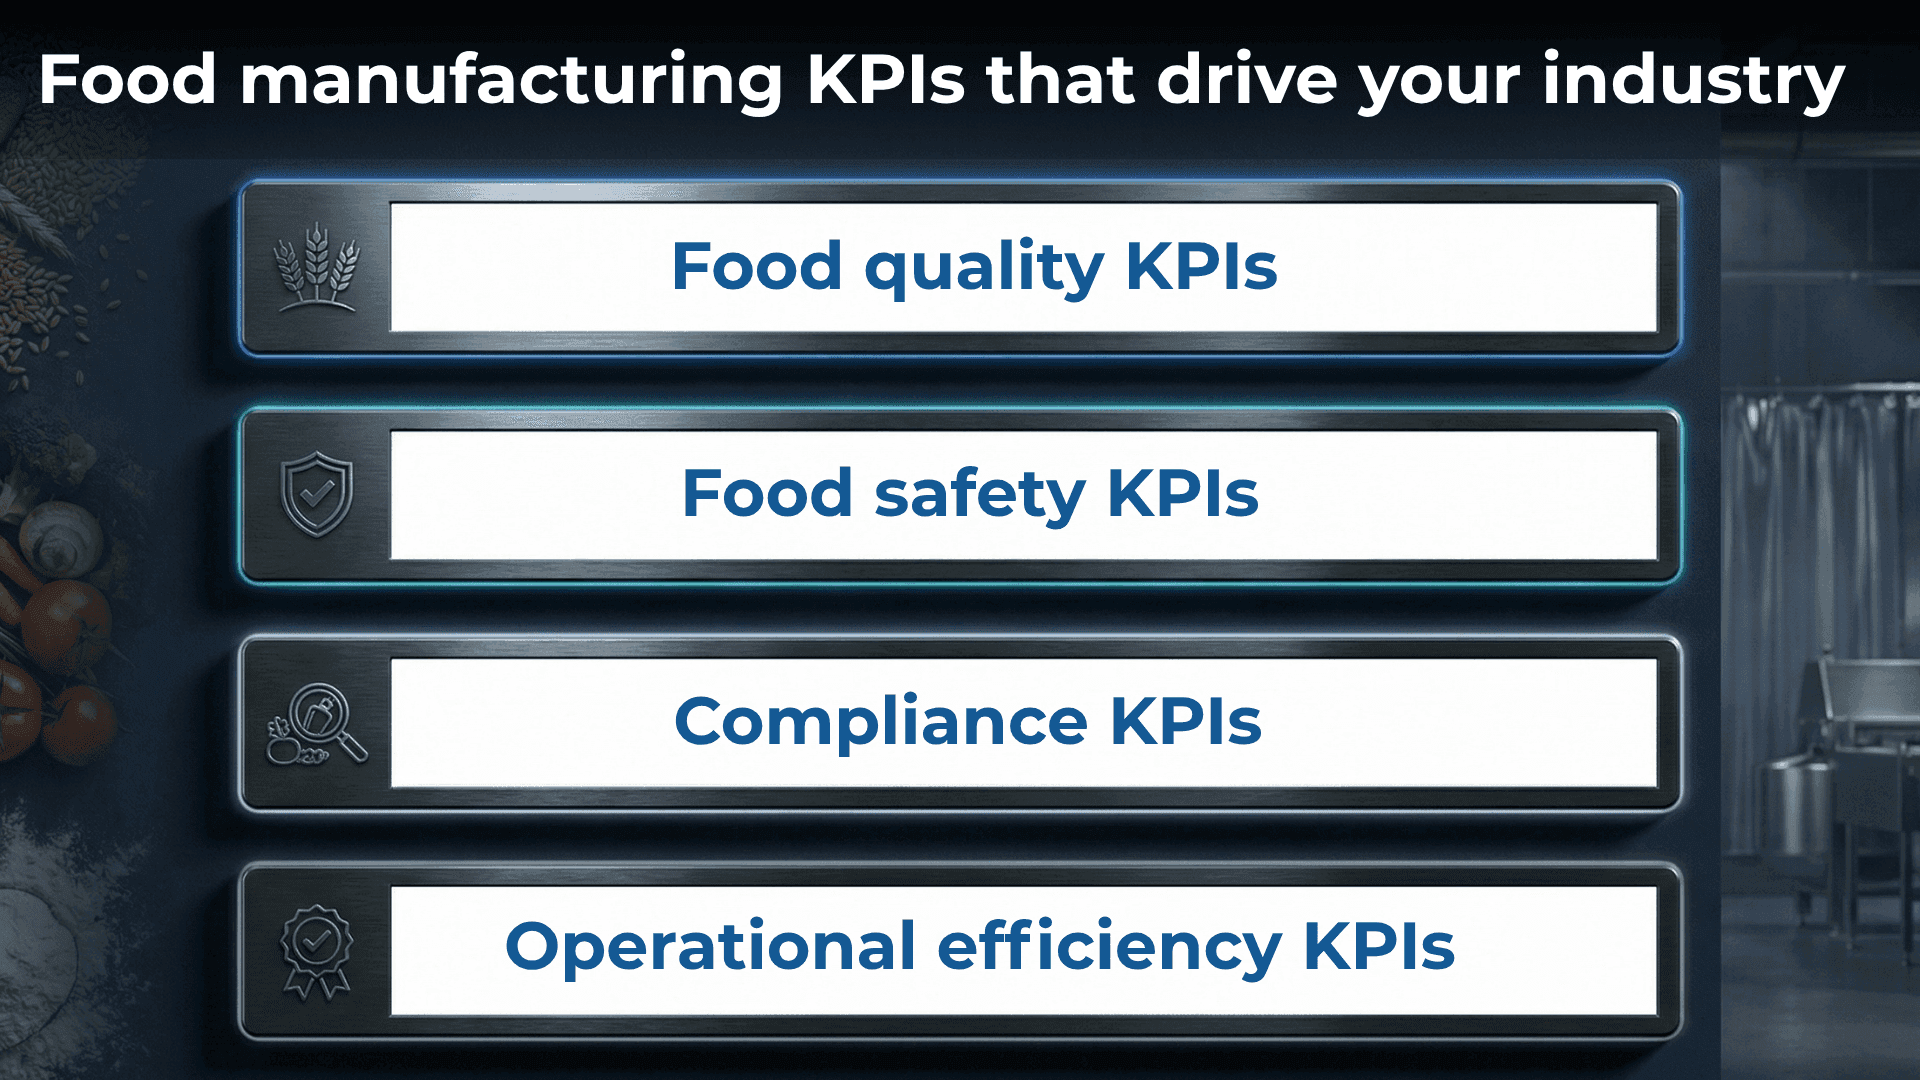
Food manufacturing metrics can be broadly divided into four divisions – quality, safety, compliance, and operational efficiency KPIs.
Food quality KPIs: Measuring what leaves your line
Food manufacturing quality KPIs define whether your product consistently meets the standard your customers and regulators expect. Tracking these quality KPIs at line level – not just final inspection – gives your team the ability to catch and correct issues before they pile up.
Let's look at some of the quality KPIs that you need to track:
1. First pass yield: The percentage of product produced correctly on the first attempt, without rework or rejection.
- Why it matters: FPY reveals hidden inefficiency at the line level. A target of 95% or above is the benchmark for high-performing food plants – anything below that signals systemic quality issue which is worth investigating.
- How to calculate: FPY = (Units produced without rework / Total units started) x 100
2. Defect rate: The proportion of output that fails to meet your quality specifications.
- Why it matters: Tracking defect rate by line, shift, and product type tells you exactly where quality is breaking down – not just that it is.
- How to calculate: Defect rate = (Number of defective units / Total units produced) x 100
3. Rework rate: The volume of product that requires reprocessing before it meets specification.
- Why it matters: Every rework cycle adds direct labour cost, consumes capacity, and reduces throughput. High rework rates often point to upstream process instability.
- How to calculate: Rework rate = (Units reworked / Total units produced) x 100
4. Customer complaint rate: The number of customer complaints received relative to your output volume.
- Why it matters: This is a lagging indicator – it tells you how your quality system is performing from your customer’s perspective, where the stakes are highest.
- How to calculate: Customer complaint rate = (Number of complaints / Units shipped) x 100
5. Rejection rate: The percentage of product rejected either internally at inspection or externally by customers and retailers.
- Why it matters: External rejections are particularly damaging – they signal that internal quality controls failed to catch the issue before it reached your customer.
- How to calculate: Rejection rate = (Units rejected / Total units inspected) x 100
These food manufacturing quality metrics are most powerful when surfaced through a quality management dashboard – reviewed daily, at shift level, with clear ownership for corrective action.
Food safety KPIs: Leading indicators that protect your people and your brand
Safety in food manufacturing covers two areas: workplace safety for your people and food safety for your consumers. Both need dedicated KPIs – and both benefit far more from leading indicators than lagging ones.
Workplace safety KPIs include:
1. Total recordable incident rate: The number of OSHA-recordable injuries per 100 full-time employees in a given year.
- Why it matters: TRIR gives you a standardised benchmark to compare safety performance across shifts, sites, and industry averages. A rising TRIR is an early warning sign – before a serious incident occurs.
- How to calculate: TRIR = (Number of recordable incidents x 200,000) / Total hours worked
2. Lost time injury rate: The number of workplace injuries that resulted in at least one missed workday.
- Why it matters: Lost time injuries directly impact production capacity and carry significant human and financial cost. LTIR tracks the severity of incidents, not just their frequency.
- How to calculate: LTIR = (Number of lost time injuries x 200,000) / Total hours worked
3. Near-miss reporting rate: The number of near-miss incidents reported over a defined period.
- Why it matters: This is a leading indicator – a higher near-miss reporting rate signals a stronger safety culture, not a worse one. Teams that report near-misses are detecting hazards before they become incidents.
- How to calculate: Near-miss rate = Total near-misses reported / Total hours worked x 200,000
Food safety KPIs include:
4. HACCP compliance rate: The percentage of Critical Control Points operating within their defined critical limits.
- Why it matters: HACCP compliance rate is one of the most direct indicators of your food safety management system’s effectiveness. Deviations at a CCP represent a genuine risk of unsafe product reaching consumers.
- How to calculate: HACCP compliance rate = (CCPs in compliance / Total CCPs monitored) x 100
5. Non-conformance rate: The frequency of deviations from food safety or quality standards over a defined period.
- Why it matters: Non-conformances that go unresolved compound over time. Tracking frequency and severity helps your team prioritise the corrective actions that carry the most risk.
- How to calculate: Non-conformance rate = (Number of non-conformances / Total inspections or audits) x 100
6. Corrective action closure rate: The percentage of identified non-conformances resolved within the agreed timeframe.
- Why it matters: Speed of resolution matters as much as identification. A low closure rate means your safety system can spot problems but struggles to fix them – which regulators and auditors will notice.
- How to calculate: Closure rate = (Corrective actions closed on time / Total corrective actions raised) x 100
When you track food safety KPIs proactively, you can spot patterns before they translate into incidents, regulatory action, or a recall situation your leadership team did not see coming. Tracking these alongside your continuous improvement metrics ensures safety performance feeds directly into your improvement cycle rather than sitting in a separate system.
Compliance KPIs: Staying audit-ready every day, not just when the auditor arrives
Compliance KPIs in food manufacturing are not just about passing audits – they are about maintaining the systems that prevent failures in the first place. Whether your plant operates under HACCP, BRC, SQF, or FSSC 22000, you need demonstrable, consistent performance against defined standards.
Key compliance KPIs include:
1. Audit pass rate: The percentage of operations that meet food safety audit criteria across internal and external assessments.
- Why it matters: A rate of 90% or above indicates a well-governed food safety management system. Below that threshold, you are carrying regulatory risk that will surface – if not in your next audit, then in the one after.
- How to calculate: Audit pass rate = (Audits passed / Total audits conducted) x 100
2. Supplier compliance rate: The percentage of your suppliers who hold GFSI-recognised certification.
- Why it matters: Your food safety system is only strong as its weakest upstream link. Supplier compliance rate gives you visibility into risk you cannot always see from your own plant floor.
- How to calculate: Supplier compliance rate = (Compliant suppliers / Total active suppliers) x 100
3. Mock recall completion time: The time taken to execute a full traceability exercise from trigger to resolution.
- Why it matters: Regulatory bodies expect manufacturers to demonstrate recall readiness. If you cannot trace and isolate a product batch within a defined window, your recall preparedness falls short of industry expectations.
- How to calculate: Mock recall completion time = Time of full batch isolation – Time of recall trigger
4. Regulatory non-conformance frequency: The number of deviations identified during internal and external audits over a defined period.
- Why it matters: Frequency trends matter more than individual incidents. A rising non-conformance count signals that your compliance systems are under strain – before a regulator flags it formally.
- How to calculate: Non-conformance frequency = Total non-conformances identified / Audit period (month or quarter)
Around one in four food manufacturers still lacks structured food safety KPIs, managing compliance reactively through audits and incidents. In an environment of increasing regulatory scrutiny, that approach carries a risk your business cannot afford to carry.
Operational efficiency KPIs: Finding the performance your plant is already capable of
Operational efficiency in food production determines how much value your plant generates from the resources you already have. This is often where production managers and C-suite leaders find the greatest opportunity – and the greatest hidden loss. Manufacturing KPIs for CEOs enable the leadership to make data-driven decisions.
Key operational efficiency KPIs include:
1. Overall equipment effectiveness: A composite metric that combines equipment availability, performance rate, and quality output into a single score.
- Why it matters: The food and FMCG sector averages 55-65% OEE against a world-class benchmark of 85%. The gap between those two figures is the capacity your plant already has but is not using.
- How to calculate: OEE = Availability x Performance x Quality
2. Throughput: The volume of finished product produced within a defined time period.
- Why it matters: Throughput tells you whether your production plan is translating into actual output. Consistent shortfalls point to bottlenecks, downtime, or changeover inefficiencies that need addressing.
- How to calculate: Throughput = Total units produced / Time period (hour or shift)
3. Unplanned downtime: The total non-productive time during scheduled production caused by unexpected equipment failure or stoppages.
- Why it matters: Unplanned downtime is the primary drag on OEE in most food facilities. Every unplanned hour is a direct loss of capacity. In food production, it often carries waste and quality risk on top. See how one food manufacturer tackled this issue directly in our case study – How a Food Manufacturer Cut Downtime by 25% with KPI Dashboards?
- How to calculate: Unplanned downtime % = (Unplanned downtime hours / Scheduled production hours) x 100
4. Waste and scrap rate: The percentage of raw material input lost during the production process.
- Why it matters: Even at modest scrap levels, a mid-sized facility can lose significant sums annually in wasted material alone – before factoring in the labour and energy costs associated with producing it.
- How to calculate: Scrap rate = (Material scrapped / Total material input) x 100
5. On-time in-full: The percentage of customer orders delivered on time and in the correct quantity.
- Why it matters: OTIF is the efficiency KPI your customers can see most clearly. Poor OTIF performance signals upstream issues in production planning, downtime management, or changeover efficiency – and it affects customer retention directly.
- How to calculate: OTIF = (Orders delivered on time and in full / Total orders) x 100
6. Changeover time: The time taken to switch production between product runs, formats, or allergen zones.
- Why it matters: Changeover time is a major OEE drag in food plants managing frequent allergen segregation or format changes. Reducing it without compromising food safety protocols directly increases productive capacity.
- How to calculate: Changeover time = Time from last good unit of previous run to first good unit of next run
These food production performance metrics are most actionable when they are visible in real time, at the point where production decisions are being made – not surfaced in a weekly report after the shift has closed and the opportunity to act has passed.
How LTS Data Point supports food manufacturing KPI tracking
Tracking food manufacturing KPIs across quality, safety, compliance, and efficiency requires more than a spreadsheet. You need a system that connects your data, surfaces issues in real time, and gives every level of your industry the right view at the right time.
LTS Data Point is built exactly for this kind of structured, multi-domain performance management:
- Production KPI dashboards give your team live visibility into OEE, OTIF, scrap rate, reject rate, rework rate, and machine downtime – all in one place, updated live across shifts and lines
- Huddle boards give structure to your daily performance reviews across Safety, Quality, Delivery, Cost, and People – so every shift starts with a clear, shared view of where performance stands
- Bowling chart tracks KPI goals versus actuals with RAG status indicators and weekly, monthly, and year-to-date views – giving leadership the trend visibility they need without waiting for a report to be built
- Quad chart with action plans connects every KPI deviation to a root cause, a corrective action, an owner, and a deadline – closing the loop between spotting a problem and resolving it
- Role-based dashboards ensure your operators, production managers, and C-suite are each seeing the metrics relevant to their decisions – from the same system, without manual translation or conflicting figures
Food manufacturing KPIs are not a reporting exercise – they are the foundation of a production system that is safe, compliant, and consistently efficient. When you track quality, safety, compliance, and operational metrics together in real time, you move from reacting to problems to preventing them. That shift from reactive to proactive is where performance is genuinely won.
Every shift without structured KPI tracking is a shift your food plant cannot get back. See how LTS Data Point changes that
FAQs
1. How many KPIs should a food manufacturing plant track?
A focused set of 8-12 KPIs across quality, safety, compliance, and efficiency is a practical starting point. Tracking too many dilutes focus – start lean and expand as your team matures in how it uses the data.
2. Should small food manufacturers track the same KPIs as large facilities?
The core KPIs apply regardless of size. What changes is granularity and resource availability. Smaller facilities benefit from starting with five or six well-defined KPIs rather than replicating a large-plant framework from day one.
3. What is the difference between a food safety KPI and a food quality KPI?
Food safety KPIs measure whether your product is safe to consume – HACCP compliance, non-conformances, corrective action closure. Food quality KPIs measure whether it meets customer expectations – defect rate, first pass yield, complaints. Both are essential but serve different risk management purposes.
4. How do you set realistic KPI targets in food manufacturing?
Start from your current baseline, then benchmark against industry averages. Targets should be directionally ambitious but achievable in stages – jumping straight to 85% OEE from 55% is aspirational, not actionable. Review targets quarterly as performance improves.
5. Can food manufacturing KPIs support supplier management?
Yes. Supplier compliance rate, incoming material rejection rate, and supplier OTIF extend your performance management upstream – where many quality and compliance failures actually originate.
6. What is the role of shift-level KPI tracking?
Shift-level tracking is where operational KPIs become genuinely actionable. Reviewing defect rate, downtime, and yield per shift allows your team to spot patterns and act before issues compound across multiple production runs.

Amer Jumah, Senior Lean Consultant
Amer is co-founder of Agile Solutions and a certified Six Sigma Black Belt, Lean Black Belt, and PMP, with over nine years of experience implementing Lean, Six Sigma, and Agile principles across diverse industries. He specialises in process optimisation, waste elimination, and delivering cost savings through organisational change.