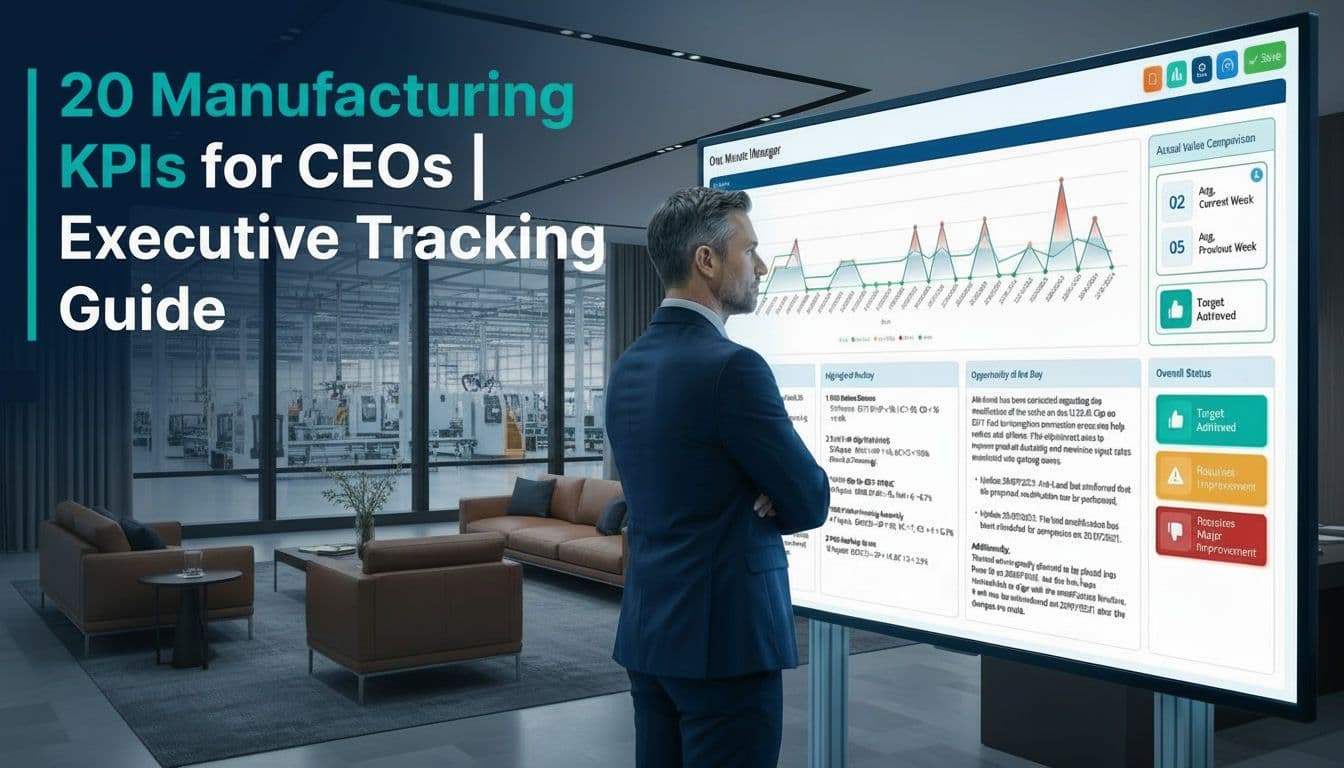
20 Manufacturing KPIs for CEOs: The Executive Guide to Tracking What Actually Matters
Last updated on : March 31, 2026
Manufacturing KPIs (Key performance Indicators) for CEOs are the specific performance indicators that help senior leaders assess whether strategy is being executed, operations are stable, and the business is genuinely improving, not just reporting. Unlike operational metrics, these KPIs are designed to answer executive-level questions: Are we on track? Where is performance at risk? Who owns the response?
Why Do Manufacturing CEO KPI Dashboards Fail to Drive Results?
"We have dashboards everywhere. We still have no idea what's really happening until it's too late."
That is not a data problem. It is a signal problem.
Most organisations track too many metrics, at the wrong level, with no structured connection between what the shopfloor is doing and what leadership needs to know. The result? Monthly reviews that describe last month's problems. Actions raised in meetings that nobody follows up. Strategy that lives in a slide deck and dies before it reaches the production floor.
The fix is not more dashboards. It is fewer, sharper KPIs; built around accountability, not just visibility.
A CEO with 12–15 strategically aligned KPIs will consistently outperform a CEO buried in 50-metric reports. The research supports it. So does experience.
This guide covers 20 manufacturing KPIs for CEOs, organised into four strategic pillars each with a tracking method and a route to digital action. Unlike general Manufacturing performance KPIs which cover operational KPIs across all management levels manufacturing KPIs for CEOs are specifically concerned with enterprise-level signals. Detailed categorisation is given below.
The 4 Pillars of Manufacturing KPIs for CEOs
Pillar 1: Strategy Execution KPIs
These KPIs tell a CEO whether the organisation is converting its strategic plan into operational reality across all sites, departments, and levels.
KPI 1: Strategy Execution Rate
The single most important CEO-level manufacturing KPI. It answers: "Is our strategy actually being implemented, or is it stalling between planning sessions?" High execution rate means the organisation is moving. Low rate means initiatives look great on paper and produce little on the floor.
KPI 2: Cross-Site Execution Alignment
For multi-site manufacturers, misalignment between sites quietly destroys enterprise performance. One plant executing a quality strategy while another is still firefighting delivery means the whole cannot outperform the weakest link.
KPI 3: Outcome Predictability Index
An organisation that consistently meets its targets — even modest ones — is demonstrating it understands its own processes. Unpredictable results signal that the operation is not in full control, which makes strategic commitments unreliable.
KPI 4: Strategic Initiative Impact Rate
This is where most organisations have a blind spot. Initiatives get completed, milestones get ticked, and the original problem returns six months later. Tracking “impact” not just “completion” is what separates genuine improvement from structured activity.
KPI 5: Bottleneck Concentration Index
High concentration means a few constraints are restricting total output. A CEO who knows where bottlenecks are concentrated can make targeted capital and resource decisions. Without this signal, investment spreads thin and returns are disappointing.
For how to structure the visual management layer behind these reviews, see manufacturing KPI dashboard best practices.
Pillar 2: Operational Stability KPIs
These KPIs answer a fundamental executive question: "Can I trust our manufacturing performance to behave as expected?"
Stability is the foundation of everything else; customer commitments, financial forecasts, and strategic investment.
For a deeper look at real-time KPI visibility and how live dashboards are structured for manufacturing leaders, see why 2026 belongs to real-time KPI dashboards.
KPI 6: Enterprise Performance Volatility
This is a control KPI, not a productivity KPI. It does not tell you whether performance is good or bad — it tells you whether it is predictable. High volatility means the organisation is firefighting. Low volatility means it is operating within a controlled system.
KPI 7: OTIF Delivery Rate
OTIF is where manufacturing performance meets customer experience. A business can report healthy OEE and FPY internally while OTIF quietly declines — because delivery failures are often caused by the combined effect of multiple small operational problems, not one obvious root cause.
KPI 8: Overall Equipment Effectiveness (OEE)
World-class OEE in most sectors sits around 85%. Most manufacturers operate below this. The gap between actual and theoretical OEE is recoverable capacity — and it deserves executive attention as a financial opportunity, not just an engineering metric.
KPI 9: First Pass Yield (FPY)
When FPY falls, the process is telling you something: there is variation somewhere in materials, methods, machines, or people that has not been controlled. Every failed unit is wasted time, material, and labour — and a potential risk to on-time delivery.
KPI 10: Unplanned Downtime Rate
High unplanned downtime is the clearest signal that the organisation is reactive. It means equipment is being managed after it breaks, not before. At a CEO level, the trend of this KPI matters more than any single month's number.
KPI 11: Customer Satisfaction / NPS
Internal KPIs tell you what you produced. NPS and customer satisfaction tell you what the customer experienced. These are not the same thing. Tracking both closes the loop.
The KPIs in this pillar — OEE, OTIF, FPY, and unplanned downtime — have detailed operational definitions and calculation methods covered in the manufacturing KPIs reference guide. Also refer the see the full operations manager KPI guide. A CEO's role is to read the enterprise trend, not the daily number and to act when that trend itself becomes the problem.
Pillar 3: Accountability & Response KPIs
"We know what the problem is. We just can't seem to fix it."
This comment appears repeatedly in operations management meetings. The reason is almost always the same: visibility without accountability. Data without ownership. Reviews without action.
These KPIs measure whether the organisation can act on what it sees.
KPI 12: Accountability Coverage Rate
Before any performance conversation can be productive, there must be clarity about who is responsible for each outcome. Not in an org chart — visibly, in the management system, with a name attached to every active KPI and action item.
KPI 13: Corrective Action Effectiveness Rate
This is one of the most revealing KPIs in manufacturing. An organisation that raises many corrective actions but closes them without verifying outcomes will repeat the same problems indefinitely. The question is not "did we close the action?" but "did the problem go away — and stay away?"
KPI 14: Decision Response Time
Slow decisions compound problems. A production issue that waits two weeks for escalation has already caused lost output, customer risk, and team frustration. This KPI measures whether the management system is enabling fast responses or creating bottlenecks.
KPI 15: Action Plan Closure Rate
If actions are raised and not closed on time, the management system is broken, regardless of how sophisticated the tools are. This KPI is a daily management discipline indicator. High closure rates mean commitments are being honoured. Low rates mean promises are made without follow-through.
KPI 16: Performance Risk Exposure Index
A forward-looking risk signal. It shows where things are likely to go wrong if no intervention occurs — before the customer commitment or financial target is missed. This is the executive version of an early-warning system.
Pillar 4: Improvement & Sustainability KPIs
A manufacturing business that maintains current performance without improving is losing ground to competitors who are. These four KPIs tell a CEO whether the organisation is genuinely developing its capabilities or just staying flat.
KPI 17: Cost Exposure Trend
This is not the same as reviewing the P&L. Cost exposure trend looks at leading signals areas where spend is diverging from plan before it shows up as a financial variance. A three-month trend is a signal. A single month may be noise.
KPI 18: Sustainability Execution Credibility
Customers, investors, and regulators increasingly scrutinise manufacturing organisations on ESG delivery, not just ESG intent. A CEO who sets sustainability targets without operational execution systems to support them carries reputational and compliance risk.
KPI 19: Manufacturing Performance Management Effectiveness
This is a meta-KPI. It measures the quality of the management system itself. The best KPI tools in the world do not compensate for inconsistent review disciplines, meetings with no actions, and escalations that go nowhere.
KPI 20: Revenue Per Employee
Rising revenue per employee over time while maintaining or improving quality and safety- indicates genuine productivity improvement. It is one of the most useful summary indicators of whether investment in people, process, and technology is generating real return.
What Manufacturing CEOs Need Beyond KPI Tracking: From Data to Decisions
A pattern that surfaces consistently across manufacturing leadership communities is telling:
"Our KPIs are fine. Nothing changes after the review meeting."
That is a management system problem — not a measurement one. And it is the most common reason manufacturing CEOs find themselves reviewing the same issues, quarter after quarter.
KPI tracking tells you what happened. A CEO-level management system determines what happens next.
For a CEO, the question is not whether your organisation has KPIs. It is whether your KPIs are connected to a system that forces a response when performance deviates.
For a detailed tool-level comparison of manufacturing KPI software options, see which manufacturing KPI tool is best for 2026. The focus here is specifically on what changes at the CEO decision-making level.
Three things must be true for manufacturing KPI management to work at executive level:
- Every strategic KPI has a named owner and a defined review cadence
- Every red condition triggers a time-bound action - not just a discussion
- Every corrective action is verified against the KPI it was meant to fix - not just marked closed
The bottom line for manufacturing CEOs
Most manufacturing organisations do not have a KPI problem. They have an execution gap -the distance between what the dashboard shows and what the organisation actually does about it. The KPIs in this guide are not new metrics to add to a report. They are signals that demand a named owner, a response time, and a verified outcome.
A manufacturing CEO who can answer for every red KPI:
- Who owns this?
- What is the action?
- When will it be resolved?
Is not just tracking performance. They are managing it. That is the difference between a business that improves year after year and one that holds the same conversations in the same meeting rooms indefinitely.
Looking for the best CEO KPI Dashboard fit for your business? Try LTS Data Point.
LTS Data Point is a connected lean performance management platform that helps manufacturing organisations move from KPI visibility to real execution through daily management, strategy deployment, problem solving, and action accountability in a single connected system.
Explore the CEO- Level KPI Dashboard Today
FAQs
1. What manufacturing KPIs should a CEO focus on?
CEOs should focus on KPIs that answer four questions: Is strategy being executed? Is operational performance stable? Is there accountability for outcomes? Is the business genuinely improving? The 20 KPIs in this guide are structured around these four pillars.
2. How many KPIs should a manufacturing CEO track?
Research and experience consistently support 12–15 well-chosen KPIs at executive level. More than this creates noise and reduces decision quality. Each KPI must be actionable, connected to an owner, a review cadence, and a clear response protocol.
3. What is the difference between a manufacturing KPI and an operational metric?
A KPI is a strategically chosen indicator tied to a specific business objective, with a target, an owner, and a review process. A metric is a data point that describes process activity. CEOs need KPIs. Most manufacturing reporting currently gives them metrics.
4. How often should manufacturing KPIs be reviewed at CEO level?
Financial and strategic KPIs: monthly and quarterly. Operational stability KPIs: weekly at site level, with trend summaries monthly at executive level. Accountability KPIs: weekly. The principle is: review frequently enough to intervene, not so frequently that you are reacting to noise.
5. Why do manufacturing KPI reviews often fail to drive improvement?
Because visibility is not accountability. When KPIs exist in dashboards without ownership structures, escalation paths, and verified corrective action processes, they become review artefacts rather than management tools. The most common fix is not better dashboards it is a daily management system that connects the KPI to action.

Geandra Queiroz, Operations Management Consultant
Geandra is an Operations Management Consultant at Lean Transition Solutions, specialising in Lean philosophy, Lean Six Sigma, and strategic planning across manufacturing and healthcare. She is currently completing her PhD in Industrial Engineering at the Federal University of São Carlos, researching the integration of Operations Strategy, Lean, and Green Manufacturing.